Full Beginner Project in Tableau | Tableau Tutorials for Beginners
315.06k views8015 WordsCopy TextShare

Alex The Analyst
Check out my Full Tableau Course Here: https://www.analystbuilder.com/courses/tableau-for-data-visua...
Video Transcript:
what's going on everybody welcome back to the tablet tutorial series this is a very last video in the series and today we'll be doing an entire project [Music] now if you're watching this video i hope that you watch the other four videos in this series just so you can get the basics down you kind of know what you're doing uh this won't be a crazy hard project this is a beginner tutorial series so i'm trying to make this super easy so you can follow along nothing super complicated i promise and if you were wanting to
go above and beyond just make a lot of different dashboards or try a lot of different things there's a ton of data in here and so i'll show you some of the things that i would do you know as we go through it of the things that i would be looking at and some of the different visualizations that i might do as well but again in this video we're going to be singing to a lot of the basics but i'll switch over my screen in just a second i will show you the final product and
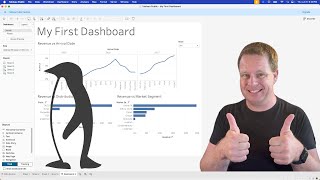
then we will actually walk through step by step of how to do the entire dashboard and at the end you should have a completed project that you can add to your portfolio or you know just share on linkedin if you want to do that as well with that being said let's jump over my screen and let's get started alright so let's get me off screen and show you what we're going to be working on today this is the final dashboard that we're actually going to be building and so it's nothing crazy right i'm sure you
have seen all these things before um and i'm just going to help you kind of build it out show you what to do the buttons to click and it's really going to be a simple walkthrough by the end of this you should be able to do all these things very easily and i highly encourage looking at the data and looking at these visualizations and seeing what else you can do with it there's a lot of different colors a lot of different visualizations that you can do with this data i'm just showing you this today and
so the more you go out there and the more you do this on your own and you mess around with stuff and then choose different things and see how it all works the better you're going to get and so i highly highly encourage doing that so what we are going to be working with today is an airbnb dataset i'm going to show you that in just a second and i'm going to show you the data and we're going to just jump right into it all right so this is the data set that we're going to
be using this is the seattle airbnb open data set and let's go down really quick there's three different csvs in here and so this is some of the data that we're going to be working with um some date on listings and some pricing and then there's the actual listing that shows um the actual street address the location the price the bedrooms all of these good stuff and then there's a reviews um and it has you know some comments and you know it talks about some of the reviews so this is what we're going to be
working with but you don't have to go in here and download it i have already combined all these csvs into one i've put it on the github so i'll have a link below so you can just click on that and you don't have to do all the stuff that i did to get this set up um just so you know this is from 2016 so this data set is a little bit old if you want to you can come right here and i will leave this link as well and you can get the data set
from you know what is this a couple weeks ago this is they they are continuing to update this this is always updated and so you can go ahead and download these but some of these are the csv.gz um so you may need to like convert it i don't want to go through that process um on you know in the video and so i am just going to go with what is literally in kaggle um and use that but if you want to have an updated one for your project i just advise you to go in
here and grab yourself and that should be perfectly good so go ahead and download the data set from the github and we should be good to go so this is the excel that i was just talking about this has all of our csvs in one place this is you know excel workbook so in this reviews actually let's start with the listings because that's kind of where all stems from we have our listing and the date or the data in here is um you know really extensive there's a lot of data in here so let's get
over really quick um the listing refers to the actual home that they're renting out the airbnb so it shows their location [Music] and there's a lot more location information over here i'm getting into it in just a second so there's the neighborhood the city state zip code all stuff that you know may be useful there's a latitude and longitude it shows what type of property it is so that's really good right over here it has you know how many bathrooms bedrooms and beds you know sometimes if it's a five bedroom house it's has seven beds
so that's why there's those two different fields i don't know if you're familiar with airbnb and you know what they have on there but just something to note they have the price this is the price per day there's a weekly price a monthly price and if there's a deposit needed and then a cleaning fee as well so a bunch of financial data that's you know super useful we go into it a little bit but there's so much you can do with that um you know if you want to dig into that and that's kind of
it the rest of it's pretty uh pretty useless and there's a lot of so there's so much data in here almost you know more than half by far is nothing you would put in any type of visualization um and this is pretty common you're not going to get data every column where you're going to be able to use it a lot of times it's just a lot of useless junk and so you have to know what you're looking for and know you know what's actually useful so that's the listing then we have reviews now what's
really can a little bit confusing in here and something that you just need to kind of understand about the data and something that if you're if you get a data analyst job you need to understand your data because it's very easy to come in here and say okay there's an id id field and here's an id field so that means that those are the same well not in this case um this id field is actually the review reviews id not the reviewer id that refers to like the person this is the reviews id this listing
id is the actual id right there so really important to note um and then the la and so then they just have their comment there what they left as a review and then on the calendar um i don't know why i'm scrolled down uh we have this listing id again so again that listing id is equal to the id in this listing table and we have a date and a price so this refers to a specific location and on this day they got 85 dollars for it somebody rented it out um and so then there's
these like t's and f's let's try to find a blank one really quick here's a blank one so there's these t's and f's uh the t means that it was taken the f means that it's vacant i don't know exactly what it means what the tnf means but that we can deduce that much from this and so you can see when and how much this person was making or this home made in that time so really really good data in here there's a lot to work with um and so we're just going to be kind
of i'll give you a little bit of a use case for it in a second and then we're going to start trying to answer some of those the building out some of the visualizations for that use case again you could have 20 different use cases for this data or more honestly for this data where you could build out different dashboards and different reports literally with just this data but you know we're doing a pretty general broad project and so it's hard to answer all of them so let's jump over to tableau we're going to get
started on this and we are going to build out everything all right so let's come right here uh this is a microsoft excel we'll open that up do this one we will open it and give it just a second it says it's executing the query it's pulling the data in all right so we have our calendar our listing and our reviews those are the different tabs at the bottom we're gonna start with the listing this is the the kind of the main one has um you know the there's i didn't show you but there's about
3 600 locations that they had in there uh let's just have it update automatically i don't know why we need to click on that but um so we have those listings we have our calendar and our reviews what we're going to do is i'm going to come in here and we're going to open it as we did in our very last video for the joins so now that we've opened it we can kind of go in here and we can do the joins as as needed and so let's go over here and we're going to
uh let's start with calendar i'm gonna put it right there that was super slow i apologize all right let's wait for it to get the data start setting everything up not think it would take this long i apologize no take your time so let's click on here and right now it has the uh the join based on the price which obviously is not going to work and if you remember there is no id in this calendar it's just the listing id um we can actually look right here there's just the listing id so we're actually
going to put listing id is equal to id and right down here we can see that we have a lot of well you can't see it but we show that there is a lot of data and so we know that that is correct we know that that is now pulling in data correctly because it's showing up down here so that's a good thing now in this listings there are about 3 600 about 3 600 listings and so that all the data that's in listings is going to be in there but on the calendar because we
converted from a csv to an excel workbook it isn't able to store as much information so some of the ones in calendar may have gotten cut off so we can just keep it this inner join because we know that if it's in listings it's going to be in calendar we know that it if it um there may be some in calendar that aren't in listings so if we really um you know if we really really wanted to we could do a full outer or something like that i haven't really thought through this as i'm talking
through it in my head but we know that everything that's in listening is going to be in calendar and so you know we don't really need to do anything other than an inner join and we can also pull in these reviews and it's going to do the same thing as before we're just kind of pulling in the data and it defaults to id equals id now we know that that is not correct because the id in here is referring to the review id we need to go to the listings id so we need the id
to be able to you know be part of that listings id if we do the id it goes down to 2555 rows if we do how it's supposed and because that's just you know it's random luck there happen to be some numbers that are in both fields that tie together if we do the correct one where we hit the listing id it bumps it up to i think two million three hundred and seventy three thousand oh maybe more than that uh 23 million rows right a lot lot more and so it's super important to get
these joins right to tie them together on the right fields if you just do it based off what tableau tells you because it has that automated um you know it goes into these fields and says okay these are the same exact column name so they're most likely going to be what you're looking for well it was incorrect at this point so it's really important to check those things and make sure you're pulling in the right data again we're going to keep it that inner join you know if you wanted to you know try to see
if there's any other data that correlates or keeping it simple today but sometimes you need to join on multiple things uh so just uh you know a tip so let's get out of here um and we are good to go so this is our listings plus tableau full project that's what we'll that's what we'll be working with um and we we were able to tie all three of these um you know as you'd call them tables or sheets or whatever you want to call them we were able to tie them together so let's go over
here to our first worksheet and let's see all right so this says tableau public only works with less than 15 million rows of data we have 23 million rows of data that is uh that's a problem um and when i did this before it didn't do that so i you know we're gonna work through this together so this is date reviews i believe this is date for um [Music] this is date for the calendar which is going to be a lot of rows of data and so i'm sure that's part of it let's see let's
do years we only want 2016 oops we only want 2016. [Music] let's do okay let's see what that does let's see if that gets us under what we need um we only want 2016 data anyways so if it's in 2017 we were gonna take it out um anyway so we'll see if that gets us underneath i have absolutely no if this thing ends up taking like 20 minutes i will just cut it and you know you won't have to wait as long as i'm waiting so let's see how long it takes all right so it
took about 20 minutes and it did absolutely nothing um one thing i do know is that we don't actually use this review tables at all just for demonstration purposes so we're going to remove that and let's see if that helps us in any way because if it does we're just going to keep it as is you know the reviews table is really just for demonstrating how to do the joins but we're actually using any of the data for any of the visualizations although you could again i want to see how long this takes uh and
i'll cut ahead all right so that worked uh perfectly it apparently took out all the data that we needed all the rows that we needed to get under that level again i was just doing that to show you the that joins how you need to change the columns to make sure that it joined properly we don't actually use for any of the visualizations so their end product is gonna be totally fine i don't know why uh this didn't happen to me when i when i created this whole thing already um so i'm just going to
move forward because i make mistakes so let's keep moving the first one that we are going to make is that uh it's that colorful one i'll probably pop it up on screen so you can see it well if i remember i'm going to pop it up on screen it's the colorful one it's the price by zip code so we're looking at these zip codes and kind of see you know how expensive is each zip code and before we actually start i just remembered i want to talk to you about the use case for this data
i want to imagine you to imagine that you're working for somebody they're like hey where you know i want to start an airbnb business i want to know where i should go where should i buy a buy a home put it up on airbnb and start renting it out where's the best place you know what are some of the factors that i should be looking at uh and so that's kind of what our use case is so we're gonna the some of the things that he cares about are things like bedrooms location which is really
important and how much price he's actually going to get how much money can he charge and so he's trying to optimize that to make sure that whatever rental he gets he can make a lot the most profit from instead of choosing something that you know he thinks would work but you know in the end he's actually not making that much money so those things are important so that's our use case we're trying to help this guy out help them find a really good airbnb um so let's take a look at these zip codes real quick
we have quite a few of them and there's one that's null we'll exclude that or if it doesn't have a zip code we'll just exclude those because they're not going to show up on these visualizations anyways and so we want to look at the price so we just want to find the price which should actually be down here and not the sum [Music] no we want to look at the average price and let's order that this is great so this is the most expensive one zip code 98134 at 206 per for the average price but
let's give that some color really quick let's uh that where's this look good it's up here so let's take that zip code we're going to put it right over here i'm going to do color and it's going to give it some assorted colors now these colors are gonna when we do the map but just a little bit these colors will match what we're doing in there and so you know i like to try to color coordinate things we're not doing going too crazy with the colors today so this is our very first visualization congratulations it
is uh it is complete so uh we can label this one and we can just do price by zip code and i'll make that bold i don't know i usually like it bold i will apply i'll do like that and boom first one is done uh and this is our starting place to say uh hey person who's looking to buy this airbnb here are the zip codes where they are able to charge the most um for for their airbnb so let's go over to the second sheet and we're going to be doing the map and
so map is pretty easy but it it's pretty easy once you actually get the data that you need although there's a lot of different data that you can use for the actual map right here you need something that shows the location and there's a lot of things that show location in here in fact they already um provide a latitude and longitude and then at the bottom they generated a latitude and longitude from from some different fields and then there's just a bunch of different um state there's states there's zip codes there are i think another
one yeah like country there's a lot of location data in here so which one do we want to use we want to stay consistent we don't want to deviate from that and start using different um longitude and latitudinal uh coordinates because that could throw off our our results completely we want to stay consistent with what we're using so we actually want to use this zip code but when we pull it up here it's going to give us basically the same you know it's going to show these zip codes but we're going to right over here
we're going to click on this one and now it's going to separate them out so now we have all of these you know kind of separated out what you might get when you first do this is it might look like this you may have to zoom in i know that happened to me the other time excuse me go to here that's what happened to me uh just when i first did it so uh know that that may happen and we want to change the colors the exact same way that we did them before so we're
just going over here we're doing color and these colors do um they do [Music] or should match up with the um with the other ones let me um exclude this let me see if it does nine eight one three four that's the blue and right over here nine eight one three four it's a blue i i believe they are going to be the same yep and so just scrolling back if you look at the zip code on the far right they are the same so if you look at like this section right over here i
i'm just wanting to make sure i'm not going crazy before i get into this and realize i'm not correct at all so now what we want is you know this doesn't really give us any information if i was just a glance at this map i would have no idea what you're trying to show me any information off this so we want to show some actual information so first thing that we're going to do is we're going to actually add the label to this so that you can see it you know when you're going over here
and you see okay here's this zip code in the dash when we create it you can't click on this but if you just want to do it visually without having to click anywhere you'll be able to see okay 98134 that's right here so this location right here is you know able to charge a lot of money it's probably a really nice neighborhood so and we can back that up by putting the average price so these these two visualizations are really good they really go hand in hand now we're going to add oops not the sum
[Music] this one needs to be the average so you go to this measure the sum go to average and there you go and these should match so this should be 206.6 i'm looking at the average price right here and then we go over here 98134 206.6 so this all matches and we can we can actually change that size a little bit if you want to actually get it in get it within each of these things you know adjust it as you see fit i think that's fine right there um no need to mess with it
anymore [Music] all right so let me see i think that is everything for this one i don't know if i want to add anything else uh no i'm gonna keep it on this so that is our second visualization again these ones are directly uh correlated and you know this there's just different ways to visualize it this one you can see actually on the map where it is and the average price this one you can see from highest to low so again you know sometimes you're doing these visualizations you're going to have these accompanying um these
accompanying visualizations in your dashboard that's very normal so let's move over to the third one and for this third one um you know something that our guy was looking at is he's like okay well you know i'm thinking about listing it on airbnb but i also want to live in it so i want to know the best times to actually um you know put it on the market for people to be able to use and so i was like okay man no problem uh let's let's take a look at when it when are people spending
the most money in airbnbs and we actually have that calendar um if you remember let's look let's see this calendar so we have this available the date the listing all of that stuff and let's look at the date in here uh and we obviously don't want it like this we want it to be more uh more of a time series and we're going to be doing that based off of the price for the calendar so let's go see if we can find that really quick okay here's the price where is that calendar one let me
see okay there's the calendar oh here all right totally forgot where that was supposed to be oh that looks terrible okay um let's see let's let's start working on this because this needs some work obviously uh this is the worst visualization i have ever seen um so we need to work on this a little bit what we need to do is we need to change whoops we need to change some the way that these dates are are seen so right here is a these are two separate things so if i go right here and i
do by quarter it's just going to change the quarters here right that's that isn't really helpful we actually want to keep the year here what we want to do it is by year we want to separate it by year but we want to separate it let's just do let's try we can see what it looks like okay this is great this is this is what we're looking at again um if we went back and changed this like quarter it changed a quarter and then change it to week it would show the quarters but it wouldn't
show everything right this isn't all the data that we need and so you know you really need to make sure that you're doing this correct i it's by default it's almost always year but if you're looking at it via quarter so like let's say somebody comes in you say hey what quarters i want to break these out by quarters and not year over year that's how you would do this but in the year we want to break it out by the week and you see this huge drop off um at the end well that is
actually because the data doesn't go past that um there's just like one day of data or one one um week of data in here with actual um with january of 2017 data so it just drops off because this is a sum so it only adds up to like um 591 000 compared to like the 2 million so we want to get rid of that um and how do we do that uh let's see i think it's filter how's the format no it's not format what am i thinking bear with me uh let's see a filter
well i was looking for it i just couldn't find it let's bring it back to the 31st let's see if that fixes what we need perfect that's all you had to do um and the reason that this is helpful and oftentimes you'd have several years worth of data in here um and then you could have you could do even do something like this like this one where it has multiple lines the reason that this is helpful is because if i'm telling my friend let's i mean just i'm going to say it's a friend or business
partner or whatever whatever you want to use this use case for i'm going to tell him hey the beginning of january all the way until like you know even february it's like really low it's half so there's not a lot of people traveling because everyone travels when at the end of the year so in november december for the holidays to visit family and then in the summer for vacations i would tell him just based off this one thing i would say hey over the summer and then at the end of the year and during the
holidays that's when i would be renting out your airbnb okay so just this one very simple visualization can help him understand the best times to do that that may be an intuitive you may have already known that but you can prove it with the data which is always really helpful and let's see is there anything else that we need to do with this uh i'm just going to label it and i'm going to say revenue for year choose do bold to apply there we go did i label this last one i didn't let's label that
last one and we'll do price per zip code price for zip code we'll just keep it at that let's keep it simple um and let's do that all right i believe we have two more so we have done um we've done three of them um we got the zip codes we've got the um you know the time of the year now something else that he was wanting to know is you know just how things affect it and something that's going to affect the price of the actual airbnb is going to be the amount of bedrooms
so this the larger the house the more bedrooms the more it's going to cost typically so we can take a look at that let's pull in these bedrooms and that will be our columns uh no won't what we need to do um and so i knew it was going to happen i just forgot it until right until right now what we this right now is actually a um it's a value right so it's a number and that's totally um reasonable because if we go right here we do count distinct that's because there's only seven values
right it goes there's zero bedrooms one two three four five six seven all the way up to seven bedrooms right now it has it as a numerical value we want to um change that to create it as um these measure names not a value so we're going to we're going to remove this we're going to go right down here and click this drop down and we're going to say convert to dimension and so now we're going to add it as a dimension so there that looks um much more normal i really quick i'm gonna i'm
gonna keep these in here for a second but we're gonna get rid of these nulls and zeros because if a home has zero bedrooms that's a problem um and so we wanna look at the price again let's go down here in the listings it should be the price now this is the price for the location per day if you want to look at monthly or you know stuff like that they have that data but we're just going to do the price the average price not the sum um although this is helpful so just really quick
before we change it this is going to show you which ones make them which ones are bringing in the most money it also may show you which ones are the most common um those are all different visualizations that we can do but the one that brings in the most money that brought in 63 or that has 63 million dollars worth of worth of listings so they all add up those one bedrooms are doing phenomenal half of that or two bedrooms at 30 million three bedrooms at 18 million and so on and so forth so there's
a ton of one one-bedroom ones we may even keep we could even keep that in there um you know if we wanted to and then we'd do something similar later but you can keep something like this in there what we will do really quick though is we're gonna do the same thing that we've been doing is keeping average um and we're going to get rid of this because if it doesn't have the bedrooms you know that's not helpful to us and they've had zero bedrooms that's that's genuinely a problem i will not be renting an
airbnb with my family uh that has zero bedrooms in it so now we have this and it would be really helpful to be able to see that in the visualization i mean it's just kind of hard to see it as is i mean it just does not hurt to add that right here do a label um why is it angled like that maybe i just need to move it out more that looks much better um that's the average price that cannot be right that's the sum that's why so let's go over here let's make that
average as well much better because uh if the price was three million dollars for a three bedroom i would not be going there so this is really really useful information for our friend right if he wants to you know get into those more that one bedroom area you know you're not gonna be making a lot of money it may be low cost up front but he's not gonna be making a lot of money it significantly goes up when you reach these five and six bedroom homes which makes sense i mean if it has five or
six bedrooms in it it's probably a really large really nice home and you can charge a lot more money and our friend is uh extremely wealthy he can buy whatever he wants and so he may be looking at these um larger ones seeing that there's a much higher return um on his investment the higher the more bedrooms he goes so we're going to keep it just as it is um and let me see if there's anything else that we want to do with this no we're going to keep it just like this and the last
one is by far the easiest and we actually just discussed it a little bit we want to know you know what's his competition look like so um for those for the bedrooms specifically so let's go back up to the bedrooms we want that one to be right here in our rows so we show these and then we just want a count of um how many listings there are so we can do that via the listings id so here's our listings each id represents one location or one home so we're gonna do that right here that
looks absolutely terrible that looks terrible what am i doing wrong here oh let me see one thing we need to do is we want to get rid of these nulls and zeros do that really quick um and then we don't want to do just the id because i i'm realizing now uh what i'm doing i need to convert this to a numeric so we can do a count on it so let's um oops let me see what is happening this is terrible all right let's put this back let's make let me see if i can
just um do an attribute let's do the count [Music] now let's do text um no it needs to be a distinct account because that's that's basically like um account of the numbers themselves not each individual id okay it took some figuring out i'm going to keep that in there because you guys need to see uh a lot of you guys like seeing when i make mistakes so you know it makes it feel like when you make mistakes it's okay i'm all about that so i'm leaving that in there you guys can see me fail a
little bit um i just forgot how to do that for a second and this is exactly what we're looking for right we want we now it showed us in that visualization that we were looking at earlier before we switched it to the average price this is showing us that there are for one bedrooms there's 1800 one bedroom two that and eighty three three they have 206 four that 55 only five that have 20 and six that have five so the more you go up the less and less it is or the less and less competition
there's going to be now is there a lot of demand for four bedroom five bedroom six bedroom uh that's for our friend to figure out um well maybe we'll help them out with that later um in the with the data you know we could look at the reviews that we had um there's so much data in here and we could absolutely figure that out but for what it's worth we're giving him this initial stuff and he'll have follow-up questions for us later that's how it always works i promise um so now we're good with this
one let's label this one did i leave the last one i will go back and look um distinct i i'm gonna butcher this one i'm gonna do a distinct count of of bedroom listings i don't that may not make sense at all but we're keeping it so we're gonna do bedroom apply okay let me see if i added the label on this one i didn't let me do that real quick i'll do average price per bedroom again i'm oops you didn't see that i'm just going with whatever is coming to my head this probably wouldn't
be what i would keep if i had this or like an actual project but it works for now so we have our five visualizations one two three four and five and let's create our dashboard that's gonna be this button right here so we're gonna click that we are going to uh go right here i'm going to say automatic because we want to use this entire area and so now we're just going to start um you know pulling them over and i'm just going to start from the very first one and go to the very last
one keep it really simple so this very first one we'll pull it over it you know it's going to take up the entire space until you start adding all the other ones we'll include this one right here and well let's leave it as it is you know we'll adjust it once it gets to its final place now we have number three we'll add this one on this side it looks terrible right now but give it a second and then we have number four we're gonna add that across the top okay it's already starting to look
a little better and maybe i you don't have to keep this in here um [Music] but you definitely can let's start to adjust things a little bit to do oops okay let's see if i can zoom in one more no i'm gonna do it just like that actually let me see [Music] if i can make it even just a little bit closer perfect that's the best you're going to get if you didn't see i use this magnifying and then i could click on the area that i wanted to see so we're going to keep that
just like that we're going to move this over because that is definitely not as important and then we're going to move this way over as well so keep it just like that again this is something where if you want to you can click on this um it didn't i don't know why uh i can't remember how to get this connected but you definitely can um but oh okay i was just clicking on the wrong one that's why that is why but you can click over here and you you know it'll filter um based on so
if i go to this one oops dang [Music] oh geez what am i doing oh this is a travesty okay let's try to get this back all right i'm not touching it guys you get the gist you can mess around with it yourself i'm not messing this up okay so the next thing we need to add is the very last one that's gonna go right up here and then we're just gonna kind of move it off to the side [Music] and let's see i'm gonna add [Music] yeah of this caption um if you've never seen
something like this before um and i actually want to make this bigger as well oh geez give me a second it's it's kind of lagging a little bit [Music] and make this a little bit man maybe i don't want as wide but i definitely want a little taller [Music] give it a second yeah let me scooch this back [Music] just like that that's fine we can keep it like that in my original one i didn't have this um you can get rid of this if you want you know you can um you know just exit
out right here if you want to do that but there you have it this is the entire thing so we started from the very start um we started with this one then this one uh did some um and this is you know all the all of our zip code work then we took a look at the calendar where we looked at the price and did some time series visualization and then we're looking at the bedrooms and and the count of bedrooms and so this should be really helpful for a friend it should be an initial
dashboard to get him going and once he sees this he's going to have a million other questions and he's going to want another dashboard for different data that's in there he's going to ask about okay well what if i want to do it weekly or you know i want to rent it out for the month or you know how many reviews are people five-star reviews are people giving on you know one bedroom two-bedroom three-bedroom these are all things that you know he may ask and then we'd have to build out in the real world this
is what happens all the time you know they make a request and then they're like oh this is great but i also want this so um you know your friend is is going to be right in line with just about everyone else that has ever gotten a dashboard for work or for personal use with that being said this is it we have done the entire thing now if you want to share this it is super super easy to share and i'm going to try to remember how to share it so we're going to do save
to tableau public as and we're going to do this and we're going gonna make it um let's do air bnb is it like is it a capital b is it like that no that doesn't look great airbnb uh we'll do full project and we'll save and that is being created right now um and i will save this so if you guys want to go look at this you can um and i'll provide a link in the description as well for that and see if yours looks um similar to mine or better than mine give it
a second because it's thinking all right so here it is so here's our final our final project i mean if you followed step by step then you should get this exact or very very similar to this one again i encourage you to if you want to have the up-to-date data to go to that link in the description that has the the most recent data and they update that i believe monthly so you can go there get the most recent data and then you can do stuff and you can create a beautiful project just like this
but with the you know the most recent data again i use the kaggle data just so you guys can remember and i encourage you to look at the different data points that are in the excel there is so much in there and you can use honestly like there's probably 30 or 40 other fields that you could be using in there that we never even touched but for this project we're keeping it pretty simple and so go do that make completely unique dashboards and visualizations and create projects and add it to your portfolios so you can
create a fantastic portfolio website and get a job and that's what this is all about um it's about upskilling and and getting these skills that you can you know get a job or do better in your job so i hope this has been helpful i really appreciate you guys joining me in and doing this entire project with me i have no idea how long this is probably this could be like an hour for all i know so thank you so much for sticking with me this entire time if you like this video be sure to
like and subscribe below and i will see you in the next video [Music] you
Related Videos

12:50
How to Install Power BI | Building First V...
Alex The Analyst
640,436 views

1:30:10
Learn Tableau in Under 2 hours | Dashboard...
Alex The Analyst
24,970 views

17:04
How to Install Tableau and Create First Vi...
Alex The Analyst
790,194 views

15:40
How I Would Become a Data Analyst In 2025 ...
Avery Smith | Data Analyst
104,237 views

3:44:08
Tableau Desktop Crash Course | Learn Table...
Tableau Tim
233,429 views

14:29
How to use Joins in Tableau | Tableau Tuto...
Alex The Analyst
153,874 views

2:05:18
Learn Power BI in Under 3 Hours | Formatti...
Alex The Analyst
57,320 views

21:04
Cleaning Data in Excel | Excel Tutorials f...
Alex The Analyst
607,684 views

3:23:34
Power Apps Model Driven Apps FULL COURSE f...
Lisa Crosbie
562,965 views

2:04:40
2 Hour Data Analyst Interview Masterclass ...
Alex The Analyst
83,995 views

40:50
Full Project in Excel | Excel Tutorials fo...
Alex The Analyst
908,644 views

12:54
Tableau Tutorial for Beginners | Create Yo...
Andy Kriebel
47,992 views

17:11
🚨 YOU'RE VISUALIZING YOUR DATA WRONG. And...
Adam Finer - Learn BI Online
276,260 views
27:35
Tableau Basics for Beginners - Updated 202...
Penguin Analytics
22,791 views

37:28
📊 How to use Power BI DAX - Tutorial
Kevin Stratvert
1,214,988 views

2:32:01
Learn Python in Under 3 Hours | Variables,...
Alex The Analyst
29,134 views
![Data Modeling for Power BI [Full Course] 📊](https://img.youtube.com/vi/MrLnibFTtbA/mqdefault.jpg)
2:34:41
Data Modeling for Power BI [Full Course] 📊
Pragmatic Works
3,427,384 views

33:54
Formulas in Excel | Excel Tutorials for Be...
Alex The Analyst
419,580 views

16:11
Learn Tableau in 15 minutes and create you...
Chandoo
405,029 views