This Indicator PREDICTS Market Bottoms with 99% Accuracy
142.46k views1872 WordsCopy TextShare
Data Trader
📥Custom Stochastic settings: https://t.me/datatraderyoutube
👉Join my FREE Telegram (Trade Signals...
Video Transcript:
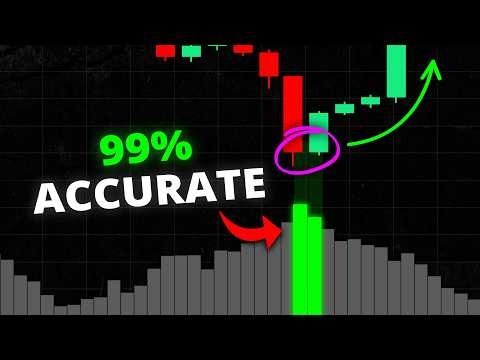
this indicator could show the exact bottom of every dip with Incredible accuracy best part it's completely free to use let's see how it works here on the Bitcoin chart the price is seen dipping then the indicator flashes green signaling that this is likely the bottom and that the price will start to reverse if we let the chart play out what happens the price reverses upwards as signaled by the indicator if we had taken a buy position here that trade would have been very profitable let's look at another example here we're looking at Tesla stock and
again the price dips and the indicator flashes green signaling that this is likely the bottom what happens next the price reverses upwards as signaled by the indicator now I know what you're thinking this looks too good to be true right but trust me there's a reason it works and in this video I'll reveal exactly what this indicator is not only that I'll also reveal how you can use it to time the bottom on any asset with high accuracy let's Dive Right In this video is about an indicator called the Williams vix fix created and published
on trading view by a user named Chris Moody to add this indicator to your chart head over to trading view the platform I'm using for this tutorial then load any trading instrument of your choice in this example we're looking at the ethereum chart next select a time frame based on my experience this indicator works best on higher time frames like the 4H hour or daily chart for this example I'll be using the 4H hour time frame finally click on the indicators Tab and type in cm Williams vix fix fimes Market bottoms and select this one
created by Chris Moody once it's applied you can also choose to customize the settings but I found that the default settings work best anyway so just leave it as they are so what exactly is this indicator and how does it work in short the vix fix is an indicator designed to identify potential Market bottoms by analyzing volatility in the market it works on any asset whether it's stocks crypto or Forex looking at it it's pretty straightforward the bars on the indicator measures the volatility of each period longer bars means higher volatility while shorter bars means
lower volatility the concept behind this indicator is simple it suggests that markets tend to bottom out when volatility is at its highest so when the indicator detects that volatility looks overextended it flashes green signaling that the area could be a potential bottom and that the price could bounce upwards now even though it's a really good indicator you shouldn't take trades based on the signals alone as there are a couple of problems when used on its own first problem is if you look closely you'll notice that while the indicator succeeds in finding Market Bottoms in some
setups there are also times where it shows false signals but don't worry I'll show you how to fix this in just a minute second problem is when you're trading it live you you might notice the indicator has a tendency to display multiple green flashes signaling that the market is bottoming eventually the price does bounce but how are we supposed to know exactly when to buy if the indicator displays multiple flashes to solve these problems you have to combine the vix fix with another indicator here's how go to the indicators tab again and type in stochastic
click it and apply it to your chart once it's applied you'll notice that the default settings for the stochastic can look cluttered and messy that's why I actually have my own custom settings which makes it look much cleaner like this and in my experience the custom settings give more accurate signals compared to the default one so if you'd like to know the exact custom settings I use for the stochastic I revealed them inside my free telegram Community which I've Linked In the description once you've joined just type stochastic settings into the search bar and you'll
find it there however if you insist on sticking with the default settings that's completely fine too but for the examples in this video I'll be using my custom settings so here's how you can combine both indicators to create a high- win rate strategy first we want to wait for the vix fix to show a green signal like a Miss example next look at the stochastic oscillator and make sure that the Blue Line crosses into the oversold levels which is marked by this line here now for your entry point wait for the blue stochastic line to
cross above the Orange Line like this but make sure the candle has closed when the crossover happens once both signals align you can enter a buy position for your stop loss place it slightly below the last swing low set your takeprofit at two times your stop loss as you can see the price bounced and hit our profit Target let's look at another example here we see the price moving down and the indicator gives the first green signal however the stochastic isn't in the oversold Zone yet meaning no entry so we wait after a couple more
green flashes the blue line of the stochastic finally hits oversold and Crosses above the Orange Line confirming our entry we can take a buy position place the stop loss near this swing low and set the takeprofit at two times the stop loss as you can see this is another profitable trade now keep in mind that this indicator specifically Works only for Market bottoms but that doesn't mean it's limited to finding reversals you can also use it for Trend continuations as well for example here we can see the price was in an uptrend before forming a
minor pullback looking at the vix fix it flashes green and the blue stochastic line is in the oversold Zone shortly after the Orange Line crosses above the Blue Line confirming a possible bounce at this point and right after that happens price bounced back upwards continuing the trend so as long as you spot a downwards movement whether it's a pure downtrend or just a pullback in an uptrend the strategy is still effective now you might be asking yourself what if we want to detect Market tops instead of bottoms well there's actually a way to do that
too remember I mentioned that market bottoms usually happen during High volatility periods to find market tops it's actually the opposite a sign of a market top is when price goes up but volatility or fear is low the problem is the vix fix indicator doesn't show signals during low volatility periods however there's another indicator that could do that go to the indicator section and type in cm Williams vix fix find market tops and bottoms then select this one by Aaron Stone this indicator is a modified version of the vix fix it's designed to help you find
both Market tops and bottoms for this indicator the default colors are a bit different a green signal shows possible Market tops while a red signal shows possible Market bottoms if you compare it with the original vix fix you'll notice that the signals for Market bottoms match exactly now if the default colors seem confusing you can easily change them through the indicator settings to use this indicator for finding Market tops the process is pretty much the same as finding bottoms first you'll want to apply the stochastic alongside the indicator and because we're finding Market tops you'll
want to look for an uptrend then wait for the indicator to display a green signal which identifies a potential Market top next check the stochastic and make sure the Blue Line crosses above the overbought line which is this line up here and then wait for it to cross below the Orange Line This confirms your entry once you've got the confirmation you can place a short trade here set your stop loss slightly above the swing high of your entry and aim for a takeprofit at twice the size of your stop loss after that price begin to
reverse and hits our profit Target now here's the thing from my experience with this indicator the signals for Market bottoms tend to work much better than the ones for Market tops because of this I usually stick to the original version of the vix fix which focuses on Market bottoms only another thing I really like about this indicator is that you don't have to use it as a standalone strategy you can also combine it with your own strategies to further validate your entries for example one method I like to use is combining it with key levels
such as order blocks let me walk you through how to do that first go to the indicator section and type in order blocks detector select the one by Lux algo as you can see the indicator automatically detects the nearest order blocks which are essentially areas where the price might potentially Bounce from so here's how we combine the order block detector with the vix fix first start by identifying a setup where the price retraces into an order block as shown in this example next wait for the vix fix indicator to display a green signal which shows
a potential bottom after that check if the stochastic is in the oversold Zone and ensure that the blue stochastic line crosses above the orange line if all signals are aligned you can enter a buy position next set your stop loss at the middle line of the order block and aim for a takeprofit that's twice the size of your stop loss or you can Target another order block above as you can see this setup results in a nice profit so the CM Williams vix fix is a really powerful tool that can help you detect Market bottoms
during a down tread and if you combine it with another tool such as the stochastic it can be a really effective strategy now if you want to know the custom settings I used for the stochastic you can see it inside my free telegram Community once you join just search for stochastic settings and you'll find it there inside I also share trade signal to the members for example in one trade I told the members to buy a coin called Fetch and just one week later it shot up 25% so if you want to see more trade
signals like this including the stochastic settings I used in the video you can join my free telegram Community Link in the description below it's completely free to join and I share tons of value there if you found this video helpful don't forget to like And subscribe it only takes 2 seconds but it helps the channel out of time thanks for watching and I'll see you in the next one
Related Videos

29:01
Technical Analysis is Hard (Until you see ...
SMB Capital
954,618 views

55:11
Master This ONE Candlestick Pattern TODAY ...
Ross Cameron - Warrior Trading
1,322,727 views

19:22
Order Blocks Explained: 3 Best Strategies ...
Data Trader
293,713 views
9:57
This Oscillator Shows Up To 99% Trend Reve...
PineTrades
107,413 views

48:15
Reading Candlestick Charts Was HARD Until ...
Ross Cameron - Warrior Trading
1,294,412 views
12:38
This Candlestick Pattern Will Change The W...
Data Trader
96,887 views

39:19
Support And Resistance Didn't Work Till I ...
Rayner Teo
2,082,346 views
8:51
Zero Lag MACD🆚Standard MACD – Which One I...
AlgoTrade Pro
18,074 views
20:00
🔴 STRENGTH INDEX Trading (Say BYE-BYE to ...
Trader DNA
234,070 views

16:55
🔴 The MOTHER of All Indicators (Dangerous...
Trader DNA
324,281 views

13:15
TOP 4 Trading Strategies to Make $500/Day ...
Data Trader
488,952 views
55:18
How to Read Candlestick Charts (with ZERO ...
Ross Cameron - Warrior Trading
3,164,593 views
18:00
The ONLY Candlestick Patterns You Need To ...
Trade Prime
2,634,799 views

9:28
This Oscillator Tells You Exactly Where To...
PineTrades
149,392 views

21:49
Convert TradingView Indicators into Strate...
Michael Automates
1,026,371 views

8:39
20 EMA High & Low Trading Strategy – Live ...
GeekOnDaily
82,975 views

27:05
MACD Indicator Explained: 4 Advanced Strat...
Trade Prime
1,800,013 views

22:59
The BEST Candlestick Pattern Guide You'll ...
Data Trader
771,692 views

54:56
How to Read Candlestick Patterns (Step-by-...
Ross Cameron - Warrior Trading
602,787 views

19:26
My Scalping Strategy is Boring, But Makes ...
Scarface Trades
183,937 views