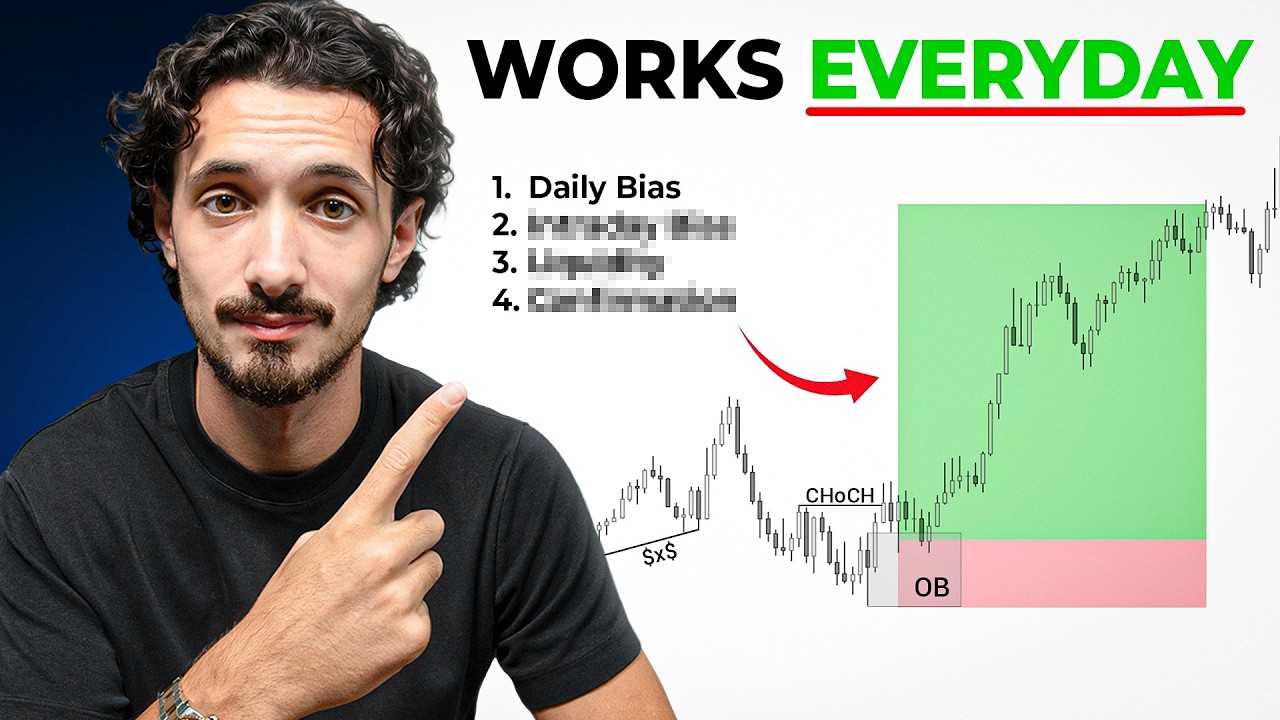
Literally just one candle is all you need to become insanely profitable as a trader. And in this video, I'm going to show you exactly how to understand the one candle rule and how to execute it into a live trading strategy. So, without further ado, let's jump straight in.
Now, what you can see on screen right here is the trade that I'm going to be walking you through. It's the trade that was executed today, and a bunch of the inner circle students also took this exact trade because of this one candle model. Now, the one candle that I'm talking about is the daily candle, and I'm going to show you in this video how you can use the daily bias to consistently generate income from trading.
Now, there are three main things that I want to walk you through in this video. The first one is how to read the previous day's candle to understand what today is likely going to do. The second one is higher time frame magnetism.
[music] And finally, the third one is entries, right? How do you actually enter based off of your daily bias? That's when I'll recap the exact trade that I took today.
So, here I am on the daily time frame and I'm starting from the 13th of October. We're in early December right now. In fact, this trade was executed on the 3rd of December.
And I'm going to literally walk you through every single daily candle to show you how you can predict the next day's candle. And then I'm also going to explain draws on liquidity/ area of interest. This is what's going to give you an edge in understanding where the daily might gravitate towards.
And then finally, when we get to today, I'll show you how I used this daily candle model and how I was able to get into my position and the exact trade that I took. So, starting off plain and simple, predicting the daily candle, you can basically with a very high degree of accuracy understand what the next daily candle is going to look like based off of what the previous day's candle looks like. So, we'll walk through step by step and I'll explain it all.
So, we'll start with where we're at, right? Monday the 13th of October. You can see this is a bearish daily candle and it's honestly very indecisive.
So a candle like this and a day like this doesn't really give us any information. We don't actually know what the next day is going to do. We're kind of in a consolidation phase.
What I will say is that the market is always ranging from consolidation to expansion back into consolidation back into either expansion in the buy side or expansion toward the sell side. So, we know we're going to be gearing up for a direct move. We just need to see the direction of that.
And so, the next daily candle prints like this. Now, very, very important details. Notice, right, that this is a bullish daily candle.
That's the first thing I want you to see here that we open down here. We wick below the low and then we close toward the buy side of this daily candle. Right?
So, we have a bullish daily candle that has wicked below the previous day's low and closed back inside of the range. Already that immediately tells me tomorrow is a bullish day. And on this candle, what we can see is that we open down here.
We have a very bullish aggression and we're closing toward the buy side again above the previous day's high. Closed toward the buy side. It tells me again that tomorrow is going to be a bullish day or at least we are going to get a bullish expansion.
Again, another bullish move. We've broken above that previous day's high and we've closed up in here. Again, that tells me that we're definitely going to be targeting this day's high and you know, we're going to be essentially ending up higher than the previous day's high.
Okay. Now, what we see here is a bearish daily candle, right? But we were expecting higher prices this daily candle right here.
And if I just focus on just this daily candle, and let's say we drop down to a 1 hour time frame, right? Here we are. 1 hour time frame.
In fact, let's go to a 15-minut real quick. So, the day opens here, right? This is where the daily candle opens.
It opens on the and this is the daily candle. So this is the daily close to daily open. So it opens here.
So you see that we actually open first going bullish. So the bias was higher prices. We got those higher prices and then eventually price sells off.
And that's what that daily candle looks like. So if we go back to the daily time frame, what this now tells me is that tomorrow is going to be bearish because we've hit these highs. We've wicked above this high.
So, you're looking for a wick above and a close back inside bearish. That tells me that tomorrow is going to be bearish. But also, what do we have?
Right, this is step number two. Again, it's just reading your draw on liquidity. You can see here that we have this bullish fair value gap.
So, tomorrow then I can already anticipate there's a good chance that we're going to trade bearish and we're going to enter in toward this fair value gap, right? That's what I have in mind. And again, I'm just want to predict the next daily candle.
And again, what do you see? The next daily candle is another bearish candle, right? We've closed below and we've ended up inside this level.
Now, the key here is the power of three, right? Many people, you've probably heard them talk about the power of three. The power of three is essentially a manipulation and distribution, right?
So, you have, you know, a rangebound period like this and then you have a manipulation and then you have a distribution. That's kind of the power of three. And it essentially states that before price will trade lower, it will first trade higher.
You can see that time and time again in this model, right? So you can see here we've broken and closed below this low. But notice that beforehand there's a good chance that we actually come higher and then lower.
What I want to be is I want to be a seller at this level of price. So if we do the same thing again, if we square off this price [snorts] action and we go to yesterday's open and close. So here's the fair value gap down here.
If we remove this for now and we find the open of this day is here 5:00 p p. m. Eastern Standard Time.
Notice that we're expecting bearish price. But before we get the selloff, we get first a bullish move, right? That's the manipulation of the day and then the sell-off.
So I, someone who wants to be a seller, I'm waiting for that manipulation and then I'm looking to sell after that manipulation occurs. It's always the same thing again. We'll always get the pullback and continuation.
That's the same thing, right? All right. It's like before you trade lower, if you have a bearish daily bias, the next day you're expecting, you know, a manipulation before the continuation lower and you want to basically be selling here.
If this is the daily open, first we're going to manipulate toward the buy side, then we're going to sell off toward the sell side. And that is essentially what we're seeing. And so for me now, what I would be looking at for [snorts] the next level is first and foremost, let's also talk about more drawn liquidity.
What do we have here, right? Equal lows down here at these lows. Also, if you look down here, we have this overlapping fair value gap.
Very, very interesting area. An area that I was talking to my students with for a couple of weeks, saying that ultimately we will probably end up trading into this level. Equal lows down here and an overlapping fair value gap.
So, we also have this as a draw on liquidity, right? Or a bias to trade towards. Again, looking at the next daily candle, what do you think is going to happen?
For me, I'm indicating more likely that we're going to get more bearish price action, right? Another bearish continuation. What happens?
We open. We first have a run toward the buy side and then we have the sell-off doing what again? That same pattern, right?
We have our open manipulation and move toward the sell side, right? And now what have we done? Now we've closed over that fair value gap.
So we've inverted that fair value gap, which then also becomes another area of interest for me. So if I was to let's say be a seller now, right? An interesting move could be a retracement into here and then a continuation out of here.
Right? This is how you're building daily bias essentially. Now notice what happens here.
This time we actually have a bullish daily candle. And notice that we've wicked below this low and closed back inside. That to me is typically sign of a reversal.
Right? So what I would now be looking for is now we have this bullish fair value gap in here which is also overlapping. Now, I would be expecting the next day to trade higher above this previous day's high and into this level right here.
Right? Simple as that. That's what I would be looking for.
And what you notice is on this specific day, we actually don't get that. So, we do get the open, we do get the manipulation, and we do start getting the momentum. So, definitely you could have been in a trade at these lows.
And again, if I open up the 15-minut time frame, which is my primary time frame for direction, you'll notice what market opens. We have the bearish manipulation, right? Even look at the structure on the 15-minut time frame.
We were very bearish. Now we've shifted bullish, right? Which is yesterday's manipulation and close above the high and now we're selling off again.
Longs accumulated in this New York session and you're just holding them ready for the next day. We're probably going to end up in this level. So, it's the same thing, right?
Just because we haven't fulfilled the prophecy yet, we've still been able to probably execute long positions in this area. And again, we go back to the daily, right? We've still anticipated bullish price action for that day after the manipulation, right?
So, anytime that I have a bias to go higher, I first want it to go lower before it goes higher. And I want to try to buy in this level. So, this day, what would I be expecting?
A continuation higher above these two highs. And that's what happens, right? We get that move, we open, we pull back, and we continue trading higher.
Now, what we've done is now we've come back into this bearish order block. You can use this level, you can use this candle regardless, and we've had quite an aggressive reaction from it. But notice we have actually closed above the previous day's high.
So what this tells me is there is a lower level of conviction, meaning the next day is a day where it could go higher, but it also could go lower. So you keep those things in mind, but ultimately it's a bullish candle. So you'd be expecting probably a continuation, right?
Which is what we get. We get the open, low, high, close. So again, it's the same thing.
price is trading higher, but before it's trading higher, it's opening, coming down, and then trading higher, and then closing here, right? And so, you're getting the open, low, high, close. That's what that is.
So, again, you're accumulating long positions in these levels based off of just the daily candle. Like, it's literally that simple. So, for this day now, what we can see is we have a bullish candle, but we have wicked above this high and closed back inside of the range.
This tells me that this could be a reversal, but it could also be a continuation. Again, there is a little bit less clarity on the situation. You're not going to get every single day absolutely correct.
That's not the game of trading. The game of trading is probabilities. After you finish this video, it is vitally important that you watch the 45minute master class that I've put below this video.
It's going to help you become a profitable trader so much faster. So, the next day we get that continuation again, right? Higher prices, but notice that the momentum is starting to kind of fade away.
So, again, what do we get? a wick above the high and close back inside. So again, this for me now when you're wicking above this high, closing inside the range, it's usually indication of a reversal, but you could also continue before you reverse.
Right? So a lot of the times when you get these types of candles where they're wick heavy, you'll probably see before a reversal, maybe a sweep of a high. If we look at this level, okay, so the next day we don't get that.
We get a very aggressive sell-off, right? So we close below that previous day's low. We open here.
We manipulate toward the buy side. We have an aggressive selloff. We close below the previous days low.
For me now, the next day is simple. We have equal lows down here. Again, that number two draw in liquidity, that bias.
We have those equal lows as a draw in liquidity. We have these equal lows as a draw in liquidity. So, what am I looking for today?
This is a very obvious day. I'm expecting a pullback and then a sell-off, right? That's the daily bias.
What happens again? We can go into the 15-minut time frame. You can see we open, we put in the high, and then we sell off aggressively, right?
Perfect opportunity, perfect day to be getting into short positions, right? Where does the market open? Market opens here at 5:00 p.
m. What happens? We pull back into this area and then we sell off in London session, we're good to be selling.
New York session, sell continuation, right? Same thing. All based off the previous days candle.
That's it. Just the daily bias, right? So the market, we open, we put in the high, and then we sell off aggressively.
So what do you think I'm expecting today? Well, now we've taken out this drawn liquidity, but we still have this one down here. We've closed below that low, right?
Aggressive close below that low. And now I'm expecting what? A pullback and continuation again.
What happens? Open, pull back, continuation, right? Perfect mitigation of this previous day's low.
What do I'm expecting again? Well, now we've taken the draw in liquidity. We've hit the draw in liquidity, right?
We've also hit into this fair value gap, but we have again closed below that low. And so I am most likely expecting lower prices for this day. And again, what do we get?
We get open, pullback, sell off. So again, this is where you want to be looking at it. Before this day even opens, you're expecting, okay, today I'm going to be bearish.
We're going to have a bullish pullback. I'm going to sell. Go lower.
Next day bearish, bullish, pullback. I'm going to be a seller. Go lower.
Next day bearish, bullish, pullback. I'm a seller. Go lower.
Right on this day. Now, notice that the momentum is starting to get a little bit slower. Now, we're inside of our draw on liquidity.
Now, you can start adding that into the context of slowing down and expect that maybe at some point we'll start to get a reversal, but still for this specific day, my next daily bias would still be bearish. Why? Because we've closed below the previous day's low.
Again, what do we get? Open, pull back, sell off. Again, you're just a seller in this market.
The next day, what am I expecting? Another sell. Now, notice that we do get the sell, right?
So, we do trade below this low, which was the goal of the day. But now, notice what happens. We have a bullish day and we actually have a wick below previous day's low and a close back inside.
This for me is literally a SOS that we are about to reverse. The market is going to now trade bullish. And it's very simple.
Now, you look and you see, okay, well, we actually have number one point of interest that we're trading out of. Secondly, we have a bullish fair value gap here. We have a bullish fair value gap here.
Right? So now we have these higher time frame areas of interest or draws on liquidity that we're expecting price to trade back into. So now what do you think I'm looking for?
Now today I'm expecting to be a buyer. Price is going to pull back in here and then shoot off up here. Pull back in here and shoot up off in here.
Right? So what does the next day do? The next day we open here.
A very small pullback and a very aggressive bullish candle. Well, now what do you think I'm expecting price to do on this next day? Again, I'm expecting that we're going to have another bullish day, right?
A little pullback and continuation. What happens? Market opens, we sell off, and we go higher.
Right? 50-minute time frame. What does that look like?
Again, perfect opportunity to get longs, right? The market opens here. Market opens, we sell off, London opens, right?
There's a perfect entry opportunity here. We traded long on this position. Market booms towards the upside, which is expected.
So, they get the manipulation. You wait for the manipulation. You wait for the confirmation on the lower time frames.
And then you're executing long, right? It's so simple. It literally works every day.
So now what do we have? We've filled all of those levels. Now we have a bearish draw on liquidity, right?
Because now we have this daily Fed value gap. Notice that we have been accurate with a like 95% level of accuracy. Now this day is indecisive.
We don't get a shift higher or we don't get a shift lower. That for me again is quite indecisive. I don't have a read on the next day.
But then what happens? Then we get a bullish candle. Now we've wicked above this high and closed back inside and we haven't closed above any candles.
So that for me is usually a sign of a reversal. But because it's a bullish day, it could still trade higher before the reversal, right? And again, what do we have?
Pretty much an undecided day. But we do have a bullish day and it has closed above this high and above this high. So I would be expecting for price on this day to trade into this old high.
Right? Very simple. And that's what we have.
Open pullback trading to the high. Now we have a very bullish day. I would be expecting what?
You answer this at home. Where do you think I'm expecting price to go? Higher.
Right. Yes. On this day it doesn't happen.
In fact, we failed to take out the high and now we have a bearish candle. So today what I would be expecting is lower prices. We have a fair value gap here, right?
We have a bullish fair value gap here. Bullish fair value gap down here. I'd be expecting lower prices on this day.
What happens? Market opens, pullback, selloff. We've closed below this low.
What do you think I'm expecting that price is going to do today? Same thing again. Bearish open, pull back, sell off.
Perfectly into that old low. We close below. What do you think I'm expecting?
Another bearish day, right? Pull back, sell off. Very aggressive.
Where into that draw on liquidity. Okay, fine. Another bearish day.
Where do you think I'm expecting price to go? Lower again. Perfect.
But then what happens now? We do get lower prices. We could have been a seller, but now we have a clear reversal indication.
We're coming from a point of interest. We've wicked below the low and we've clearly closed well above that previous day's low. Now, I'm expecting a reversal.
I'm expecting a bullish candle. What else do we have? We have bullish daily fair value gap.
In this scenario, we get both, right? And that can happen. We get the run higher and we get the run lower.
But for me again, even still a wick below the low and a close back inside, that's probably more indication of a bullish day for the next day. And we do have that bullish day next day. Now notice you go from expansion a little bit rangebound.
So on this type of day, I don't have a clear definite read on price. I'm just not sure. But what I do see here is we have created a swing low, right?
We have one low, two lows, and a swing here. So this could be a protected low for now. And it is, right?
Market opens, pull back, aggressive bullish shift. What do you think I'm expecting? Another bullish day, right?
Open, pull back, higher prices. What do you think I'm expecting? Another bullish day.
We do get the bullish day, right? Please understand, we do break this high, but now what happens now? We've wicked above this high and closed back inside of this range.
Tomorrow, I am expecting a bearish day. So, we do get the bearish day, right? Price does sell off.
This is the key thing. Just because it closed bullish, it sells off. But now it's sold off.
It's wicked that low and closed bullish. Where do you think tomorrow is going to go? Tomorrow is probably going to be bullish and I'm expecting this high and this high to get taken out.
Again, perfect example. We pull back, right? And this is Monday, the 1st of December now.
So, we've wicked, it's a bullish candle, but we've wicked above the high. I would be expecting a reversal. Now, you come into not into today into the next day, right?
Which is yesterday. So, yesterday you can see that we had a bullish candle. So, we've closed above these highs.
What do we also have? We have buy side liquidity. We have equal highs at this high.
We have this old high, right? So, what do you think I'm expecting coming into today? Like, as of recording this today, what do you think I'm expecting?
I'm expecting price to take out this high. So, now, how did I trade this day? Let's take a look.
This is price action right now. This is where we are. When I come into my London session for the day, my read on price for the day is bullish.
Notice guys, we have literally just gone through over a month's worth of price action, six weeks of price action just using the understanding of the previous day's candle and we have been accurate 95% of the time. Like what I'm sharing isn't a joke. In today's price action, I'm expecting higher prices.
So again, let's go back into London session where price opens up. This is what price looks like. This is the current daily candle.
So we've opened here. We've opened and we're already trading bullish, which is what I'm expecting. But we haven't yet hit this old high right up in here.
And we also haven't yet hit these old highs which we just looked at on the daily time frame. And we know that that's going to be our target. So now what I need is step number three which is how do you actually become a buyer on these days?
Well, what you do is you wait for a pullback. So you can enter into let's say the one minute time frame right inside of your session or the 5minut time frame sorry inside of your session and you wait for a pullback right a manipulation internally and then a confirmation. So you can see we move toward higher.
We still haven't taken out those highs yet, right? We still these highs are still intact. That's equal highs.
I'm first waiting for a manipulation before I trade long. That manipulation can look like that. Right here it is.
We're still expecting higher prices, right? The daily drawn liquidity is still higher. We've manipulated internal prices like this.
And now notice we've gone from very bearish to kind of just sitting in this price range. We're just waiting for that confirmation. Waiting for price to tell us that we can go higher.
That's bearish candle. Okay, that could be a reversal. Okay, that's a manipulation.
Boom. That's a bullish candle. So now in here, you can see that we're already getting the reversal, right?
We were bearish and now we've shifted bullish. So now I believe that the rest of the day can then continue going bullish. And if we go to the one minute time frame, you will see that price was bearish.
Right? And now it's bullish. So now I've got my confirmation.
The order flow is shifted. Now I can expect the rest of this day to be a bullish day. Right?
It's that simple. And where's my entry? Usually I'm executing entries on the 5minut time frame.
I'm looking at order blocks, fair value gaps, whatever makes sense. Right? My entries are going to be in here on this bearish order block uh bullish order block.
Sorry. My stop loss going to be below the low. Right?
I can use this inverted candle here. Whatever makes sense. And then I'm just targeting a one to5 risk-to-reward.
Let's say I have, you know, 400K in one prop firm. I'm risking $4,000 on this one trade. I'm risking $4,000 to make $20,000, right?
That's the play of this. That's why you sometimes see me having these 30k 40k days. So, we get tagged into the trade.
And now I'm just expecting the momentum of the day, right? The day bias is just going to take me to my take profit. And that's it.
That's why I wanted to record this video live in this moment. I don't think I think this is some of the most valuable things I've given out on YouTube. That is how we execute those trades.