YTScribe
Related Videos
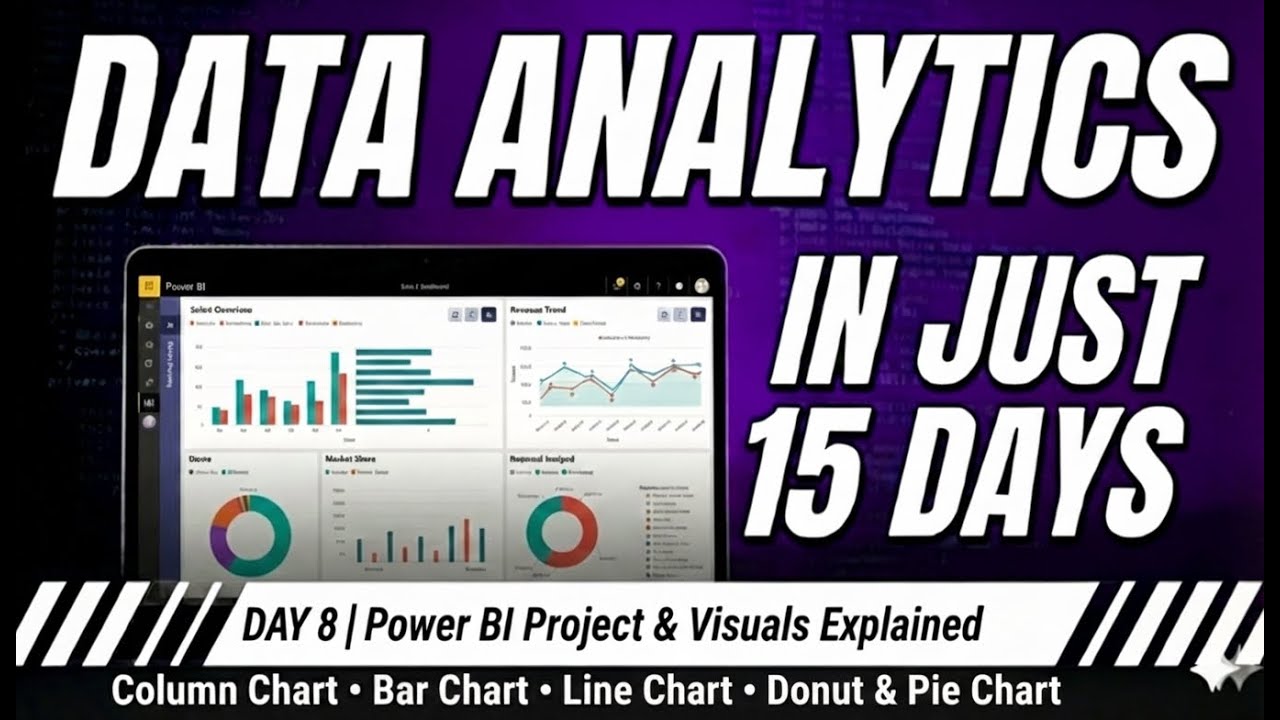
"Day 8 | Power BI Visuals Explained | Column, Bar, Line, Pie & Donut Charts" - Transcript | YTScribe | YTScribe
Day 8 | Power BI Visuals Explained | Column, Bar, Line, Pie & Donut Charts
Checking authentication...