This Trend Indicator Also Shows EXACT Support & Resistance Levels
121.55k views1550 WordsCopy TextShare
PineTrades
Looking for a trend indicator that does more than just show market trends? The Kalman Trend Levels I...
Video Transcript:
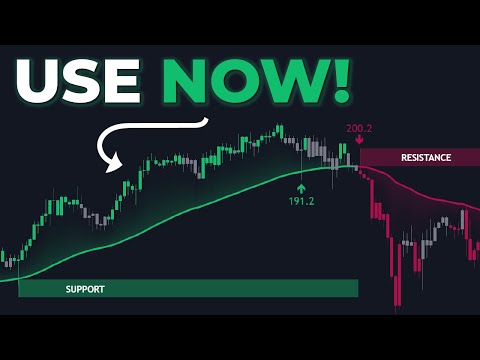
this is a bullish Trend as identified by this indicator and as you can see the price went up now down here the same indicator printed a clean support level which the price cleanly bounced off of if we were to take a long position here well it would have been a profitable trade most Trend indicators just show you the trend of the market but not this one this one goes the extra mile to show you the exact support and resistance level and it even prints labels when these levels are retested by the price helping you to
easily craft a strategy out of it in this video I'm going to show you exactly what this indicator is let's get into it now to get started with this indicator you first of all want to go to trading view the trading platform that I'm going to be using if you need to sign up there's going to be a link in the video description for you to do that after that you want to open any trading asset that you like for me I'm going to be using the 1H hour time frame of jbp J py next
you want to click on indicators and type in Colon Trend levels and it's going to pit this one by big Beluga so what exactly is this indicator anyway well the colum and Trend levels indicator is a technical analysis tool for Trend following and market analysis it integrates the principles of c and filtering to detect Trend shifts highlight support and resistance levels and visualize momentum changes Cal and filtering in the context of this indicator it's utilized as a method to smooth out and analyze price data effectively filtering out Market noise to highlight meaningful Trends and support
and resistance levels now let's go over what this indicator is made of first of all we have the trend levels which are these green and red Trend clouds they're actually made up of two lines known as Colman filters specifically a fast Colman filter and a slow Colman filter the fast Colman filter this one at the top adapts more closely to price while the slow Coleman filter this one at the bottom is less reactive to price changes together they form the green and red Trend levels which are useful when identifying the trends of the market a
green Trend level indicates a bullish trend on the other hand a red Trend level indicates a bearish trend next we have crossover boxes these green and red boxes they are printed whenever crossovers occur between the Fast and the slow C and filters a green crossover box appears when the fast Colman filter crosses above the slow Colman filter signaling a potential support level we also have retest signals for these we have to activate them in the indicator settings but as you can see there are these plus and X labels that indicate areas where the price retests
these support and resistance levels additionally we have these up and down arrows that indicate Trend shifts a green upward area is going to be printed whenever the trend of the market Market shifts from bearish to bullish this number is just the price point where the exact crossover happened on the other hand a red downward arrow is going to be printed whenever the trend shifts from bearish to bullish now that we know exactly what this indicator is made of the next question is but how can we use it to trade well it's really simple I first
of all want to say this the settings I'm going to be using for these strategies are the default settings you just want to make sure to double click on the indicator and enable the retest signals after that click okay now we have two strategies that are possible with this indicator the first one is pullbacks the second one is retests of support and resistance levels let's start with the very first one now to take a long trade based on this pullback strategy the first condition is to confirm that the trend of the market is bullish that
is going to be indicated by a green Trend level like this with the price hitting upwards condition number two is to identify the pullback now a pullback is going to be identified by this indicator like this the price comes back down to the point where some of the candles open and close under the fast colan filter this line at the top but at the same time no candles should open and close under the slow colum filter this line at the bottom so whenever you have something like this well that is a pullback and the indicator
is going to turn these candles to gray now once we have the pullback we need to confirm the end of it that is going to happen when the candles turn back to green we take a long position here the stop loss goes under the most recent swing low targeting 1.5 times the risk letting the trade run and it was profitable and of course for a short position it's going to be the opposite you identify a bearish trend which is going to be indicated by having a red trend level like this and then for the pullback
you want to have the price coming all the way back up and then opening and closing above the fast colum filter this line as soon as that happens provided it doesn't open and close above the upper line then you have yourself a pullback and these pullback candles are going to be colored gray now to confirm the end of the pullback we need the price to go down and have the candles turning back to Red that happened here we take a short position stop loss of above the most recent swing High take profit is going to
be set at 1.5 times the risk letting the trade run and it was [Music] profitable now that's just one of the simplest ways of trading with this indicator and of course you have to add other necessary confluences like Market structure price action smart money Concepts or whatever else that you use including your own discretionary judgment to find profitability now the second method of trading with this indicator which has extra confluences is trading based on retests to these support and resistance levels let me show you to take a long trade the first condition ensure the trend
of the market is bullish like this condition number two you want to have the price do a pullback into the trend level like this at the same time during this pullback the price should also retest a support level now to retest a support level the price just needs to either touch it with a wick or it can also close inside of the level but it should not close under it if it closes under the level the entry will become invalid because that support level would be considered broken hence invalidated so right here we can see
that it touched the level with a wick which means it's a valid retest as well as a valid pullback next to confirm our entry we need a green candle to be printed this is our entry we enter our l position stop loss at the bottom of the retest candle the take profit is going to be set at 1.5 times the risk letting the trade run and it was profitable and of course for short position it's going to be the opposite you identify a bearish trend like this and then you want to have a resistance level
which is a red box like this the price now needs to do a pullback into the trend level like this with the candles changing color to to gray at the same time during this pullback it should either touch the resistance level with the wick or it can even close inside the level but it shouldn't close above it now after the retest of the resistance level we need to confirm signs of bearish continuation which means we need at least one red candle to be printed this indicates our entry we take a short position here put the
stop loss above the retest candle the take profit is going to be set at 1.5 times the risk letting the trade run and as you can see the trade was profitable the strategies showcased in this video are not complete strategies because they're only made up of indicators with no price action Market structure or smart money Concepts or no any discretionary judgment which usually form the Bedrock of any profitable strategy because of that they may not be profitable in other trading periods or time periods so do your own extensive back testing and figure out what other
confluences you can add to make them complete strategies increasing the chances of profitability well that's been it for this video I really hope you found some value if you did remember to leave a like or even consider subscribing to stay tuned thanks for watching see you next time
Related Videos
11:54
1 Indicator, 3 Strategies! THIS tool is 3X...
PineTrades
26,124 views

13:41
Liquidity Sweep Filter: The Most Powerful ...
PineTrades
3,257 views
10:13
Kalman Trend Levels Indicator: The Secret ...
FxDailyReport.Com
12,349 views
12:21
This 1 Indicator Identifies Both Momentum,...
PineTrades
82,040 views

21:58
How I Nailed Trading with the MACD Indicat...
Ross Cameron - Warrior Trading
658,206 views

10:32
This Indicator PREDICTS Market Bottoms wit...
Data Trader
139,959 views
20:00
🔴 STRENGTH INDEX Trading (Say BYE-BYE to ...
Trader DNA
231,998 views
11:17
Premium Indicator, Now FREE! 99% Accurate ...
PineTrades
284,362 views

39:19
Support And Resistance Didn't Work Till I ...
Rayner Teo
2,081,395 views
12:42
1 Indicator, 3 Uses! Most Powerful Trading...
PineTrades
557,189 views

8:19
Buy Low, Sell High! This Indicator Shows M...
PineTrades
79,307 views

16:40
Stop Losing Money with WRONG TradingView S...
Michael Automates
83,692 views

16:55
🔴 The MOTHER of All Indicators (Dangerous...
Trader DNA
322,929 views
9:57
This Oscillator Shows Up To 99% Trend Reve...
PineTrades
105,706 views
33:21
This NEW Indicator in Tradingview Will Cha...
Indrazith Shantharaj
38,842 views

21:49
Convert TradingView Indicators into Strate...
Michael Automates
1,023,251 views

9:28
This Oscillator Tells You Exactly Where To...
PineTrades
147,420 views
16:20
The 5 Best Price Action Indicators To Spot...
Switch Stats
328,094 views

8:48
The Only Indicator You’ll Ever Need
TradingLab
401,618 views
10:42
ZigZag3 Indicator by Invincible3: The Ulti...
FxDailyReport.Com
27,907 views