The ONLY Candlestick Pattern Guide You'll EVER NEED
3.45M views2204 WordsCopy TextShare
TradingLab
Learning candlestick patterns can be absolutely crucial in the success of your trading. In this vide...
Video Transcript:
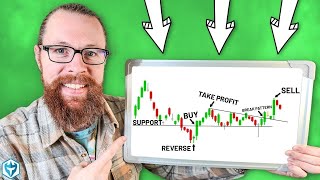
here's a recent trade i just finished a huge 10 gain and massive profit helping out my portfolio so much how did i know this chart was about to go up because of this candlestick pattern right here and in this video i'm gonna share my favorite candlestick patterns just like this one that i use on a daily basis that way you can read and understand chart patterns predict chart direction become a more successful trader and make plays just like this one let's get straight to it shall we [Music] one of my favorite and most used candlestick
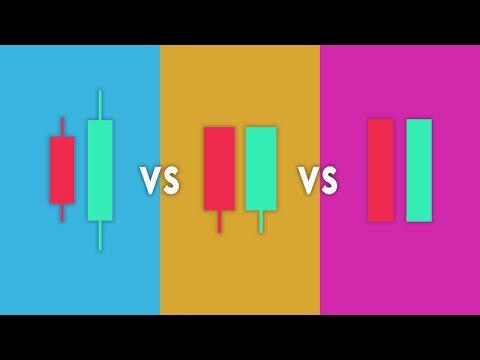
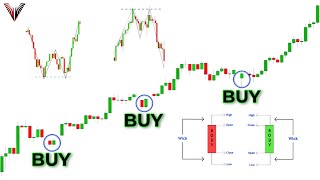
patterns i like to trade with is the engulfing candle i've used it in many of my previous videos it's such a strong candlestick because it can give you the exact point of when a reversal is about to happen what is an engulfing candlestick well it basically explains itself in the name it's a candlestick in the opposite color of the previous candle and it simply engulfs it a bullish engulfing candle opens at or is lower than the previous candles close and closes above the previous candles open so basically being bigger than the previous candle on both
sides making it look as if it's engulfing it let me show you an example so here we found a pretty strong support where price bounced off it multiple times telling us it really respects it we see the price comes back down to the support we can expect it to bounce back up but before entering we need a little more confirmation rather than just assuming the support will hold that's when we see a bullish engulfing candle it completely engulfs the previous red candle and is exactly at the support this is an extremely bullish sign and we
can be pretty confident the price will go up from here so we enter the trade and look what happens now it's also important to note that just because there is a bullish or bearish engulfing candle doesn't mean the price is going to reverse in that direction every time you shouldn't be just trading purely off candlestick patterns you should be using them as almost if they were hints on which way the market is about to go not pure decision makers you should be using other tools with candlestick patterns like support and resistances indicators different strategies etc
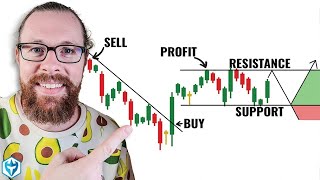
so just to be clear just because you see a bullish engulfing candle doesn't mean the price will go up from there but it can be a good indicator that the price will head in that direction let me show you a bearish example so here we have the same type of setup a strong resistance where the price respected it multiple times before and we see the price comes back up and starts to slow down giving us a bearish engulfing candle completely engulfing the previous green candle we see that it got rejected at the resistance and there
was a bearish engulfing candle indicating this is a good sign to go short and look what happens price goes down next we have the momentum candle the momentum candle is a lot easier to spot than the engulfing candle purely because of its size a momentum candle is simply a candle that is two to three times bigger than the previous candles before it this candle can be insanely powerful because most of the time after it happens the price will continue to go in that direction making this point a great time to enter the most efficient and
effective way to use this candlestick pattern is in choppy markets where the price is moving sideways if you ever see a sideways market then a huge momentum candlestick appears being two to three times bigger than the previous candles you can be pretty certain that the price will continue in that direction why is that well think of it like this whenever there is a sideways market like this there are a lot of shorters stuck in their trades they don't want to exit their trade yet because the price is moving sideways and it can honestly still move
in either direction they draw their support and resistance and set their stop losses right above the support so that means they're going to be tons of traders setting stop losses all over this area meaning if there's a sudden price movement and price hits this liquidation zone all these stop losses will be hit just adding fuel to the fire for this price to keep moving up also when price breaks a choppy market like this it'll usually start a trend in that direction it's the same type of strategy with shorts if there's a choppy sideways market and
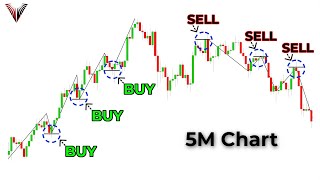
you see a huge red candle two to three times bigger than the candles before it this is a great indicator to enter a short position because it's likely the price will continue to move downwards next we have the multiple candlestick pattern this is one of my favorites as it usually holds pretty true on charts and it's also pretty simple all it is is when you have three or more candles that have wicks going one direction the more candles the better i like to pair this candlestick pattern with support and resistances so look at this chart
what do you see happening well for one we have a key support where price bounces off multiple times then we have multiple candles with wicks going downwards exactly at the support as you can see all these candles have downward wicks telling us that sellers are trying to break the support but buyers keep fighting them off and are winning multiple times confirming that this is a key support and price has a good chance of bouncing upwards as said before the more candles the better the probability the price will respect that pattern let's go over a short
example price moved to the resistance there are multiple candles with wicks heading upwards telling us that price really doesn't want to move up from here giving us a good short entry so we enter here expecting price to reverse from this point and look what happens it does next we have the doji candle the doji candle is a candlestick with a very thin body and it has wicks on each side why this one is so important to understand is because it can be a great indicator on when the price is about to reverse in a direction
what this candle basically represents is the market is uncertain on which way it wants to go and is having resistance whenever there is uncertainty or resistance the price will more often than not head in the opposite direction let's see an example so here we have price moving down pretty hard then a green candle appears and it just so happens to be a doji candle this is telling us that sellers are starting to be less confident and buyers are starting to enter making this point a great potential place to enter what i normally like to do
with doji candles is after i see one i'll wait for two or more candles the same color to confirm that the price will reverse so in this example i see a green doji candle i wait see two more green candles heading upwards telling me i can be confident that the price will continue in that direction so this is the point where i enter the trade and boom the price goes up from here there are multiple different variations of the doji candle that you might see there is the regular one which is the one that we
just talked about in the last example the long-legged doji candle which is basically the same candle but just has larger wicks the dragonfly which has a small body and a big bottom wick then the gravestone which has a small body and has a big upper wick all of these tell the same exact story a reversal in price the next candlestick we'll be looking at is the hammer the hammer is usually a candle that looks like this a decent sized body and a long wick what this candle is telling us is that sellers got the price
all the way down to here but the buyers absorbed all that selling pressure and raised the price all the way back up this is usually an extremely bullish sign and can tell us that the market will continue to go in that direction a candlestick that is very similar to the hammer is the shooting star the shooting star is just like the hammer but it has a small wake on the opposite side you should be playing this just like the hammer where if you see a shooting star candle like this you can have a good suspicion
that the price will start reversing this next candlestick pattern is called the tweezer this pattern is a red candlestick followed by a green candlestick both having similar wicks on the bottom if you see this pair you can have a pretty good idea this chart is about to move upwards let's see an example so here we can see price is about to hit this support we see a red candle with a wick on the bottom right at the support then we see a green candle that also has a wick heading downwards this is telling us that
the price is respecting this support and is now getting some momentum upwards this would be a great time to buy and look what happens price raises it's the exact opposite for a bearish signal so you want to see a green candlestick then a red both having wicks at the top we see that exact pattern here and boom price falls the last and final candlestick pattern i want to talk about is the marabozu the bullish maribozu is going to be a big green candle without any wicks so basically just a big green rectangle the cool thing
about this pattern is that it's a good indicator that price will keep heading in the same direction it's going you will usually see this candle in the middle of a trend confirming that the trend will keep moving upwards let's see an example so here we saw a price reversal price is starting to head upwards then we see a bullish maribozu candle notice how the candle has no upper or lower wicks this means that the lowest price of this candle was the exact same as its opening price and the highest point of this candle is the
exact same as its closing price this is telling us that buyers have complete control and we can almost certainly predict that price will continue to go upwards and look what happens it does the bearish maribozu is the same idea a red candle with no winks here we see the price had a reversal we see a bearish maribozu candle telling us sellers have control and the price will probably keep moving downwards we enter making this a winning trade now it's time to give you a bonus tip for all those who made it to the end of
the video this is a way of me saying thanks for watching all the way to the end even though you should probably try to memorize these patterns so when you see them you can have an idea of what the market is going to do in the back of your head i completely understand that it's hard sometimes to look for them or even remember what they look like well lucky for you there is a way to make it so you can have your chart tell you exactly where a certain type of candlestick pattern occurs which makes
it really easy for you to spot them and you don't even necessarily have to memorize them to do this just go to trading view click the indicators tab type in whatever candlestick pattern you want so for this example we'll do a bullish engulfing simply click it and training view will notify you on the chart when the bullish engulfing candle appears making it extremely easy to spot when it happens and you don't even have to look that hard you can also add multiple candlestick patterns to your chart so you can identify when any of them occur
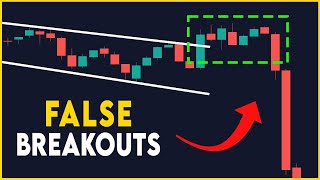
i hope you guys got some value out of this and you learned something new if you did i would really appreciate it if you took five seconds out of your day and like this video the one and only problem trading with candlestick patterns is false breakouts where a certain candlestick pattern occurs but the price actually does the exact opposite of what the pattern predicts if you want to learn how to avoid situations like this watch this video where i go over my secret strategy to avoid false breakouts thanks for watching and i'll see you guys
next time [Music] you
Related Videos
38:11
The Ultimate Candlestick Patterns Trading ...
Rayner Teo
7,344,164 views

54:56
How to Read Candlestick Patterns (Step-by-...
Ross Cameron - Warrior Trading
261,821 views

55:11
Master This ONE Candlestick Pattern TODAY ...
Ross Cameron - Warrior Trading
915,227 views
8:24
How to Avoid False Breakouts (My Secret Te...
TradingLab
2,930,063 views

39:19
Support And Resistance Didn't Work Till I ...
Rayner Teo
1,862,867 views
![1 A.M Study Session 📚 [lofi hip hop]](https://img.youtube.com/vi/lTRiuFIWV54/mqdefault.jpg)
1:01:14
1 A.M Study Session 📚 [lofi hip hop]
Lofi Girl
110,952,921 views

47:53
How to Read the Candlestick Chart | Stock...
Honestly by Tanmay Bhat
632,917 views
17:13
What Is Candlestick Chart? Basics Of Techn...
CA Rachana Phadke Ranade
3,788,027 views
58:19
Ultimate Step-by-Step Guide to Technical A...
Ross Cameron - Warrior Trading
445,526 views
58:21
The Only Candlestick Patterns Trading Vide...
The Trading Channel (The Trading Channel)
3,929,912 views
55:18
How to Read Candlestick Charts (with ZERO ...
Ross Cameron - Warrior Trading
2,416,109 views
45:00
The Only Day Trading Strategy You Will Eve...
The Trading Channel (The Trading Channel)
5,175,593 views
1:41:00
The Ultimate Candlestick Patterns Trading ...
Rayner Teo
504,009 views

36:32
How to Read Candlestick Charts
Trading Academy
3,315,091 views
53:16
Ultimate Candlestick Patterns Trading Cour...
Wysetrade
4,503,201 views

21:49
Convert TradingView Indicators into Strate...
Michael Automates
263,240 views

8:48
The Only Indicator You’ll Ever Need
TradingLab
325,402 views

9:48
The 6 Biggest Trading Mistakes You're Prob...
TradingLab
71,771 views
18:00
The ONLY Candlestick Patterns You Need To ...
Trade Prime
2,198,590 views

48:15
Reading Candlestick Charts Was HARD Until ...
Ross Cameron - Warrior Trading
662,916 views