Statistical Tests: Choosing which statistical test to use
1.72M views1370 WordsCopy TextShare
Dr Nic's Maths and Stats
Seven different statistical tests and a process by which you can decide which to use.
See https://c...
Video Transcript:
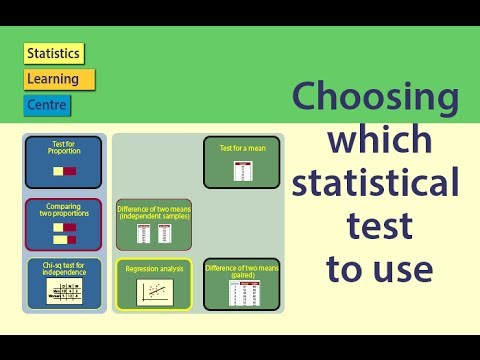
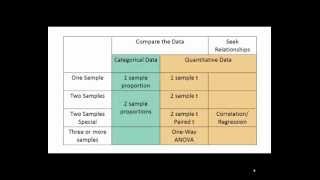
choosing which statistical test to use there are many different tests you can use and statistics sometimes it can be quite difficult to know which is the correct is to use this video includes seven tests you are likely to use involving means proportions and relationships when you are trying to work out which is the most appropriate test there are three questions you should ask one what level of measurement was used for the data we are analyzing true how many samples do we have three what is the purpose of our analysis I will now explain each of
these questions one data or level of measurement is there data nominal or interval ratio nominal data is also called categorical qualitative or nonparametric examples of nominal data are color whether parts are defective or not or preferred type of chocolate nominal summary values are usually stated as frequencies proportions or percentages the tests that involve nominal data are tests for a proportion difference of two proportions and chi-squared test for independence the other type of data is interval ratio also called quantitative examples of interval/ratio data are daily sales figures for choconutties weight of peanuts or temperature the most
common summary value for interval/ratio data is amine tests that involve interval/ratio data our test for a mean difference of two means and dependent samples difference of two means paired and regression analysis for more help on levels of measurement see our video types of data nominal ordinal interval ratio ordinal data can be classified with nominal or interval ratio depending on the circumstances two samples next we ask how many samples are involved is there one sample for which we are testing irrelevant statistic against a hypothesized value or are there two samples which are being compared with each
other or is there one sample but each observation has a measure or score for more than one variable the same sample is measured twice if we wish to compare a proportion or a mean against a given value this will involve one sample if we are comparing two different lots of people or things such as men and women or people from two different departments then we would have two samples if we have two sets of information on the same people or things we would say we have one sample with two variables an example is one set
of days and information on how many chocolate YZ are sold and what the temperature was or one set of people in information on their gender and preferred type of chocolate finally we ask what is the purpose of the analysis we can be testing against a hypothesized value comparing two statistics or looking for a relationship chi-square test for independence and regression are similar in that they are looking at the relationship between two variables the difference between them is in the kind of data if you would summarize the data in a table we would use a chi-square
test for independence whereas if you had put it on a scatter plot you would use regression analysis here is an example for each of these tests they relate back to our other videos teaching about hypothesis testing after each description of the scenario pause the video and see if you can identify the correct test before we tell you the answer hello is still selling show kinetics example one sufficient nuts Helen was concerned whether the quantity of nuts was sufficient at her choconutties she took a sample of 20 packets and found the weight of nuts in each
packet pause the video 1 data the weight was interval/ratio data two samples there was just one sample of 20 packets of choconutties 3 purpose helen was comparing against a given value thus the test she needs to use is test for a mean example to prize tickets in a promotional campaign 20% of all packets of choconutties should include tickets for free prizes helen takes a sample of 50 packets and finds that seven of them have winning tickets pause the video one data for each bar we are saying yes or no depending on whether or not there
is a ticket this is nominal data from which we get a sample proportion of seven out of fifty or 0.14 samples there is one sample of 50 packets Perkis helen is comparing the sample value against a given value 20% we conclude that the test she needs to use is test for a proportion example three Berlin ghiberti compared with Nutter bars Helen thinks her choconutties last longer than the competition nutta bars she gets 36 people to eat one of each and records their eating times pause now one data helen collects times taken in seconds so this
is interval/ratio data two samples there is one sample of 36 people but with two scores for each person the time for the Chokin a tea in the time for the Nutter bar three purpose she is looking at whether there is a difference in the amount of time taken for each of the bars thus the test is difference of two means paired sample example for defective raping from two reppin machines Helen thinks there is a difference in performance between the two chocolatier epping machines and her factory she checks 200 bars from one machine and a hundred
and fifty bars from the other for each bar she is seeing if the wrapping is satisfactory or not she finds that 10 out of 200 bars from the first machine and nine out of 150 bars from the second machine are badly wrecked pause the video data the information for each bar is okay or not okay this is nominal data it has been summarized as frequencies two samples there are two independent samples one sample from each of the two machines three purpose Helen is comparing the proportions from the two samples we can see that the test
is different of two proportions example five do stickers help sales Helen is exploring whether having free stickers makes a difference to sales she has the sales figures for 13 days when she did offer free stickers in ten days when she did not pause and decide on a test data for each day helen has a number or value corresponding to the sales for that day this is interval/ratio data it is summarized as a mean number of sales two samples there are two samples one sample four days worth stickers in one sample for days without three purpose
helen is comparing the average sales figures for the two treatments we've include that the test to use is difference of two means independent samples example 6 our sales affected by temperature Helen wants to see if there is a relationship between the daily temperature and sales of choconutties she has data on sales and temperature for 30 week days of sales pause data sales and temperature are both interval variables samples there is one sample of 30 days with two measures or scores for each day purpose helen is interested in the relationship between sales and temperature this leads
us to decide that the test is regression example 7 men and women in chocolate preference Helen is thinking of selling dark chocolate milk chocolate and white chocolate chocolate ease she thinks that men and women might have different preferences with regard to type she collects data from 50 customers noting down of their men or women and asking them which variety they prefer pause the video and decide data helen records the type of chocolate and sex of person these are both variables samples there is one sample the 50 customers but with two measures or variables purpose Helen
is looking at whether there is a relationship between the two variables thus the test is chi-squared test for independence those are seven examples of the seven tests outlined here there are numerous other statistical tests and other things may need to be considered but this summary will help you to understand what these seven basic tests do and what to look for when deciding on which tests to choose
Related Videos

18:36
How to choose an appropriate statistical test
TileStats
136,638 views
10:55
Nominal, Ordinal, Interval & Ratio Data: S...
Grad Coach
191,896 views

19:54
How To Know Which Statistical Test To Use ...
Amour Learning
776,594 views
12:50
Statistics made easy ! ! ! Learn about t...
Global Health with Greg Martin
2,121,287 views
9:31
Choosing which statistical test to use: Pr...
Dr Nic's Maths and Stats
42,799 views
42:09
Teach me STATISTICS in half an hour! Serio...
zedstatistics
2,803,393 views

11:53
Chi-squared Test
Bozeman Science
2,352,649 views
47:10
How to Use SPSS: Choosing the Appropriate ...
Biostatistics Resource Channel
843,846 views
11:04
Chi-Square Tests: Crash Course Statistics #29
CrashCourse
592,882 views
15:54
Null Hypothesis, p-Value, Statistical Sign...
Stomp On Step 1
1,332,706 views
37:34
Statistical tests for data analysis in res...
Talks on Management & Research
66,317 views

1:08:17
Hypothesis testing (ALL YOU NEED TO KNOW!)
zedstatistics
290,740 views
24:49
Choosing a statistical test for analysis o...
S Manikandan
121,262 views

9:58
Choosing a Statistical Test for Your IB Bi...
Daniel M
799,413 views
19:51
How to Do a T-Test for Beginners
ATOMIC Teacher
714,038 views
28:14
Quantitative Data Analysis 101 Tutorial: D...
Grad Coach
921,661 views
12:32
Choosing a Statistical Test
Erich Goldstein
796,547 views

15:07
T-test, ANOVA and Chi Squared test made easy.
Global Health with Greg Martin
298,969 views

26:09
Chi-squared Goodness of Fit Test! Extensiv...
zedstatistics
172,262 views
13:03
Inferential Statistics FULL Tutorial: T-Te...
Grad Coach
55,893 views