BEST MACD Trading Strategy [86% Win Rate]
2.6M views1310 WordsCopy TextShare

TradingLab
The MACD indicator. Probably one of the most well known / widely used indicators in the trading worl...
Video Transcript:
MACD Strategy This MACD strategy I m about to show you is one of the highest win rate strategies you can possibly do in trading. It is very easy to use, works in almost every single market, and most importantly, it makes money. Well enough talk, lets get straight into it.
The MACD or the Moving Average Convergence Divergence is one the most popular technical indicators used by traders. Essentially this indicator uses moving averages to find trends in markets, and its pretty damn good at it too. Now, if you re an experienced trader, you ve probably used or heard about the MACD indicator before.
But the MACD indicator by itself, is just alright to be honest. So, make sure you watch this full video to see how I pair it with some other indicators to make it perform so much better. First things first, let s add the MACD indicator to our chart.
To do that . Now that we have the MACD indicator added, lets make sure we know how the MACD actually works. The MACD is made up of 4 different components.
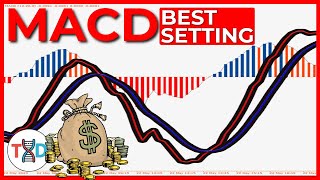
The MACD line, the signal line, the histogram, and the zero line. The MACD line which is the blue line, in most cases is usually a 12 day moving average, the signal line, which is the orange line, is usually a 26 day moving average. Next we have the histogram, which represents the difference between the MACD line and the signal line.
So for example, the smaller the space between the two lines, the smaller the histogram gets. The bigger the space, the bigger it gets. You can also see once the MACD line crosses above the signal line, the histogram turns green and if the MACD line crosses below the signal line it turns red.
And finally, we have the zero line, which basically represents the center of the MACD indicator. Now that we know the 4 components, lets make sure we know how to them. The MACD indicator is insanely good at finding trends in markets.
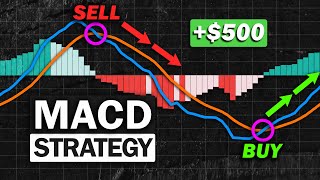
How you can tell if a chart is about to have an upward trend is by looking for a cross upwards between the MACD line and the Signal line. For example, here the macd crosses above the signal line indicating the chart is in upward momentum, and here the macd crosses below the signal line indicating it s in downward momentum. You can also use the histogram to indicate how much momentum there actually is.
So, if the histogram is getting bigger, that means there is an increase in momentum. If it s getting smaller, there is a decrease in momentum. So how you want to use this indicator is by when the lines cross upward, but only if they cross below the zero line.
If they cross and its above the zero line you wouldn t enter a trade. It s the same thing with shorting, you only enter a short trade if the lines are crossing downward, and is ABOVE the zero line. So as you can see, this indicator is extremely easy to use.
But the problem most traders encounter, is that they use this indicator by itself. Let me tell you why this doesn t work. The MACD indicator works extremely well if the market is in a trend.
So for example here, the MACD indicator is doing a great job indicating when the price is about to move upward. Because the chart is in an upward trend. But here, the price is in a downward trend, but the MACD is still signaling to buy long even though the price is going down.
To fix this issue, for example if we are trading long, we only want to trade if the market is in an uptrend. You never want to trade against the trend, because the odds will always be against you. So, an easy way to figure out if the market is in an uptrend.
You simply just need to add a 200 day moving average. To do this Once we have the indicator added, you ll just see a single line. If the price is above that line, the market is in an uptrend.
If the price is below that line, the market is in a downtrend. So after learning that we only want to buy when the market is in uptrend, if we re going long of course. if we put all this together, we buy if the macd lines cross below the zero line mark, and the current price also above the 200 day moving average.
This will guarantee that you are only trading when the market is in an uptrend, which is a very power combo. If you wanted to short, you would just do the exact opposite. Make sure the price is below the 200 day average and the macd lines are crossing downward above the zero line.
So as an example we would enter a long trade right here, because the macd lines are crossing upward below the zero line, and the current price is above the 200 day moving average. Now what I like to do is set a stop loss below the 200 day moving average, so the 200 day almost acts as a wall that the price has to break through to hit my stop loss. Then I like to have a 1.
5 profit ratio for my profit target mark. So as you can see for this example, the strategy worked exactly as we wanted it to, and we made money. But, we can still make this trading strategy even better.
This macd strategy combined with a 200 day moving average, works extremely well only if there is a lot of price movement. Where the strategy starts to get kind of iffy and giving false signals, is when the chart starts going sideways and losing momentum. So as you can see here the chart is moving sideways and lost almost all of its upward momentum and the macd is giving lots of false signals.
If you traded here, odds are you probably lost money. To fix this issue we have to combine the MACD with price action. To do this, identify a key support or resistance where price hits and bounces.
So as you can see the prices goes down, hits this point, and reverses upwards. The next step is to wait for the price to hit the same key level again. Once it does, we are expecting the price to bounce off this support and go upwards just like it did before.
But as a clear note, just because we made the support and it bounced off this before, doesn t mean that it will always do that again. It can easily break through the support and drop lower if it has enough momentum. If we want to make sure the price is about to change in momentum, that s when we bring out the MACD indicator.
So what you would do, is make sure the price above the 200 day moving average, once the price hits the support made, wait for the lines on the MACD to cross below the zero level, and that s when you enter the trade. So I just revealed to you how the MACD, 200 day moving average, and using support and resistances levels gives and extremely high win rate with this strategy. All I ask for in return is if you to take 2 seconds of your time and like this video.
If you want to stay up to date with my future strategies make to subscribe. Because in my next video, I m planning to release a strategy that works even ever better than this MACD strategy. Hope you guys learned something from this video, and I ll see you guys next time.
Related Videos

21:58
How I Nailed Trading with the MACD Indicat...
Ross Cameron - Warrior Trading
361,218 views
![I Found an Upgraded Version of The MACD [INSANE]](https://img.youtube.com/vi/auK8PGULXXw/mqdefault.jpg)
12:32
I Found an Upgraded Version of The MACD [I...
TradingLab
388,348 views

23:13
MACD Indicator Secrets: 3 Powerful Strateg...
Rayner Teo
2,046,299 views

24:30
Very High Win-Rate MACD Scalping Strategy ...
SMB Capital
267,199 views

39:19
Support And Resistance Didn't Work Till I ...
Rayner Teo
1,717,047 views

27:05
MACD Indicator Explained: 4 Advanced Strat...
Trade Prime
1,465,799 views
8:29
🔴 Best MACD "Settings & Combination" for ...
Trader DNA
189,239 views
12:01
Every Trading Strategy Explained in 12 Min...
Data Trader
995,602 views

6:41
Bollinger Band + RSI Trading Strategy That...
TradingLab
982,028 views
![The MACD Indicator For Beginners [Become An Expert Immediately]](https://img.youtube.com/vi/w_F7d_M7hTU/mqdefault.jpg)
33:53
The MACD Indicator For Beginners [Become A...
The Trading Channel
250,634 views
1:16:42
The Ultimate Chart Patterns Trading Course...
Rayner Teo
723,633 views
9:49
Most Effective MACD Strategy for Daytradin...
Data Trader
2,716,679 views

8:48
The Only Indicator You’ll Ever Need
TradingLab
267,279 views

9:47
Discover The Winning 'DOUBLE RSI' Trading ...
Trade Prime
130,606 views

11:50
7 Most Profitable TradingView Indicators F...
TradeIQ
347,297 views

16:43
I Tested The MACD - Does It Actually Make ...
TradingLab
188,894 views
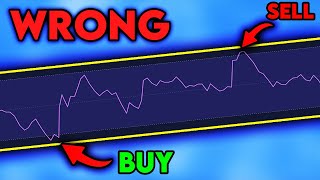
8:11
You're Using The RSI WRONG...
TradingLab
264,670 views
16:51
RSI Indicator in Live #StockMarket | Techn...
Pushkar Raj Thakur: Stock Market Educator 📈
2,764,495 views

11:21
STOP Using The MACD! Try THIS Indicator In...
Data Trader
1,497,782 views

7:41
How She Made MILLIONS Using The MACD
TradingLab
203,147 views