The Main Ideas behind Probability Distributions
463.28k views662 WordsCopy TextShare

StatQuest with Josh Starmer
Here we demystify what a probability distribution is. It's not complicated, and we'll build on this ...
Video Transcript:
Stat Quest, Stat Quest, Stat Quest, Stat Quest, StatQuest! Hello, and welcome to StatQuest! StatQuest is brought to you by the friendly folks in the genetics department at the University of North Carolina at Chapel Hill Today, we're going to be talking about what a distribution is.
Imagine you're at a wild and crazy dance party and you overhear someone talking about statistics. Chances are, they're going to be talking about distributions. .
. Dag! What is a statistical distribution?
Imagine we measured the height of a lot of people The first person we measured was 5. 2 feet tall So we put that measurement in a bin that spans from 5 feet to 5. 5 feet The second person we measured was 5.
8 feet tall The third person we measured was 5. 6 feet tall The fourth person we measured was 5. 9.
feet tall The fifth person we measured was only 5. 1 feet tall And the sixth person we measured was 6. 3 feet tall OK, you get the idea - we measure a bunch of people and put the measurements in bins.
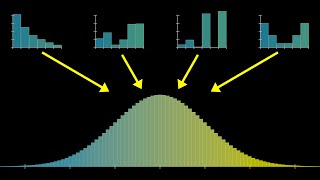
When you stack a bunch of measurements into bins like this, you get a histogram Most of the measurements come from people between 5 and 6 feet tall People smaller than 5 feet tall were relatively rare People taller than 6 feet tall were also relatively rare In other words, if you picked one measurement at random, there's a good chance it would be between 5 and 6 feet tall The histogram gives us a sense of how likely we'll measure someone really tall or really short or closer to the average What if we use smaller bin sizes for our measurements? Now the bins are half as wide as before And here's how our data stacks up in the smaller bins Again, most measurements are between 5 and 6 feet tall, but we can be more precise, and say half the people are between 5. 25 feet tall and 5.
75 feet tall By measuring more people and using smaller bins we get a more accurate and more precise estimate of how heights are distributed. We can use a curve to approximate the histogram. The curve tells us the same thing that the histogram tells us: There's a low probability that we will measure someone shorter than 5 feet tall.
There's a low probability that we will measure someone taller than 6 feet. Lastly, there's a relatively high probability we'll measure someone between 5 and 6 feet tall. However, the curve has a few advantages over the histogram: First, even though we measured a bunch of people, we didn't get a value for this bin.
Since we can't calculate that probability with the histogram, does that mean we will never get a measurement that fits into that bin? No. Instead, we can use the curve to calculate the probability.
Another advantage is that the curve is not limited by the width of the bins. If we wanted to know the probability of measuring someone between 5. 021 and 5.
317 we could use calculus, or a computer to calculate this, without having to round to the nearest bin size. Lastly, if we don't have enough time or money to get a ton of measurements, the approximate curve based on the mean and standard deviation of the data that we were able to collect is usually good enough. Thus, using the curve can save us a lot of time and money.
Both the histogram and the curve are distributions. They show us how the probabilities of measurements are distributed. The tallest part of the histogram, or curve, shows the region where measurements are most likely.
The low parts of the histogram, or curve, show where measurements are less likely. We've been talking about how height measurements are distributed, but there are all kinds of distributions with all kinds of interesting shapes. We'll talk about these in future StatQuests.
The end!
Related Videos
14:22
Calculating the Mean, Variance and Standar...
StatQuest with Josh Starmer
492,988 views
5:13
The Normal Distribution, Clearly Explained!!!
StatQuest with Josh Starmer
1,604,044 views

5:01
In Statistics, Probability is not Likelihood.
StatQuest with Josh Starmer
1,353,632 views

10:55
How to Learn Probability Distributions
Mutual Information
49,249 views
12:34
Binomial distributions | Probabilities of ...
3Blue1Brown
2,292,479 views
15:47
The Binomial Distribution and Test, Clearl...
StatQuest with Josh Starmer
296,027 views
16:17
Probability Distribution Functions (PMF, P...
zedstatistics
1,221,758 views
![The 6 MUST-KNOW Statistical Distributions MADE EASY [4/13]](https://img.youtube.com/vi/V3Qxj2C7rP0/mqdefault.jpg)
9:25
The 6 MUST-KNOW Statistical Distributions ...
Andrew Jones
15,023 views
31:15
But what is the Central Limit Theorem?
3Blue1Brown
3,785,517 views
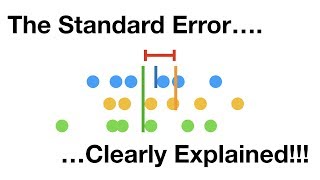
11:44
The standard error, Clearly Explained!!!
StatQuest with Josh Starmer
230,942 views

12:11
Simple Explanation of the Birthday Paradox
Wrath of Math
865,391 views

6:12
Maximum Likelihood, clearly explained!!!
StatQuest with Josh Starmer
1,521,977 views
11:23
The Shape of Data: Distributions: Crash Co...
CrashCourse
584,745 views

14:00
Bayes' Theorem, Clearly Explained!!!!
StatQuest with Josh Starmer
401,450 views

50:51
Probability Top 10 Must Knows (ultimate st...
JensenMath
502,461 views
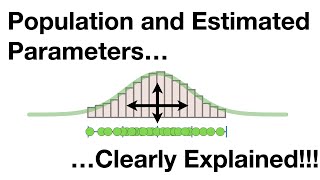
14:31
Population and Estimated Parameters, Clear...
StatQuest with Josh Starmer
376,589 views