How to create cause-and-effect diagrams
622.71k views394 WordsCopy TextShare
Harvard Online
Learn how to create a cause-and-effect diagram, also known as an Ishikawa or "fishbone" diagram, to ...
Video Transcript:
[MUSIC PLAYING] DAVE WILLIAMS: A common challenge for improvement teams is identifying what changes you can test to improve a process or problem. One great method to help you break down ideas is a tool known as a "cause-and-effect diagram. " You may have also heard of this tool referred to as an "Ishikawa diagram"-- attributed to its creator, Kaouru Ishikawa-- or a "fishbone diagram" because of the resemblance to the bones of a fish.
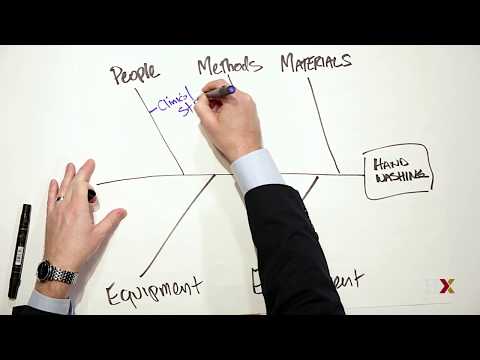
To create a cause-and-effect diagram, write the effect in a box on the right-hand side of the page. So let's imagine we're working on improving hand-washing. All right.
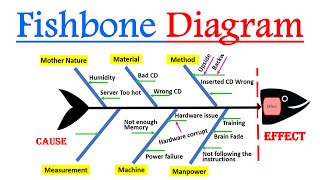
Then draw a horizontal line across the page. Decide on a few categories or causes for the problem. Useful categories of causes in the classic fishbone diagram include people, methods, materials, equipment, and environment.
Then we can draw a diagonal line to each of these, and these are actually the bones of the fish-- and hence, its name. The process of categorizing potential causes may be very useful to help you to break down a complex problem and focus in on it from various perspectives. So as you're looking at each of the categories, you want to generate a list of causes.
In this example, people might include clinical staff. All right. It also might include non-clinical staff.
Let's put them as just "other staff. " It might include the methods. How do you actually wash your hands?
I'll say "wash process. " It could be the materials. Are you using the right kind of soap, or does it dry out your hands?
So we'll think about the soap. It could be the equipment, like the dispenser. Is there an easy dispenser to use?
Does it give you the right amount? Or maybe it's the environment. Where is the dispenser location?
Is it near the process of care? Identify the causes by asking why with people that are closest to the process until you've reached a useful level of detail. That is when the cause is specific enough to be able to test a change and to measure its effects.
Sometimes, I like to describe this for folks that have children as the five-year-old method. If you ever had a kid, they asked you "why" five times constantly until they get to the root of the problem. And you're doing the same thing here.
Related Videos
7:07
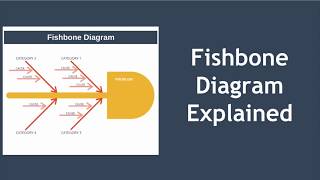
Fishbone Diagram Explained with Example
EPM
417,276 views

16:04
The 7 Quality Control (QC) Tools Explained...
CQE Academy
757,640 views

12:56
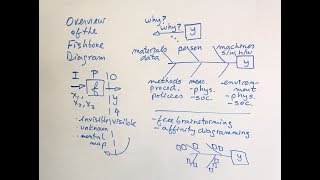
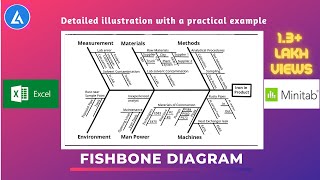
How to Make a Fishbone Diagram (Ishikawa D...
David McLachlan
93,142 views

5:23
How to Solve a Problem in Four Steps: The ...
DecisionSkills
652,962 views
10:36
Six Sigma Overview | Fishbone Diagram | Gr...
fkiQuality
50,644 views
15:52
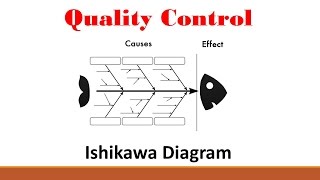
Quality (Part 2: Ishikawa Diagram)
Infinity MFG
100,383 views
7:01
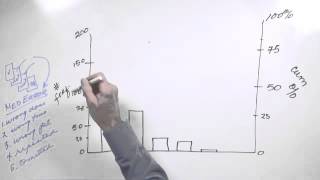
Whiteboard: Pareto Analysis
IHI Open School
293,973 views

16:34
5 Why Tips and Tricks from practical exper...
Tom Mentink
36,855 views
3:20
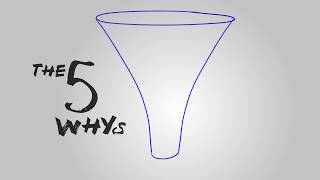
Clarifying the '5 Whys' Problem-Solving Me...
Lean Enterprise Institute
576,792 views
7:46
What is Fishbone Diagram ? How to construc...
Digital E-Learning
118,676 views

14:25
The Classic & Reverse Fishbone Diagram | A...
i-nexus strategy software
48,758 views

19:23
Using the Fishbone to Solve a Complex Aero...
Learn Lean
9,047 views

20:10
Fishbone Diagram EXPLAINED - Root Cause An...
The Business Analysis Doctor - IIBA Certification
16,284 views
8:28
Fishbone Diagram (Ishikawa): Explained wit...
LEARN & APPLY : Lean and Six Sigma
190,129 views
11:20
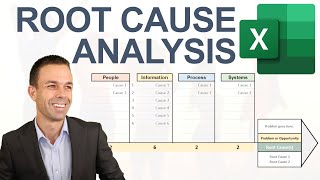
How to Make Root Cause Analysis in Excel (...
David McLachlan
17,575 views
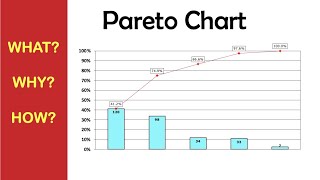
5:21
Pareto Chart // What is it? When and How t...
UC Improvement Academy
22,348 views

13:41
Live Ishakawa Fishbone Diagram Build
DTI Training
44,110 views

11:12
Here's The Secret How To Create These Anim...
Amigoscode
544,315 views

8:32
What is Root Cause Analysis (RCA)?
IBM Technology
87,032 views

14:00
Pareto Analysis (how to create a Pareto Ch...
RISR Careers
145,384 views