Concept of Confidence Interval and Examples
51.84k views5315 WordsCopy TextShare

Dr. Harish Garg
This lecture explains Concept of Confidence Intervals and its illustrative examples
Other videos @Dr...
Video Transcript:
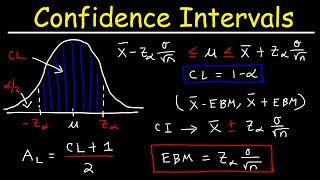
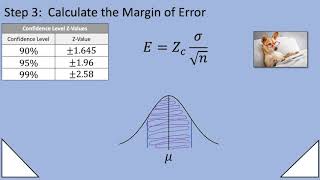
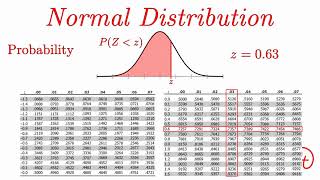
hello students welcome to the next lecture on the probability and stack today we will discuss about the concept of confidence interval myself dr gur working in the school of mathematics thapar institute so what is our overview about the confidence intervals and why there is a need of this in the testing of hypothesis that we will discuss in detail so first of all when you are talking about the confidence interval it is nothing but just the range of the estimates for the unknown parameters so this unknown parameter it can be the sample mean it can be standard divisions it can be the proportion or anything are there so the target is on your choice if you want to calculate the mean then whatever the range of this estimator is called as the confidence interval this confidence interval is used widely in the statistics for describing the amount of the uncertainty associated with these sample estimates of the population or in other words you can say it are used to describe the uncertainty about these sampling methods whether you use any of the kind of the methods whatever the uncertainty is there you have to describe them so in the nutshell we can say the confidence into the range within which the most possible values would occur so what are those possible values are there we will see in this couple of slides so whenever you are talking about the most possible values it means they are talking about some intervals v that is a lower intervals and the upper values and the target of these lower and upper intervals up to some level and that level is called as the confidence level we talk about the 90 percent is confident so if i say this value is there we can talk this as a lower and upper so how much confident you are say 90 percentage or 95 percent this is the meaning of the confidence intervals what is the 90 percentage confidence level means this means that you would expect that 90 days of the intervals what you have achieved that will include the population parameter similarly if you consider about the 95 percentage that means whatever you have obtained as a confidence intervals like lower and upper then whatever the population parameter that will acquire in this intervals up to this 95 percentage and so on so what is the definition of this confidence interval is if you have considered the random sample x and have some distribution functions with the unknown parameter theta or you can say the statistical parameter theta like say if you consider about the normal distribution then it will be the mean and the variance are there so we all know that if x follows the normal distribution and various is this then this is the population mean so if you consider about the sample mean then this sample means is denoted by x bar based on this x bar your target is to compute the value of mu that is a statistical parameter and the all the other parameter which are not interested we denote it as a file like in this case this is my phi this is my theta then we can defines this confidence interval is nothing but this l and u both are the function of the x called as the random variable such that their probability will be nothing but confidence level what is the confidence level is either you want to be achieved as a 90 percentage 95 percent is and so on so your target is to find the value of the l and u that is a lower and upper bound such that the probability would be achieved as per your confidence level so if you achieve that much level for all the values of the theta and phi then this l and u is called as the intervals and the corresponding values called as confidence intervals this gamma can also be defined in terms of the level of significance as 1 minus alpha where alpha is usually as a five percentage for this and here is for the ten percentage this is for the five percentage and this is for my one percentage are my level of significance these are my level of significance now our target is to find the value of the l and u in such a way that whenever you want to collect the x randomly whether you want to collect x this whether you want to collect x this and so on whatever you achieve with the same probability of 1 minus alpha that's nothing but gamma and whenever you want to achieve this again and again your your actual value or college the true value is lies in between this interval so your target is to find the ln u very precisely and this would be hold for all the values of the theta and phi what are the various factors which are including the confidence interval so there are the four factors which are there are the three major factors which are including them the first one is the confidence level whether you want to achieve as a 90 days 99 percentage or the 95 percent is out there what are the sample size if you consider as a sample size of say n is good five whether you consider the sample size of greater than 30 or whether the sample size is considered as less than 30 second third one is the variability in the sample what is that there is a variation in this samples are there if you consider these five elements whether the numbers are my 3 7 9 10 or 12 or if you consider these five elements are there with respect to say here you can see 91 and you can see they have a large variation in it there is a large variation in it while in this case it has a small variation so that's depending on the variability this amp as clear that the as long as you consider the high confidence level that will give you the wider confidence interval so it means if you consider as a 99 percentage or 95 confidence then it will be like of this but if you consider as say 99 percentage confidence then it gives a wider about that similarly for this up to say 90 percentage so as you consider the higher the confidence level the demand of this wider interval confidence is also with a wide second is the sample size if you consider as a sample size to be the large then the confidence intervals are narrow on the other hand if you consider the sample size is small then it will be is wider are there we will see in the couple of the examples in this last slides are there the third thing is the variability as we have greater variability the sample produce the wider confidence intervals and vice versa for the less variable so when you make an estimate of any of these statistics so make sure that there are the two terms in the uh probability instead one is the population and second term is called as the steady state surface so when you consider about the population we call as the mean is mu and when you consider as a statistic then the mean is denoted as x bar so when you make an estimates in the statistics the either you consider as a test statistics or the summary statistics are there or called as the point estimator if you consider as this is my point estimator or you can consider as the interval estimator then there is always occurring and uncertainty about that and the number which are based is totally depending on the sample of the population which you are taken then this confidence interval is give you about the range that whatever your expectations is fall in between this range so make sure that whatever your expectation that may fall in between this l and u whether you want to perform the experiment again or you want to re-sample this observation for example if you consider this and this 5 are there and then you can find this lower limit as of this and upper limit as say 131. 4 and if you consider as another of the five elements and then your value of this theta must lies in between them so that's why this confidence interval give you whether you want to perform the experiment again or the resampling with the same number of observations what exactly the confidence interval will do so remember the confidence interval will give you this results are there there is a mean plus minus of the variations so that it gives you the mean of your estimate plus minus variation in the estimation speed that is what what is the meaning of that when you think about this is your estimation so this means this is my mean plus of the variation and this is my mean minus variation this theta is nothing but my mean so this gives you the range of the value that you expect to fall in between them whether you want to redo your experiments with this certain level of the confidence again remember that the confidence may be the 90 percent is 95 percentage or the 99 in statistics you can say the confidence is another way to define the probability why as we define that probability is of here is nothing but my 1 minus alpha or called as the gamma so this is the probability to describe this confidence r here for example if you want to construct the confidence interval up to the 95 percentage levels then what is the meaning of that whatever you got the probability in terms of this l and u how much confident you are you are confident 95 times out of the hundred that you your estimates will fall in between these upper and the lower values so that's the meaning of this 95 confidence level or you can say confidence level gamma this is the gamma is nothing but 1 minus alpha alpha is nothing but the level of significance when you can use the confidence intervals are there you can use the confidence interval at any of times you know all these proportions if you have the jet samples for the last sample you all know that this is my testing of the hypotheses are there when you consider about the sample mean if if for these small samples or for the large sample if you consider about the small sample then you can consider as a t of test which can be defined like of this that is x bar minus mu divided by s by root n if you consider as the last sample then it will be given as a z test then the formula will be given as x 1 minus mu divided by here so based on this proportion sample mean or you can consider the difference between the sample means or the variations are there all these formulas in in all these cases and similarly for the chi square and over and so on you can use the confidence interval but here the most the major important thing is that when you use these four for the kai scare are they like of this this will either for the small sample or you can see for the large sample it will give you only the point value after the calculation you will get the single number similarly for here you will get a single number so all these are the point estimates which will give you only about the point number but they will not give you about the interval circuit that means they does not give any information about the variation of the number so it will give you only as a single number so in order to get as a intervals or about the variation of the numbers we will use the confidence intervals how we can use that so when we need to know to calculate the confidence interval so our target is to find the value of this l and u so for that there are the four things about that the first thing you need to about the point estimate that is the theta so this theta it can be the mean sample mean it can be the sample variance it can be the correlations it can be the proportions and so on so anything you want to do that is your that is your point estimate that is you need to construct the confidence intervals so if you can consider the population means corresponding to them if you consider the population proportion if you consider the confidence interval for the of the population variance of the standard deviation or the correlation coefficients another thing that we need is about the critical values all of you know that if there is a jet value then we all know it's one point six four five corresponding to the five percentage if you consider as a t test then it will be the t degree of freedom 9 about 0. 05 and so on then the sample standard deviation of the sample and the population size these four parameters we need to calculate the confidence intervals about the ln how we can see about that so once we need once we know all these four factors then we can easily calculate these confidence intervals for example when you consider about the large sample that is whenever the sample size is greater than of the 30 then how you can find the confidence intervals if you look about this testing of the hypothesis these are my rejection portion and this is my accepted portion then your target is to find the value of this l and the u and call as the confidence interval as we know that whenever the sample size is greater than 30 then we will always use the jet statistics as of here now based on this jet statistics look at that we need the four parameters one is the point estimate so that's the value of the point estimate it will give you the point value the second thing what we need is that we need the critical value standard deviation and the sample size the sample size we knows that because whenever n is greater than 30 we know standard division we all know that the only thing is that critical value and we knows that the critical value at the one percentage is here five percent is this ten percent is here but question right this is how you can check about the say 15 percentage level of significance what will be the confidence intervals so how you can do so if you go to the google and write this standard normal distribution table or you can see from any of the statistics table if you want to look at that if i consider as a five percent is so this shaded portion is my five percentage and we all know that this value is my center value and this portion is same so this is my two point five percentage this value is my two point five percent so look at that if i consider this as here now if you consider about here how you can say it's a 1.
96 so what is that this is my 0. 05 what is the area corresponding to this this is nothing but my 0. 97 this is what is that this is remaining is by 95 percentage this is my 2.
5 percentage of total is 97. 5 so look about this table what is the value where is the value of 0. 975 you can see this is the value of the 0.
97 corresponding to 1. 9 and corresponding to 0. 6 so it means the answer is my 1.
9 1. 9 plus of 0 points zero six so what is the answer is zero one point nine similarly if you look about the ten percentage that's the meaning of that the this portion is nothing but my five percentage and five percent is and this is my 95 so if you look about that there is a 95 this is 94 you can see this value is lies in between them you can see this value lies in between them so that is 1. 6 and in between them is my 0.
045 so you can see the value is my 1. 645 similarly if you look about this 2. 59 so you can see 995 which are lies in here you can see in this value 2.
5 and up to here so you can see this value here so you can easily find from this statistics table now if you look about this five percentage are there so i can consider as a 95 percentage the value is my 1. 96 so you can see this value is my minus 1. 96 plus one point and your target is to find what is that theta in this case we're talking about the mean your theta will be mu so your target is to find this value of mu how you can do that you can simply take a multiply from this side here now you can find take x bar on the both side you will get this as the so this is my lower this is my upper this is the my population me so that's you can say the confidence interval is nothing but x plus minus 1.
96 off here so 95 percent is confidence interval by here if you want to find the 99 percentage confidence interval what you can do that is a one percentage you can change this 1. 96 to be 2 point five seven six and here or in general it can be written as z of alpha where z alpha is the critical value of the jet at alpha level of significance so if you want to consider the ten percentage level of significance then this value can be replaced by 1. 645 on the other hand if this what is the sigma sigma is nothing but my population standard deviation but if population standard deviation is not given to you then we can replace it with the help of standard sample standard deviation as small s however on the other hand when you have considered the small samples like of this then we all know that we will use as a t test like of this x bar minus mu divided by s by root n then we can do again the similar part we will try drive like of this what is that this is nothing but my critical value of the t tables at the alpha level of significance where x bar is my sample mean and small s is my sample standard deviation divided by n minus 1 how you can find this value if you look about the t tables and you can see if you want to find this as a 0.
05 for the two-tail this is my two-tail 0. 05 is here degree of freedom is my 5 this 5 is called as the degree of freedom look at that this is my 5 and the corresponding value is my 2. 571 is here similarly for here if it is a one tail you can see about the one tail of zero point zero five here and the five degree of freedom is my two point zero one five now we can see about this seven to eight example to illustrate this concept now your first target is to identify that whether it's a small sample or the last sample so your target is to find the confidence interval up to the 95 percentage for the symbolic blood pressure so look at this about that so it means our target is to find only for here you can see the value of the n is my here sample mean that is x bar these are standard deviations so we can consider this as of small s now you can see the value of the n is less than of the 30 so it means this is my small sample and once it is a small sample we can apply the t test for the confidence interest so we can apply that t test so and hence the our formula will be here y is a 9 because the degree of since n is my 10 degree freedom is my 9 and my target is to find this value from the table so you can go to the t table look at the uh level of significance is my 95 you can see this is my 95 percentage so the level of significance is my five percent you can see here degree of freedom is my nine so you can see the value is my two point two two six two so you can replace this value here x y value is this s values here you can substitute this what is the meaning of this plus minus ten you firstly you can take it as a plus and then you can take it as a negative you can take this as of interval so this is the mean of the population mean of the here what is the meaning of that that means if you consider this sample you are 95 percent is confident that the actual value but his actual value is 121.
2 which are lies in between them of this intervals now you can see that 121 is very far away from this lower and upper bounds why because the margin of error is very high this is the margin of error you can see the margin of error is very large why because we have the n which is a 10 which is a of the small size r if you consider a similar example but here we can consider about these again for this you can see the difference in between them again our target is to find the confidence interval for here now you can see the value of the n is greater than 30 that means this is for the large sample once it's a large sample then we can apply the jet test what is my here what is the value of the z alpha at the five percentage level it is nothing but my one point nine six so i can substitute the value of the x bar here i can taken the value of the z is this and i can substitute this value and you can see this is my variation you can see this is nothing but my mean plus minus variation and you can see the variation is less in this case and here and you can see the mean is 1 127. 3 is near to that and what is the meaning of that that is a point estimator of the mean 127 is we are called 95 percent is confident that this point estimator lies in between them and you can see as compared to the previous example this one 27. 3 which are near to this interval also you can see the range of this there is a variation is very small why because we are considered this as large sample so as i discussed that if you have the large sample then the sample size is large then the variation is the small look at the another example out there a random sample consists of the 30 samples and is my 30 and on measuring their diameter the mean diameter is my 91 so sample mean is my 91 this is sample standard division is my 8 mm and your target is to find the 85 percentage confidence now you can see the value of the n is my greater than equal to 30 so we have to apply the large sample in order to apply the large sample we need this value at how much confidence level is 85 percent a confidence level and the level of significance is my 15 percenters so once it is a 15 it means this value is my 0.
075 this value is my here and this is my 85 percentage or you can say this is my 7. 5 so what is the total portion of this it is 5 plus 7 this is nothing but 92. 5 that means 0.
925 [Music] so you can look about the table you can see here and find there is a point nine two five appear so you can see nine two five appears at here this is not exactly and this is not that is in between them that is a one point four three two four so you can see this value is one point four for this value is one point nine what is the point nine two five this is my here so you can see this value is one point four that is 1. 4 so i can substitute this value as a 1. 44 x bar is my here as is this n is my 30 and after the calculation you will get this as range and you can verify that this point estimator is lies in between them hence the confidence levels are my this look at the another example now in this case you have to find this 90 percent confidence interval and you can see that what is the how many numbers are there these are my 10 which is less than of 30 it means it is a small sample it means you have to apply the t test once you are applying the t test the value is my 90 percentage so the alpha that is the level of significance is my 10 percent degree what is that you have to write here what is that n is my 10 so degree of freedom is my 9 so our target is to find this value at 10 percentage level of significance so look at the table so i need firstly x bar we can easily use this formula sum divided by n of these numbers and what is the s is n minus 1 you can easily do that some of these numbers are my 88 10 is 8 and what is that this is 2 minus 8 16 minus 8 3 minus 8 up to 12 minus 8 square by after calculating you will get x bar and sr now only target is to find this value how you can do that you can look about this t table the level of significance is my zero point one zero degree of freedom is my nine the value is my one point eight three three you can substitute this value here after the calculation you will get this confidence again you can see there is a wide range of this why because the sample size is very small that's why the wide range are here look at the another example are there so out of 100 of the people so if you have the 100 peoples are there you randomly chosen 46 as a man so it means the sample is my 46 the mean is my 86 standard division is my six point two then you can say that uh determine the selected lengths are tall enough or not you can see it in this case it is not given to you whether it's a ninety percentage conference 95 99 and so on when nothing is given to you then it means you have to take an about 95 percentage by default so it means our target is to find the 95 percentage off here since n is my 46 which is greater than of the 30 so then our target has to be here what is the value of this alpha at 5 percentage confidence level that is nothing but 1.
Related Videos
10:18
Neyman-Pearson Lemma and its Proof
Dr. Harish Garg
43,689 views

28:28
Test for Single Proportion | Easiest Way 1...
Dr. Harish Garg
45,989 views
20:35
How To Find The Z Score, Confidence Interv...
The Organic Chemistry Tutor
1,189,906 views

22:21
Method of Moments | 2 Steps Approach | Exa...
Dr. Harish Garg
60,668 views
44:47
Theory of Estimator| Point and Interval Es...
Dr. Harish Garg
135,922 views

20:14
How to Write Null and Alternative Hypothes...
Dr. Harish Garg
59,993 views
10:34
6.1 Confidence Intervals for the Mean LARG...
Kaffenate Math
6,114 views

22:10
Solved Examples of F - Test and Distributi...
Dr. Harish Garg
30,569 views

16:14
t-Test - Full Course - Everything you need...
DATAtab
382,795 views
51:08
2.6.3 Heap - Heap Sort - Heapify - Priorit...
Abdul Bari
2,271,729 views

24:50
One Sample t-Test & its Examples- 3 Steps ...
Dr. Harish Garg
33,989 views

1:08:17
Hypothesis testing (ALL YOU NEED TO KNOW!)
zedstatistics
304,095 views

19:52
Hypothesis Testing Full concept in Hindi |...
Last moment tuitions
1,912,414 views
1:03:36
ATOMIC STRUCTURE : LECTURE 20
Acharya Vatsalya
10 views
10:59
Normal Distribution EXPLAINED with Examples
Ace Tutors
967,562 views

29:22
Test for Two Samples Proportions | Easiest...
Dr. Harish Garg
27,140 views

19:14
Hypothesis Testing EXPLAINED
Ace Tutors
21,824 views

43:08
10.1 AVL Tree - Insertion and Rotations
Abdul Bari
1,291,955 views

11:42
F-Distribution and its Mean and Variance
Dr. Harish Garg
34,483 views