How To Find Support And Resistance Levels (Easily)
1.9M views2651 WordsCopy TextShare
Wysetrade
💰 EXPERT CONTENT: https://www.wysetrade.com
🛠 OUR TRADING TOOLS: http://tools.wysetrade.com/
�...
Video Transcript:
hey guys in this video we will show you how to easily find a support and resistance levels as well as some advanced techniques we use that would take your training to the next level also we are back in full force and we will be releasing a ton of new content so make sure to hit the subscribe button and to turn on the notifications about so that you know exactly when new content is released so again the number one question we always get asked is how to find support and resistance levels also right now comment below
on what topics do want us to cover and we'll work our best to create those videos for you so first with the basics what is support and resistance exactly support and resistance is areas where price has reacted to in the past and can potentially keyword potentially react to again in the future now why do we have to draw in support and resistance levels we draw in support and resistance levels because once price gets back to these levels there are possible trade opportunities that arise and you want to have these levels drawn in already as a
reminder to look now there is specific criteria we look for in order to identify support or resistance levels which we are going to list for you right now one we look for the extreme swing highs and swing lows meaning the highest and lowest points that price has reached in recent time too we like to look for multiple rejections of an area the more rejections the better 3 we want the level to be obvious meaning it jumps right out at you again to make this clear the level should be obvious and it should jump right out
at you meaning you should be able to spot the level right away when looking at a chart for the move away from the area was drastic five the level has acted as both support and resistance meaning it was respected from both sides six the level was recently respected or formed in a recent time period now this is a very key point you don't need all the criteria we just listed to make a level support or resistance but the more criteria that the level fulfills the better the level so let's jump into the charts and break
down each of these traits now we're going to go through each of the traits we just listed but more in-depth on the charts so starting with trait number one that will qualify a level of support and resistance which is the extreme swing highs and swing lows meaning the highest and lowest points that price has reached in recent time so we look left and you notice price came up hit and reversed and this was the highest point the price got to making it an extreme swing high now same along the bottom price came down hit and
reversed and this was the lowest point that price got to in recent time making this a level of support as always we don't jump into trades blindly regardless of how high our low prices we always wait for price action so to the next trait we look for now trait number two that qualifies a level as support or resistance is multiple rejections and the more rejections the better as you can see price came down to this area on four different occasions and each time it got here it reversed giving us four rejections and a level of
support so why is this important multiple rejections shows that price reacted to this level more than once meaning traders took action at this level during different points in time now to the next criteria we look for trait number three is very key the level should be obvious meaning the level should jump right out at you and you should be able to spot them right away so here in the pound yen you can see the very obvious levels price came up hid and reversed giving us a clear level of resistance and again it is very obvious
and you can spot it right away same along the bottom price came down hit and reversed again this is very obvious and you can spot it right away in contrast here are some minor levels that are not obvious to the left you have this minor level here that is not obvious and then you have this next minor level here that is also not obvious minor levels are useful for intraday trading which we will get into in a future video but for now focus on the obvious levels so why is this important the more obvious the
level is means that more traders will be eyeing the level which increases the probability that traders will be taking action at these levels as in closing or opening positions now to the next criteria trait number four the move away was drastic and significant meaning not just a small bounce but an actual reversal as you can see down here price moved away from this level drastically so we have a level of support here next right here price again moved away from this area drastically so we have another level and again up top every time price came
up it reversed drastically so we have another level so it's of the next criteria trait number five the level has acted as both support and resistance as you can see every time price got this level of support it reversed before finally it broke through and came back up to support turned to resistance and it hit and reversed again showing that this level acted as both support and resistance so to the last trade trait number six recently respected or recently created meaning traders took action at the level in a recent time period as you can see
we have three rejections of this area of resistance meaning it is still valid in a current time period if you look further back you also have a swing high up here but the recent rejections are always more effective as they are current and new now before we continue if you are enjoying this video and want us to continue to make more videos week after week please hit the thumbs up button and also leave some comments below to show your support let us know your thoughts as well as what kind of other videos you want to
see and we'll work our best to make them so now that you know what criteria to look for let's put it all together and apply what we just showed you and start plotting all the support and resistance levels right on the charts again as a reminder you don't need all the criteria we listed to make a level support or resistance but the more criteria that the level fulfills the better the level now starting from the very top we spot this level at the very top where price came up hit and reverse drum so we draw
it in so what criteria does this level have that we previously listed that makes this a good level let's break it down one this level is the extreme swing high meaning it is the highest point that price has reached in recent time - the level is obvious and it jumps right out at you and you should have spotted it within seconds 3 the move away was drastic because as you can see price reversed significantly after it got here and 4 there were multiple rejections of this level because if you look closely there were three smaller
rejections of this level this is also what you can call a triple top so moving on down now the next level we spot is this level here with six rejections rejection one rejection two rejection three rejection for rejection 5 and rejection 6 you so again what traits and criteria does this level have that makes it a good level one there are multiple rejections of this level a total of six rejections to this level has acted as both support and resistance three the level was recently respected meaning it is still valid in a current time period
for the moves away from this area are drastic and five the level is fairly obvious as you should have been able to see the reversals from this area very quickly now moving on down we spot the three rejections here and draw in another level so again what criteria does this level have that makes it a good level of support one it is the extreme swing low meaning the lowest point price has reached in recent time - there were multiple rejections of this level three in total three the move away was drastic because as you can
see price reversed significantly when it got here for the level is obvious as he should have easily spotted it when looking at the chart and five it was recently respected and occurred in a recent time period so there are other minor levels in between but again for this video we want to keep things simple and focus on the key levels first again as a reminder just drawing in support and resistance levels does not mean you take trades blindly once price gets to these levels you always need to wait and look for price action patterns so
let's do this again on another pair here's the euro Swiss and again starting from the top we noticed this level here where price came up hit and reversed from so we draw it in so again what criteria does this level satisfy one it is the extreme swing high to the move away was drastic and three the level is obvious so moving on down to the left we noticed this level here where price came up hit and reversed from so we draw him the criteria that this level satisfies is that the move away was drastic and
the level is obvious so moving on down to the right we spot this level here where price came up hit and reversed from so we draw it in the criteria that this level satisfies is that the move away was drastic and the level is obvious so moving on down we spot this next level here so we draw it in you this is a very key level because it encompasses a lot of the criteria we like to see remember the more traits a level has the better so one there were multiple rejections of this level to
the level acted as both support and resistance three the move away was drastic and four the level is obvious so moving on down to our final level we noticed this level here where price came down hit and reversed from so we draw it in again what criteria does this level satisfy one it is the extreme swing low - there's more than one rejection - in total 3 the move away was drastic for the level is obvious and 5 it is recent meaning it was respected in a recent time period now you have all your key
levels John in now let's continue building on what we just learned so another question we always get asked is how do you know when to draw in lines or zones so here is the dollar yen along the top you should be able to spot this key level of resistance here now the concept we're about to show you also helped solve another debate that most traders have which is do you draw in lines at the candle closes or do you draw your lines in through the candle wicks so there are three ways to draw in your
lines for this top level here so the first way would be to draw in a single solid line which works well when you can get all the reversal points touching the line the second way would be to draw in multiple lines to accommodate for all the candle closes so you have this candle close here one line can a closed another line Kendyl close another line Kendall close another line and so forth now the problem with this method is that it is messy which can end up confusing you as a trader and is also why we
always want to keep our charts as clean as possible so this brings us to our preferred method which is drawing in zones like this this way it accommodates for the entire area encompassing both candle closes and wicks now here's the most important point and make sure you remember this it doesn't matter whether you draw in lines or zones either one works because you still treat these lines in zones of support and resistance as areas meaning you are looking for price action to occur in the general area not at a solid number line or zone so
moving on down we spot this level here and we draw in a zone like this now you are probably wondering why did we not accommodate for this point here so here's a protip don't draw in massive zones draw in a smaller zone that accommodates for the most amount of touches and points because let's say you were to draw this big zone here to accommodate for this low here one it looks terrible and two you'll end up confusing yourself with such a large area as it gets even worse once you start using multiple time frames so
instead we opt to create a smaller level that accommodates the most levels that it can touch and then this point here would be deemed a false breakout we will dive deeper into false breakouts in another video but the name is self-explanatory because you see this big momentum candle that breaks through support and assume that it will continue lower but it ends up reversing drastically in faking out all the short sellers hence why you see such a big candle that followed the breakout candle now we use timeframe confluence to get around false breakouts but that is
something we will discuss in another video and finally at the very bottom you have your swing low and we just draw in the line so as you can see you have a nice clean chart with your key levels not a hundred lines again there are other minor levels in between the levels we have drawn but for the sake of this video we're keeping it simple so let's jump to one more example here's the cab yen we had a swing high level up top here and you can draw in two lines to accommodate for the candle
closes again we prefer drawing zones so we would do it like this moving on down you have this next level here and again you've draw in lines like this or again create a zone like this next you spot these rejections here again we choose the zone and finally at the bottom so if you enjoyed the video and want us to continue to make more videos week after week make sure to hit the thumbs up button and also in the comment section let us know your thoughts and tell us what kind of topics you want us
to cover and we'll work our best to create more videos for you also if you want more free videos and content head on over to our website and wise trade comm to get access for free so thanks for watching and I'll see you in the next episode [Music] [Music]
Related Videos
10:35
Best Time Frame For Swing Trading Strategies
Wysetrade
1,048,072 views
21:34
Support And Resistance ONLY WORKS If You A...
Wysetrade
355,449 views

19:44
Support and Resistance Cheatsheet (95% Of ...
Rayner Teo
1,082,502 views

14:00
El puente NO ROMANO de Talavera de la Rein...
Isaac Moreno Gallo
91,492 views

13:50
What is Support and Resistance Levels in S...
CA Rachana Phadke Ranade
1,039,108 views

1:29:35
Music for Work — Deep Focus Mix for Progra...
Chill Music Lab
3,529,083 views

28:55
Best Trend Lines Trading Strategy (Advanced)
Wysetrade
4,857,437 views

22:49
La Hija de Gene Hackman Condenada Tras Rev...
Explration Lite
139,999 views

39:19
Support And Resistance Didn't Work Till I ...
Rayner Teo
2,109,789 views

29:40
Support and Resistance Secrets: Powerful S...
Rayner Teo
3,381,269 views
23:16
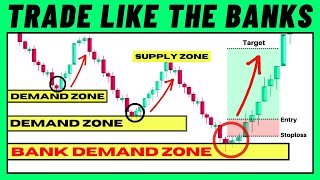
Supply & Demand Trading Strategy Banks Don...
Wysetrade
372,140 views

1:41:30
The ONLY Technical Analysis Guide You'll E...
Ross Cameron - Warrior Trading
296,870 views

32:21
15 Best Price Action Strategies After 15 Y...
Wysetrade
1,820,266 views

13:18
Support and Resistance Didn't work Till I ...
Riley Coleman
657,034 views
22:57
TRADING SUPPORT AND RESISTANCE DIDN'T WORK...
LiveFree FX
188,289 views

29:02
Manipulation Candlestick Patterns Banks Us...
The Secret Mindset
344,412 views
23:19
Support & Resistance is Holding You Back (...
JeaFx
56,983 views

6:05:28
Activate 100% of Your Brain and Achieve Ev...
Relaxed Mind
5,193,167 views
36:44
Master The Support and Resistance Trading ...
The Trading Channel (The Trading Channel)
1,746,894 views

22:21
Support and Resistance
Ross Cameron - Warrior Trading
68,689 views