Wavelets: a mathematical microscope
627.43k Aufrufe5106 WörterText kopierenTeilen

Artem Kirsanov
Wavelet transform is an invaluable tool in signal processing, which has applications in a variety of...
Video-Transkript:
Real world is full of signals which are inherently noisy and irregular but which, at the same time have a certain structure. There is a whole field of signal processing dedicated to analyze them. For example, take a look at this signal right here which is a recording of electrical activity from the mouse brain.
It clearly has an interesting structure. If you blur your vision, you can see that there are these three bouts of oscillation whose amplitude first increases and then goes down and if we zoom in on one of those bouts, it becomes apparent that the picture is even more interesting because the peaks of the wave have a faster oscillation riding on top of them. But how do you characterize these phenomena mathematically?
Because if you're a scientist and your job is to analyze the data like this and describe it you can't simply look at it and say, "<i>Well, this piece looks kind of wavish. </i>" because it's not objective. It takes an enormous amount of effort.
And most of the time, the structure of data is hidden behind the noise. Instead, we need a precise mathematical operation which will look at the data through the noise and quantify the structure present in the signal. Something that could do this blurring of vision and zoom in and out of the signal to pull out the patterns.
like a kind of a mathematical microscope. In this video, we will see how to build exactly this kind of tool <i><b>called a Wavelet transform, </i></b> a very recent invention which has revolutionized the field of signal processing. Before we begin, let's introduce a fundamental concept of time frequency duality.
Let's imagine you want to communicate to your friend a list of two numbers <i>x1 and x2</i> One, and the most obvious way, is to send the values of the two numbers directly. Alternatively, you can construct two completely new numbers Y1 and Y2 which are defined to be the sum and the difference of x1 and x2 respectively. Notice that if you know the values of Y1 and Y2, can uniquely reconstruct the numbers themselves.
So messages x1 and x2 & Y1 and Y2 carry essentially the same information, because knowledge of one pair automatically gives you another. In other words, they are two alternative representations of the same data. In fact, this is a trivial case of the duality between time and frequency domains.
Namely, if we consider x1 and x2 to be two points of the signal, then we can think of Y1 as the low frequency component. Notice that it's equal to twice the average. It's the part of data that doesn't change with time.
Likewise, Y2 is a high frequency component, because it reflects the rapid difference when we go from x1 to x2. If we try to move away from just two numbers and take x to be the signal with a whole bunch of points, or even an abstract mathematical function with infinite resolution, it may be unclear how to define the differences to obtain an alternative meaningful frequency representation. Something along those lines was probably happening in the mind of a great French mathematician, <i>Joseph Fourier</i> when he was wondering whether it's possible to decompose a function into a sum of sines and cosines.
For example, take a look at this function here. How do you think which combination of sines with variable frequencies when summed would give us this graph? Well, it's certainly impossible to know it judging by the naked eye but luckily there is a mathematical operation called <i>Fourier transform</i>, which does precisely that.
And this, essentially, was the great insight by Joseph Fourier that we can take any function and decompose it into a sum of pure waves with different frequencies. Then the frequency domain will tell us the relative contributions of each frequency into comprising the function and the inverse Fourier Transform allows us to go from the frequency domain back to our original function. You can see that there are these two alternative representations of the same function.
Each function has an alter ego in the frequency domain. and depending on what you're trying to accomplish, it may be easier to work in the time domain or the frequency domain because we can always switch between the two. The major limitation of Fourier transform is that, although we access the knowledge about frequencies present in the signal, we lose all information about time.
Fourier transform essentially squishes the signal in time to find the frequency components. The Fourier transform is a function only of frequency but we don't know when certain frequencies begin and when they end. For example, think of this signal emitted by a traffic light.
At first it will be red for a while, which corresponds to an electromagnetic wave with a certain frequency in the visible spectrum. Then for a few seconds it will glow yellow, which has a slightly higher frequency, and finally, for sometime, it will be green, which is a wave with even higher frequency. Obtaining a Fourier transform of this signal will give us three peaks only telling which frequencies are present.
We can indeed see that the signal is made up of three colors red, yellow and green. Now suppose the traffic light gets broken and the order of colors gets all messed up. For example, it's yellow for two seconds, then green for 8 seconds, then again yellow for one second, and then red for 9 seconds.
If you look at the Fourier transform, you will see pretty much the same picture with the same three peaks corresponding to color frequencies. Now suppose our traffic light malfunctions and all three colors light up at the same time and persist to glow together which would be a disaster for the road. However, the Fourier transform will continue to show the same three peaks because the resulting wave is a sum of 3 colors.
Frequency components are exactly the same as before, red, yellow and green. This is why, hypothetically, if you receive hundreds of signals from traffic lights from all over the town and your job is to detect malfunctions, Fourier transform may not be a good fit because it is completely blind to time, and so you might need some other approaches to solve the problem. It's worth saying that the reason Fourier transform sacrifices information about time is not because Joseph Fourier wasn't smart enough to invent a better tool.
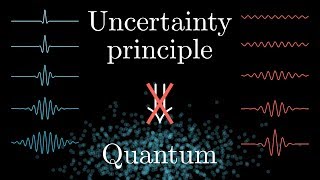
Don't blame the guy. It's actually fundamentally impossible to have both perfect time and frequency resolution simultaneously. There is always a trade-off of information between the two.
This is a manifestation of Heisenberg uncertainty principle. Time and frequency domains are two extremes of this uncertainty. You can either know exactly what a value of function is at every time point, but at the cost of being completely ignorant about what frequencies are un-faulting at that time point.
On the other end of the spectrum in the frequency domain we know exactly what frequencies are present in the signal but we have no idea about the temporal dynamics of them. But is there anything in the middle? Some magical tool which would be a compromise between the two.
What if we could sacrifice a little bit of time resolution and a little bit of frequency resolution to know something about both and what is the optimal way to find that balance? This is where wavelets come into play. When we do Fourier transform, we decompose a function into a sum of sines and cosines.
These are called analyzing functions because they form the basis for frequency representation. We are looking at our signal through the trigonometric glasses, so to speak. to view everything as a sum of signs.
But here's the thing about sine function. It's kind of the same everywhere no matter where you look. It stretches to Infinity in a regular periodic fashion, which makes it inconvenient for time series analysis, as we saw before.
But what if we modify it a little bit? We still need it to oscillate up and down because this is the foundation of frequency representation, But can we somehow restrain it in time? And this is exactly the idea behind what's called <i>wavelet transform</i>.
Its a mathematical tool which uses specialized functions called <i>wavelets</i> to analyze the signal. The key feature of wavelet is that it is short-lived lived wave like oscillation which is localized in time. In fact, just the term <i><u>wavelet</i></u> comes from French and it literally means "little wave".
I think it's an insanely cute name for a mathematical concept. But what is a wavelet, mathematically speaking? A wavelet is not just one function.
It's a whole family of functions which all satisfy certain requirements, which we'll discuss in just a moment. There is a whole zoo of wavelets. Each is tuned for specific applications, and you can even design your own wavelets tailored for specific purposes.
So when two people talk about wavelength analysis, they may not be talking about the same wavelet. Generally speaking, to be considered a proper wavelet a function <i>psi</i> of <i>t</i> has to satisfy two main constraints. First of all, it should have zero mean.
This means that if you take the integral or area under the curve where the function exceeds zero with a plus sign and areas of the curve where it dips below zero with a minus sign and add them together, you should get zero. This is known as admissibility condition and more formally, it is phrased that the wavelet function should have no zero frequency component but this zero frequency component is essentially the average value of a function. Notice that a familiar sign function also passes the admissibility condition because the combined area of positive peaks is equal to the area of negative troughs.
So the average value of a sign is zero. This is where the second condition comes into play. The wavelet function has to have finite energy.
And if you're wondering what on earth even is an energy of a function, don't worry! It's not as scary as it sounds. Essentially, this condition says that if you square the function and compute the area under the curve everywhere from minus Infinity to plus Infinity, it should be a finite number.
And this is exactly what makes the function localized in time. This squared sign is this infinite pattern, which is above zero everywhere. So the energy of the sine wave is infinite.
In contrast, our wavelet <i>psi</i> of <i>t</i>, which is localized in time when squared, covers a finite area. I should mention that the wavelet I've been using for demonstrations so far is called a <i><u>Morlet wavelet</i></u>, and it's widely used for time series analysis. It is defined as taking the cosine wave of a certain frequency and dampening it by multiplying on a Gaussian bell curve, or at least this is the real component of Morlet wavelet, because wavelet itself is a complex function but we'll get to complex numbers and imaginary component a bit later in the video.
For now, you can think of this damped cosine as (almost) Morlet wavelet. Great, so we have defined our little wave but we can't really do anything with it. So let's see what the wavelet transform is all about.
When we compute Fourier transform, we turn our time domain representation <i>y of t</i> which is one dimensional. To a frequency domain representation y hat(^) of f, which is also one dimensional. Essentially, there is only one knob which we can turn, so to speak, and that's the frequency of the sine wave <i>f of k</i> and at every value of <i>f sub k</i> (f of k) the contribution of the resulting wave of this frequency is computed and that value is represented as y hat(^) of <i>f sub k.
</i>. The key difference of wavelet transform is that our same one-dimensional function would be now represented as a two dimensional surface where one axis represents frequency just like in the case of Fourier and the other axis represents time. Hence the value of our new two-dimensional function at a point t, f represents the contribution of frequency component <i>'f'</i> at time t.
But how do we achieve it? Well, this time we're going to need two knobs, one for frequency and one for time. Turning each of them will modify our initial wavelet function <i>psi of t</i> which we call the mother wavelet to obtain new, slightly modified versions of the mother wavelet called daughter wavelets.
Namely, by turning the time knob, we translate or move the mother wavelet along the time axis back and forth. So when the value of the time knob is equal to b, the daughter wavelet is just <i>psi of t-b</i>. Turning the frequency knob allows us to shrink or stretch the mother wavelet along the time axis.
Usually it's convenient to think in terms of scales rather than frequencies, but they can easily be converted between each other. If the scale is equal to A, then the daughter wavelet is just <i>psi of t of a</i>. For example, if you stretch the wavelet by a factor of two, it's frequency will become two times smaller because the number of cycles per second is now twice as small, and likewise, shrinking the wavelet increases its frequency.
We can now combine two modifications of the mother wavelet. Let's define this scaled and translated wavelet as this. Then the value of our wavelet transform transform at a particular scale a and time b would be equal to the contribution of that scaled and translated wavelet to our signal.
But what do we mean by the contribution? Let's unpack that a little bit. Essentially, you can think of this contribution as the goodness of fit.
A measure (of) how well our modified wavelet matches the signal around that time point. Here are two examples. You can visually see that when the wavelet and the signal have similar frequencies, they kind of match.
Alternatively, when the frequencies of the wavelet and the frequencies of the signal are different, the wavelet doesn't align with the signal very well. Mathematically, we can describe this as follows. Let's first find where our signal and the wavelet match in science.
Namely, we are going to use green color to represent areas of the wavelet where it has the same sign as the signal. Either they're both bigger than zero or both less than zero, and red color will depict where the signal and wavelet have opposite signs. Let's now multiply the wavelet function by the signal.
Notice that all red areas will now turn into downward facing peaks because of the sign difference, and green regions will all be facing upwards because when you multiply either two positive or two negative numbers, you get something that's bigger than zero. This way the shape of the wavelength gets distorted and the heights of the green and red areas gets scaled by the value of the signal. As the final step after multiplication, we find the total signed area of the product.
This means that the area of green regions will be considered positive and the area of red regions will be considered negative and the total area of green minus red is the answer to the question of how much a dural wavelet contributes to the signal, because areas shaded green reflect a good local similarity between the two, while red reflects where the wavelet doesn't really match up with the signal. By the way, notice that what we did here was to multiply 2 functions and compute the integral of the product, while the integral is essentially the sum of infinitely many narrow rectangles with the height equal to the result of multiplication at that time point. Do you recognize this operation of doing a bunch of pairwise multiplications and then summing everything together?
Let's move away from functions for now and consider a pair of two-dimensional vectors. Each vector is essentially a list of two numbers x & y specifying coordinates. You may remember from high school that for two vectors we can compute what's known as their dot product.
It's a number which is equal to the product of length of the vectors and the cosine of the angle between them. Intuitively, dot product can be thought of as a measure of similarity between the vectors. If we give our vectors personalities, then dot product relates to their relationship, sort of how close they are.
When they point roughly in the same direction the angle is small and the cosine is close to 1, making the dot product large and positive. This means that the vectors are similar and hence quite close when they are orthogonal. Cosine of 90° is zero, and so the dot product is also zero.
This means that the vectors are independent and have nothing in common. They don't even acknowledge each other's existence when they point in more or less opposite directions. The angle is greater than 90°, the cosine is negative.
Hence, the dot product is also negative. the vectors are sort of anti-correlated and opposite. Importantly, the dot product, which again is just one number, can be calculated from coordinates.
The formula for such a quantity is surprisingly simple. You just multiply corresponding coordinates of the two vectors and sum everything. So for a pair of two-dimensional vectors, you multiply the x's, multiply the y's and add the two numbers.
For vectors in three dimensions, you would need to throw a product of z coordinates into the sum. Increasing the number of dimensions surely makes it difficult to visualise what an angle between the vectors would be but the intuitive meaning of it is the degree of similarity and the formula would remain the same. In the most extreme case, a mathematical function which has an infinite number of points can be considered a vector in an infinite number of dimensions.
So if we replace the sum with an integral, which is the limiting case of summation we can define a dot product between the two functions as the integral of their multiplication. we can define a dot product between the two functions as the integral of their multiplication. That definition by itself can certainly seem alien and intimidating, but when you realise that it's essentially exactly the same as the dot product between the vectors, it makes the formula much less daunting and more intuitive.
So what we computed back then is exactly the dot product between the signal and the wavelet. And remembering the geometric intuition of a dot product, it makes a perfect sense how this quantity reflects the similarity between the signal and the wavelet, how good they match each other. So far, we have only calculated the contribution of a particular wavelet configuration with fixed parameters <i>a</i> and <i>b</i>.
In other words, we have successfully found one value of our two-dimensional function. Let's keep the frequency fixed and gradually turn the time knob to vary the <i>b</i> parameter. As you can see, this kind of slides the wavelet across the signal.
For every value of <i>b</i>, we are going to repeat the described procedure of computing the dot product. Let's see what happens here. Here, i am taking the signal to be the sine wave with increasing frequency.
At the beginning, when the signal has a much lower frequency than the wavelet you can see that the weight of positive and negative contributions is more or less equal and the dot product stays near zero. But as we slide the wavelet to the right, the signal frequency increases and approaches the wavelet intrinsic frequency. When this happens, the functions begin to kind of resonate and you get a significant overall positive contributions when they are in phase and significant negative overall contributions when they are out of phase.
This is why the dot product at that time wobbles around 0 and amplitude of this is highest when the frequencies of the wavelet and the signal match exactly. But as we move the wavelet further to the right it falls out of sync with the signal because the frequencies are again different so the dot product also stays near zero. The operation we did here, the slide in dot product actually has a name.
It's known as convolution. It's very commonly used and you may have seen it in image processing, for example, when you blur the picture. We can now repeat the convolution procedure for other values of parameter <i>a</i> to pull out other frequency components.
And this is the essence of wavelet transform. By varying scaling and translation parameters we can scan our signal with analyzing wavelets of different scales to see what frequencies are most prominent around that time point. We have already seen that the result of the convolution at a fixed frequency has the shape of a short lived oscillation, because when there is a good match of frequencies.
there is a tug of war between green and red shaded regions as we slide the wavelet along. In the beginning, I told you that we want our two-dimensional function to reflect the contribution of a particular frequency at each point in time. But right now, this function doesn't really show that directly, because if the value of the convolution at a certain time point is zero, it can either mean that there is no such frequency in the signal at that time stamp, which is what we expect, but it can also equal zero, when we are exactly in the middle between peaks and troughs of the resulting oscillation of convolution values.
It doesn't mean that the frequency component right there is zero. Quite the contrary! So, since we want to measure the contribution of a frequency as a function of time to trace when this frequency component begins when it reaches its peak and when it ends, the intuition is to take something like the envelope of the resulting oscillation, right?
You see, the only reason we got this wave like oscillation as a result of the convolution is because we used only the real component of the Morelet wavelet. Now it's time for us to ditch the <i>"almost"</i> and see what the actual Morelet wavelet is. But to do so, let's briefly talk about the complex numbers which are not really as complex as they sound.
You can think of the complex numbers as the extension of a real number line. We are expanding numbers to allow them to lie not only on the one-dimensional line but on a two-dimensional plane. This extension is done by introducing a special kind of number called imaginary unit or <i><b>i</i></b> which is equal to the square root of -1.
Complex numbers consist of two parts. They have a real component and an imaginary component. which we write as <i>z</i> equals <i>a</i> plus <i>b</i> times <i>i</i>.
If we used X-axis to display the value of the real component and Y axis to display imaginary component, we can think of any number as a point on the plane. You might ask, OK, why not just use the vector or a list of two numbers <i>x</i> and <i>y</i> for this purpose? You certainly can, but the great advantage of using complex numbers is that it makes certain operations with this plane easier to describe.
For our topic, we'll focus on rotations. Notice that multiplying any number by <i>i</i> is exactly the same as rotating the plane 90° around the origin. One times <i>i</i> equals <i>i</i> <i>i</i> squared equals -1 by definition and so forth.
And if you want to rotate the plane by an arbitrary angle, we can use a convenient notation of complex exponentials, namely when we write <i>e</i> to the power of <i>i theta</i>. This refers to the point on the unit circle at the angle <i>theta</i> measured in radians counterclockwise and multiplying by <i>e</i> to the power of <i>i</i> times <i>theta</i> just means rotating the plane by the angle <i>theta</i>. In fact, the complex exponent is defined as this.
This is the famous Euler formula. You might see how convenient it is to use complex notation to describe circular movement. Just take the point <i>e</i> to the <i>i</i> times <i>t</i> and let <i>t </i>vary from zero to 2π.
This will result in a point rotating in a circle. By taking the real component of this complex variable, you get a cosine curve with a set frequency and imaginary component gives you the sine curve. This way, the Morelet wavelet is essentially a complex exponent, which spins around the circle with a certain constant frequency.
and whose amplitude is modulated by the Gaussian bell curve. Here is how it looks like in three dimensions, along with the two projections corresponding to real and imaginary components. You can see that our familiar shape of the damped cosine we used as a mother wavelet is indeed the real component of the complex Morelet wavelet and imaginary component looks like the damped sine curve, which is slightly shifted relative to the cosine.
The key idea is to calculate the convolution of the signal with both real and imaginary parts. Then our convolution function, for a fixed wavelet scale will map one real number, the translation parameter <i>b</i> to the point in the complex plane where the real component is the value of convolution at that time point with the real part of the wavelet. And imaginary component is the value of convolution with the imaginary part of the wavelet.
The power of a frequency, the intensity of its contribution at each point in time is given by the distance from the resulting point to the origin, which is also known as the absolute value of the complex number. As you can see, taking the two-dimensional function to be the absolute value of the convolution with a complex daughter wavelet that's exactly what we said. It measures the power of a particular frequency component as a function of time.
And just like before, varying the parameter <i>A</i> allows us to analyze this signal at different scales kind of like a copying machine scans the paper row by row. The resulting function is the complex function, the absolute value of which represents the contribution of a particular frequency around a certain time point. We can represent it with color, obtaining what's known as the <i>wavelet scalogram</i>.
For example, let's see the result of the wavelet transform for a sine curve with increasing frequency from zero up to 30 Hertz. Plotting the resulting wavelet surface instantly tells us the expected dynamics. There is a gradual increase in frequency as time goes on, and the amplitude is pretty much constant.
And remember the example with malfunctioning traffic lights? By considering the temporal dynamics of frequency components something that Fourier transform was lacking, we can detect abnormalities instantly. Returning back to our brain signal, we can see how wavelet transform can help us discover its structure.
There are three distinct bouts of low frequency rhythm with a gradual decrease in frequency, and we can easily quantify the duration and frequency of each of those patterns. Additionally, each of them is associated with several bouts of higher frequency rhythm, and their frequency follows the bell shape. Again, we can objectively quantify all sorts of parameters such as their frequency values, durations, the rise and decay of the frequency modulation, and so on.
The possibilities are endless. There is one important thing left to do. Remember we talked about the inherent trade-off between time and frequency resolution that you can't perfectly know both.
Well, doesn't wavelet transform violate the uncertainty principle? If you look closely at the wavelet scalogram, you will see that even for a signal consisting of a pure wave, the resulting image does not look as an infinitely narrow bar as it would be for a Fourier transform. Instead, it looks kind of blurred.
That's because we'll lose resolution in both time and frequency to know something about both. We can represent this trade-off as what's known as <u>Heisenberg boxes</u>, named after a famous physicist who formulated the uncertainty principle. In the time frequency plane, we will draw boxes, side lengths of which will be proportional to the spread of values or our degree of uncertainty about either time or frequency.
For example, in the case of raw time series, we have an infinite resolution in the time domain. What we are completely ignorant about the frequency. So the uncertainty boxes would be pretty much vertical bars, really narrow and tall.
Fourier transform, on the contrary, has a perfect frequency resolution but bears no information about time and the uncertainty boxes will look like horizontal bars. Wavelet transform, on the other hand, offers an optimal compromise between the extremes. It is designed in such a way that for low frequencies, uncertainty boxes are really wide and short.
However, for higher frequencies, Heisenberg boxes are tall and narrow. If you think about it, it makes perfect sense because usually, low frequencies like 1 Hertz tend to lose for a long time, So the high time resolution is not important, but the frequency value, whether it's one Hertz or two Hertz, can make a huge difference. Alternatively, higher frequencies are often very brief and localized in time, so we need a high time resolution while we can compromise on knowing the exact frequency value whether it's 100 Hertz or 105 Hertz.
while we can compromise on knowing the exact frequency value whether it's 100 Hertz or 105 Hertz. This is the intuitive explanation of how wavelet transform solves the time frequency trade off. Let's recap.
In this video, we have seen how to build a type of a mathematical microscope, the wavelet transform. This is a tool which allows us to interrogate a signal at different scales and uncover its structure by considering both frequency and time components. Wavelet transform has proven to be an invaluable tool for time series analysis in many fields, including fluid dynamics, engineering, neuroscience, medicine and astronomy.
Hopefully, next time you see a picture like this somewhere, it would be less mysterious. If you liked the video, share it with a friend, subscribe to the channel if you haven't already, and press the like button. Stay tuned for more interesting stuff coming up.
Goodbye and thank you for the interest in knowledge.
Ähnliche Videos

26:24
The Key Equation Behind Probability
Artem Kirsanov
80,598 views

26:54
How Your Brain Organizes Information
Artem Kirsanov
561,089 views

14:48
The Fourier Series and Fourier Transform D...
Up and Atom
812,210 views

40:08
The Most Important Algorithm in Machine Le...
Artem Kirsanov
415,038 views

27:46
Building Blocks of Memory in the Brain
Artem Kirsanov
242,218 views
19:21
The more general uncertainty principle, re...
3Blue1Brown
2,029,485 views

46:43
Stéphane Mallat: A Wavelet Zoom to Analyze...
The Abel Prize
20,000 views

17:27
Logarithmic nature of the brain 💡
Artem Kirsanov
226,108 views

15:12
Wavelets and Multiresolution Analysis
Steve Brunton
140,024 views

23:45
The applications of eigenvectors and eigen...
Zach Star
1,109,781 views
2:13:22
Cumrun Vafa: String Theory | Lex Fridman P...
Lex Fridman
408,962 views

33:04
The Grandfather Of Generative Models
Artem Kirsanov
61,883 views

31:17
What Gear Shape Meshes With a Square?
Morphocular
534,668 views
14:48
The Big Misconception About Electricity
Veritasium
22,935,866 views
13:00
How AI Discovered a Faster Matrix Multipli...
Quanta Magazine
1,468,694 views

28:23
The Fast Fourier Transform (FFT): Most Ing...
Reducible
1,894,335 views

23:17
Neural manifolds - The Geometry of Behaviour
Artem Kirsanov
271,502 views

51:46
Time Frequency Analysis & Wavelets
Nathan Kutz
89,943 views

16:57
Light Can Go Backwards Through Time, And T...
Astrum
1,876,504 views
23:05
Attosecond Lasers (2023 Nobel Prize in Phy...
Sixty Symbols
433,923 views