The Trading Strategy That Made Him $153 Million
543.87k views2393 WordsCopy TextShare
TradingLab
This is a BIG one. In this episode, we reveal takashi kotegawa's strategy that made him $153 million...
Video Transcript:
This is is Takeshi kotegawa Kote. . a.
ga. . wa.
I think that s how you pronounce it. He is one of the most famous intra day traders on the stock market who made millions of dollars in the early 2000 s. To be specific he traded from just $13,000 to 153 million dollars.
Yes, you heard me right. 153 million. Which if you do the math, is a 11,700% gain.
And what s even crazier, he did all of this in the span of just 8 years. That s fn insane. How did he find the stocks to enter in?
Did he use specific indicators? What strategy did he use? Well I scavenged the internet for days looking for those answers.
Days. Annnnnnd I found some secret site releasing his exact strategy. And I gotta say, its pretty smart.
Since im the awesome youtuber I am, Im gonna share it with you. For absolutely free. Let s get straight to it.
Now I recently released a video, like this, about Larry Williams (who is also a professional trader) and I went over how he made his millions in trading as well. And you guys loved it. I think im gonna make this whole go over million dollar traders strategies video a series.
Because, I think that s one of the easiest ways to become successful at trading, is by learning from people who actually were successful at it. Makes sense. So im kinda excited about this.
I think we can learn a lotfrom videos like this. So to understand Takeshi s strategy, we first have to understand what type of trader he was. Takeshi had specific conditions he was looking for when trying to find stocks to enter in.
He was mainly looking for stocks that were in a long term down trend and his goal was to try to find the bottom of that downtrend, to then profit from a short term reversal. Now as you may know, finding the bottom of a trend is a lot easier said than done. Actually, its pretty hard.
But with the help of his secret strategy, its raises the odds a ton of you finding the exact reversal point. So knowing that Takeshi liked downtrends, he really liked bear markets. As he stated in a an interview, bear markets present the most opportunities.
But he also traded in bull markets as well, he just fine tuned his strategy to whatever the current market sentiment was. Which we ll go over how to do that in a little bit. But he mainly preferred bear markets.
Now in the articles I read, Takeshi on average, was in his trades for around 2-6 days. But often times, he would hold his position for a week or two depending on the conditions of the market and how volatile it was. But what conditions was he specially looking for?
Well Takeshi actually said this in a interview himself In the bear market of 2001 and 2002, I would only look at stocks at least 20% below the 25 day moving average. 35% being a somewhat safe level to buy at. The price would then surge at which point I d close the position at a profit.
And he says this cycle would continuously repeat the process where he would then repeat the strategy. But he also said there is a slight problem with this whole concept. Not all stocks are going to react the same.
And the sensitivity of the rebound levels greatly depend on multiple factors like market sentiment and the sector your trading in. For example a stock is way less likely to bounce at a key level if that day the market is insanely red and everything is dropping. It also depends on the sector.
For example, stocks in the tech and biotech sectors are much more volatile than say Stocks in the utilities sector which are a lot less volatile and don t move as much So he said a big part of his strategy was finding the right moving average threshold for specific conditions. For example, you would have a bigger gap on tech companies and a smaller gap on utility companies. So with this strategy, there is not a one size fits all .
There requires a bit of judgment from the trader. To help you out a bit, I did some research of my own and ranked the most volatile sectors to the least volatile sectors. Consumer and tech being the most volatile.
And materials and energy being the least volatile. So just keep that in mind when using this strategy. So now that we all of the conditions for using this strategy, let s move onto how to find the stocks themselves But first Let me show you a site called, hankotrade ever heard of it.
They are forex and crypto broker that have extremely low spreads and low commissions. Some of the best on the market. Which, who doesn t like saving money on commissions.
They also have an extremely friendly support team. Who will answer any type of question you have. And the best part.
They are running a special promo where if you sign up with the link in my description. They will match whatever you first deposit. So if you put in $100 they will match that and give you $100.
Sign up with my link and make use of that special promo. It s free money. Alright, so how do we find the stocks themselves.
Now Takeshi didn t really explain this part, but I myself found a great way to do this. We re going to need to go on tradingview. I ll leave a link in my description.
We are going to be using tradingviews stock screener. I think you need tradingview pro in order to use this, but if you don t have that or don t feel like paying for it there are some free scanners out there you can use instead. But we ll be using tradingview for this example.
Once your on the screener. Change the timeframe to 4hrs. Go to the settings.
Make sure we are only looking at common stock, these exchanges, price change % is below -20, price is above $1, mark current trading day, and price below the 20 ema by 20%. You can also filter out specific sectors if you want to trade stocks in a specific sector. This will give you a full list of stocks in our criteria.
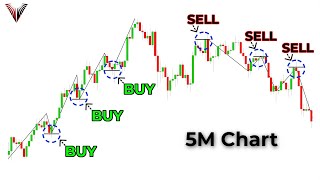
Now, Takeshi said himself, he liked stocks that were gradually downtrending. No sharp movements. So often times form this biggest losers list, you will see penny stocks that had sharp down movements like this.
We want to disregard these stocks. What we are looking for is something like this, where the move is very gradual downwards. Just go through the list and try to find stocks that are gradually moving downwards.
Next, we need to figure out the market sentiment. There are multiple ways to do this. But the way I personally do it, is by using my private indicator, tradinglab.
ai To do this, open the private indicator. I will also leave a link to that in the description. Now we want the market sentiment of the whole stock market.
Not just the stock we are trading. An easy way to do this is by looking at the snp500. To do this go to mt5, type in us500.
We then want to get a current long term read on the market. So go to the timeframes, and it make it a higher timeframe like the 4 hour. Once you have done that, check the trend table.
It will instantly tell you how the current market is trending. If its green and says strong long, the market is uptrending. If it s red, its downtrending.
Remember all of this for later, because we will be using it to optimize the strategy. It s even better if you get the specific sector the stock you re looking at. For example, if you are looking at a company like google.
Which is in the tech sector. We would want to see the market sentiment of that specific sector. To do this, just find a tech sector fund.
Like xlk. Which is measuring only the tech stocks. You then would do the same exact same thing we just did, but with just xlk.
Check the table and see how its currently trending. So that s how you can find the stocks to trade, but whats the actually itself. Go back to tradingview.
So we now have the stock we re looking at. Its it a gradual down trend and we know that stock s sector specific sentiment. We know want to add some indicators to the chart.
Go to the indicators tab, and type in ema. Now, takeshai used very specific settings. So go to the settings of the ema and change the length to 25.
Next, go back to the indicators tab and type in rsi and that to the chart. Then finally, we are going to add one more indicator and that is the macd. We can keep these settings at default.
So we now have the indicators setup. Now as said before, Takeshi was looking looking for a big gap between the current price and the ema. So we want to go to a larger timeframe like the 4 hour.
We can then measure the gap between the ema and the current price. To do this, just go to the toolbar on the left. Grab the measuring tool and mark from the ema to the price.
Now Takeshi said he would only looks at stocks with a gap bigger than 20%, and 35% being more safe. But this is when the trader s judgement starts to come into play. So say if we were looking at the trendtable from before, and it said bearish.
Meaning the current market is in a downtrend. We can start to shoot for the larger percentage gaps like 30 or 35%. But if the current market is bullish, we would shoot for smaller percentage gaps like 20 or 25%.
This is also when the sector thing comes into play. Same thing, if you are in a more volatile sector like tech or biotech. You would shoot for those largers gaps.
If you were in a less volatile sector like utilities, you would shoot for smaller gaps. So again, you yourself are going to have to judge what gap you are looking for based on current market conditions. So, we found a gradual downtrend, we measured the sectors, and we found a suitable gap.
We now move to the next part, which is support and resistances. Go to a larger timeframe like the 4 hour or daily. Mark out all the key levels.
You should only mark the very strong levels. By the time your done, you chart should look something like this. With very few lines only marking the major levels.
It shouldn t like this, where you have tons of levels and marking weak levels. We only want the major levels. We then wait for price to hit one of these major levels.
Now again, this part takes some judgement. If you are in a bear market, price can easily hit one of the higher levels and break right though it. So we would want to wait for some of these lower more major levels.
If we are in a bull market, price is more likely the respect these levels and we can aim for some these higher less strong levels. So again, theres some traders judgement with this strategy, but I personally think that s why it works so well. Next, We also want to look at our rsi indicator, and make sure the line is in the oversold area once price is by this support.
So now that we have are chart setup, we are going to wait for price to hit these levels and enter into a trade live. Okay, so its been a couple days and price hit our level. So we re going to take a trade live.
So price hit our level and we are happy with the current conditions, we are now going to go to a lower timeframe. Takeshi himself used the 15 minute timeframe for this specific part. What we are looking for is price to start bouncing, and we want confirmation that this is happening.
So this chart you can see, right before this correction there was a big gap between the ema, and the price. We are also seeing an uptrend starting to form on the smaller timeframe, showing a bounce is starting to occur and the chart is starting to gain momentum. As some extra confirmation, we check our macd and it is also showing signs that the market is getting ready to turn bullish by this histogram turning green.
Once we get all of this confirmation on the lower timeframe, we can now enter the trade. Now, Takeshi said his takeprofit and stoploss would be dynamic depending on current market conditions. So in a bear market, we would obviously want smaller take profits.
In a bull market, we can have a slightly larger take profits. So we enter the trade right here, as its starting to retest this now made support on the lower timeframe. What I found works really well is setting your take profit at the next highest resistance we marked on the higher timeframe, and set your stop loss, right below the current low.
So we re now in the trade and we can wait to see price does. A couple days past and as you can see this trade went perfectly as planned and price bounced exactly where we thought it would and hit it our take profit with ease. I think this strategy works extremely well as Takeshi made his millions doing exactly this.
And I think one of the major reasons it does work so well is because it goes off current market conditions. Not just a one size fits all strategy like most trading strategies are on youtube. Try it out, dm on Instagram and share it with me how its working for you.
Thanks for watching and ill see you guys next time.
Related Videos

15:55
How a Mathematician Became the Greatest Tr...
Newsthink
1,463,512 views
8:29
The Strategy That Made Him $1.1 Million In...
TradingLab
959,460 views

19:58
I Gave an Ai Bot $30,000 to Trade Stocks
TradingLab
3,406,954 views
11:20
Investing for Beginners - How I Make Milli...
Mark Tilbury
2,323,018 views

3:05:03
27 Years of Trading Knowledge in 3hrs and ...
Ross Cameron - Warrior Trading
255,035 views

29:03
The Most Hated Shop In The UK...
Hannah Ricketts
148,837 views

1:03:10
He made 40 million breaking all trading rules
B The Trader
568,061 views

26:57
Day Trading Legend: BNF - The God of Japan...
Billionaire Bears
3,484,268 views

13:23
Peter Lynch: How to Invest When Stock Pric...
Investor Center
838,230 views

1:18:50
I Found The Easiest Scalping Strategy - $2...
Riley Coleman
342,318 views

22:59
The BEST Candlestick Pattern Guide You'll ...
Data Trader
259,144 views
6:52
How I Made $70,536 Day Trading in 60 Days
TradingLab
130,403 views

21:49
Convert TradingView Indicators into Strate...
Michael Automates
685,976 views
45:00
The Only Day Trading Strategy You Will Eve...
The Trading Channel (The Trading Channel)
5,256,607 views

48:15
Reading Candlestick Charts Was HARD Until ...
Ross Cameron - Warrior Trading
885,185 views
16:33
After 5 Years of Trading, This Strategy Is...
Riley Coleman
106,374 views
8:45
How To Grow A Small Stock Account
TradingLab
945,945 views

1:10:19
Ultimate Beginner's Guide to Investing in ...
Brian Jung
1,845,885 views

7:48
The Trading Strategy That Made Him $82 Mil...
TradingLab
117,922 views
16:04
What Do Hedge Funds Think of Technical Ana...
TradingLab
1,374,323 views