The Ultimate Relative Strength Index (RSI) Trading Strategy
54.89k views5023 WordsCopy TextShare
Ross Cameron - Warrior Trading
DOWNLOAD MY 112 PAGE CHART PATTERN STUDY GUIDE PDF HERE: 🍏 https://warrior.app/chart-pattern-study-...
Video Transcript:
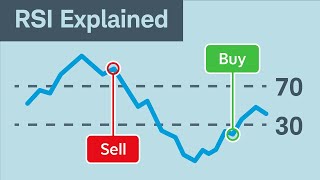
[Music] in today's episode we're going to talk about the relative strength index and how you can use RSI in your trade to help you get better at predicting reversals this is a well-established trading strategy that can help increase your accuracy by only trading reversals when you see both the Candlestick pattern and the RSI align this is where an indicator is helping confirm or deny what you think is going to happen now I'm going to take it a step further and introduce using the combination of RSI and Binger bands on reversals so let's go ahead and jump into the chart here what we're looking at initially is a Candlestick chart for a stock that I happened to trade um just a few days ago now you can apply this uh strategy and these indicators I'm going to share with you whether you're trading stocks like I am or you're trading Futures Forex cryptocurrency it doesn't matter because this is Again part of the universal language of the financial markets so what we have here on my chart initially are very few indicators this is a five minute time frame on the left and this is a one minute time frame on the right these are both for the same stock and this is something that I very commonly do when I'm trading I have the five minutes so I can kind of be zoomed out and then I have the one minute so I can be really zoomed in on the current candle the indicators that I have on here include the nine moving average right here in Gray exponential the 20 exponential moving average and the 200 exponential moving average you'll see those on both time frames the orange line is the volume weighted average price down below we have volume bars on the one minute we have the Mac D and on both time frames down below you can see RSI so let's go ahead and double click RSI and look at it RSI is plotted with this purple line and it has an upper limit a middle limit and lower limit now the upper limit is at 70 the lower limit is at 30 and the middle is at 50 the 50% Mark now RSI is an oscillator which means it oscillates between a range of 100 on the top and zero on the low although it is um at times possible you'll see something go above and below it's it's pretty rare So 99% of the time RSI is going between 0 and 100 if the relative strength is 100 on the one hand you have something that is incredibly strong but on the other hand it can't get really any stronger and so what that means is that more likely than not at some point pretty soon we're going to see a correction and if we're all the way up at 100 a correction even down to just the midpoint of 50% here would be a a very sizable correction most likely in price uh inversely if the RSI was way down here at zero or one that tells us that the price has been incredibly weak and could remain weak for a bit longer especially if there's bad news but when it reverses it again has lots of room to reverse back up and that's when we can see a big swing in price so if we focus on using this to time reversals the areas that we're going to be interested is when we're near extremes and so that's why we have these limits at 30 and at 70 so above 70 or below 30 is when we're going to be at more extreme ranges and we really only want to consider reversals in these areas so if the RSI just for instance is kind of oscillating like this this is not in in the pink here or purple this is not an extreme enough range and most likely trying to time reversals here we're not going to get enough volatility to make profit as you probably already know as an active Trader we volatility but of course we need to manage risk and our job is to try to make an accurate prediction about what the price is going to do next so we don't want to get in and just have very small moves we'll lose money on the spread and on slippage we need to see sizable moves and so only focusing on trading reversals when the RSI is up at these extreme levels can help with that strategy however we can also use this when we're trading momentum so uh in terms of the these um indicators both on the one minute and the time and the 5 minute time frames I have them set the exact same way so this is a 14 length period using the SMA 14 period here and the style has um just these upper lower uh limits and then the one in the middle this is the standard RSI setting that most Traders will use and is default when you add RSI to your charts I'm a big fan of using indicators in their default setting because I want to make sure that I'm viewing the market in more or less the same way that 90% of other active Traders are viewing it the reason is the signals when they're seen by more people will be sort of responded to accordingly so if everyone's seeing a red light then everyone's going to stop if everyone's seeing a green light everyone's going to go more more or less so being one of the first to see the red light or green light or predict it will come with intuition and that is the result of experience but ultimately I want to use standard indicator settings and I'm using the same thing on my macdon um on the the one minute here now I'm primarily personally a One Minute Trader so I usually am using my indicators on the one minute chart more closely than on the 5 minute but if you're primarily a 5-minute Trader or a 15-minute Trader or a daily Trader you want to use your indicators on that time frame okay so we're going to start by looking at this momentum stock so this is a stock that went up 100% in just a few hours this is really some impressive price action so if we look at this on both the one minute and the 5 minute I'll zoom out the one minute just a little bit more let's take note of things that we see on the RSI especially so first the move begins here after hours and as the stock squeezes from 4 to 450 up to 5 you notice that the RSI goes all the way up here to a peak of let's see it's just about 87 it really gets super extended right up here uh 83 sorry goes up to 83 so we're certainly well above our uh upper limit however we know that we only stay at these upper limits for a limited period of time and this ends up dropping back down and coming back up right here now this I find really interesting so let's actually zoom in to this um this first beginning of the move right here so some Traders might have looked at this as an opportunity to buy right up here at 550 which was this candle here you might have thought well look we've just had this big move up we've pulled back and now we're coming back up to break through this level now I I'll note a couple different things that make me think twice about this setup but focusing first on RSI we have the RSI that moved up and now the RSI is moving down which means you actually have a Divergence because the RSI is moving down here while the price moves back up whenever that happens I pay extra close attention and I take the signal from the RSI that this is more likely to be a false breakout the second indicator that is helping reaffirm that position is the fact that the macad D the moving average convergence Divergence indicator has crossed over right here at this line I usually focus on trading the front side of the move before the macd crosses over and once it crosses over I'm very hesitant to take these uh second attempts for move higher now from a um a charting perspective this is showing a double top a double top is created when you have a move higher and a pullback that's a little bigger than you would like to see this is a bigger pullback than we would like to see and it's noted by the fact that we broke below the nine moving average and we came all the way down to the 20 so it's a steeper pullback as a result of the steeper pullback the macd crosses over because the moving averages are converging macd is the moving average convergence Divergence indicator so the macd is converging moving averages are converging RSI is trending down and that's a Divergence from the price moving back higher this is a highl of being a false breakout here at this double Top This is a no trade now if you did not look at either of these indicators we'll just hide it for a second you only looked at the chart the only thing you would have to go on is the fact that this is a possible double top but we did pull up here we did sort of a little micro pullback which could almost be viewed as a cup and handle formation and clearly there was some volume here there were some people that bought into that breakout but it didn't end up working and I think the result um on this is because the pullback was a little bit too Steep and when you have a steeper pullback that's when you're going to have the macd crossover and the RSI is going to pull down and those indicators should have helped keep you out of this trade okay so then we pull back the RSI dips back down here we go to a low um of about 35 so we do come pretty low but not low enough that this would trigger a purchase based on the RSI being in the oversold territory the price then comes back up to 550 here as you can see and right in this area we now see that the RSI is stair stepping up right little pullback stair stepping up the macd has crossed back over in the positive right here so at this point right here we now have a green light this actually looks okay and acceptable for a trade right here at 550 so we back this up right here at this moment you would look at this and you might think well I don't know look it did this false breakout right here but remember right there we were getting a Divergence in the Mac in the RSI and we were having a negative macd because we had this big pullback now we've pulled back and we've had the opportunity to reset and we're starting to pull away so this is a spot right here where the macd is Check Yes and the RSI is Check Yes it's okay okay that the RSI is near the overbought area because it's trending up we're not looking for I mean so number one this is not a reversal pattern on the chart it's not extended enough to be a reversal this is a pattern that is a flat top breakout pattern for a break of resistance and so let's fast forward so what we get here is this break through 550 all the way up to 650 right here up to about uh 6 624 which is still a really nice move we then pull back just a little bit and then into the next pre-market session we push higher now this starts to get a little interesting because right here notice now we're starting to see a Divergence again and that was caused by this initial candle that dropped down now the macd dipped below for a second is back in positive but the RSI is now as it makes as the price makes a new high right here the RSI does not make a new high and that's what I pay close attention to when price is making new Highs but RSI is not we're having a Divergence that indicates more likely than not the price is not going to sustain this level now this is a spot where you could consider a reversal trade because the RSI is above and we're having this Divergence so now we get a pull back here we dip back down we start to go sideways and right here watch this the macd crosses over so now we have a macd crossover the RSI is starting to stair step back up we pull back a little bit so right now another diver well actually we're not really in a Divergence we're pretty well matched here now one thing that I'll say is I don't typically like to take trades below volume weight average price so although we have a cross over here I'm typically not going to take that trade unless the price is a little higher so we're going sideways we're going sideways and then yeah right so right here we end up getting a surge of momentum now this surge of momentum was right at 7:00 a. m. and you can see all of a sudden a ton of volume came in so that's because 7: a.
m. is when a lot of retail Brokers come online so what ends up happening is you get a a massive boost of volume price surges up and immediately the RSI goes into the over um overbought territory okay so now we hit this big peak here and this is where some people are going to start looking for a reversal RSI is extended the price is extended we don't have a Divergence but we have it right here right here we have a Divergence the price goes higher the RSI does not go higher so this is now an indicator that we're still in the overbought territory this is a spot to watch for a short if the price was really strong first of all it wouldn't have pulled back as much as it did right here causing the macd to start to converge and starting to cause the RSI to dip so we get this sort of we push higher but we stall out the RSI shows it's making AOW lower high and now you get this sort of slower flat and then unwind it's just not able to push higher now in my own trading I find that using RSI to help me time entries to the long side for momentum is not particularly helpful I find macd is more than enough for my trading however when I am unal trading which is a strategy I focused on as a beginner I really liked RSI and I really liked Binger bands so now let's pull up one of the scans that I've developed here which is the RSI Trend so this RSI Trend scanner is actually actually searching the whole market for stocks that have highest and lowest rsis in the whole Market okay so what's the idea behind this scan I'm trying to search for these extremes I'm searching for these data points right here now we know that we can search for a stock that has a 99 or 100 RSI or a zero RSI if we find it we know that the stock is currently in this extreme area right here so it may be worth considering a trade now it's not a guarantee that this is going to give us an opportunity because there can be stocks that have a 100 RSI but they have no volume and they're not liquid so this stock for instance let's just look at the top one okay so this for instance has a 100 RSI all right so this is based on the 15minute it's very extended the price has just been moving higher moving higher but the volume is a little light 1. 3 million shares we may not at this current moment see an opportunity so let's go ahead and add one more indicator here we're going to add the Binger bands all right so Binger bands we're popping them on and what we're going to look for are are spots where the price price is outside the top Binger band and the RSI is extremely extended because the price being outside the Ballinger bands indicates extreme price action for those that aren't familiar with how Ballinger bands work they create a band around the current price so you can see it's sort of this channel here the blue lines the top the and the bottom so it creates this channel 99% of price action occurs within the channel at the Binger bands ever in the unusual case that the price is outside the Binger bands as it is here it almost always leads to at least a shortterm correction back within the Binger bands so let's see um we'll just we'll scan through some of these charts here um and see what we see okay so CVS is another one and you'll notice that these charts are actually um between these two were were somewhat similar which is common and more likely that this ties in with overall Market strength so when the overall Market is strong a lot of these stocks will just Trend with the market this however is is a really interesting example so look at this so if we were scanning we saw this stock and this was uh Friday going to the Clos so we had 1 2 3 four five green candles in a row one small red candle right here and then four more green candles followed by what Candlestick shape that is a shooting star okay so a shooting star candle we'll pull up the whiteb here this is a candle that is created as the price squeezes higher let me just grab my marker here so I'll do I'll do this in BR that's fine so just going to erase this so the price has been moving higher one two three four five let's just say those are long body green candles the price opens here and then it squeezes up and immediately sellers push it back down and it closes like this this is called a shooting star because shooting stars come back down and this is already showing the reversal is beginning because buyers pushed it up and then sellers pulled it right back down and it closed red because it closed at the low the next candle opens here and almost always pulls back and there we have the reversal so when I'm seeing this candle forming I'll often take my position before the candle even closes because I can see what's going to happen on the next candle just like this so in this case unfortunately this was going right into the closing bowel so there wasn't a lot of time to take this trade but nonetheless this is a a a really nice classic shooting star candle and it's a candle up outside the Binger bands so that that's really a nice one um so here's another one MAA this one strength candles are up outside the Ballinger bands but not showing a reversal candle just yet so something we would keep watching CVS we already looked at that CYCC this one okay so there you go classic big red candle high volume red that's reversal indicator candles outside the Ballinger bands RSI above um our upper limit so this candle right here is the one really confirming that we're too extended and we start to pull back all right so that was a good one candles up outside the Binger bands sometimes as a beginner Trader it can be hard to time moment momentum and you'll feel like you're just chronically chasing um now you can avoid that by learning some of these traditional Candlestick patterns that momentum Traders use for instance we have green candles getting bigger in size followed by two small red candles and then the next candle that makes a new high right here a squeeze back up let's say on this candle you saw a bottoming tail just like that we know that the bottoming tails are bullish because the buyers push it back up whereas the topping tails are bearish because the sellers pull it back down so a pattern like this is a momentum pattern that I would feel very comfortable trading but sometimes as a beginner it could be hard to kind of see this and to act in real time and some beginners like looking at um reversal charts and reversal setups because when you have a setup let's just say for instance um where you've got I don't know like 15 to 20 consecutive candles like we're getting really really really extended this is where it starts to feel like this is a no-brainer that this thing is going to reverse so this reversal scanner right here has two columns for consecutive candles so here's one that this had 14 consecutive candles all right let's match up chart okay so in 14 consecutive candles okay you see something like this with 14 consecutive candles and you're just thinking it's only a matter of time before we reverse and the first red candle likely will lead to a series of several more red candles of pullback so in this case we're outside the Ballinger bands RSI is extended you know volume is peaking so everything looks good on this except that this happened to be at 4m.
Related Videos

59:52
How to Day Trade BREAKING NEWS with a Scal...
Ross Cameron - Warrior Trading
55,292 views

16:15
+$20,802.60 on Crypto and Biotech Stocks
Ross Cameron - Warrior Trading
9,562 views
15:14
Are you using VWAP the RIGHT WAY?
Ross Cameron - Warrior Trading
271,005 views

30:02
Całe przemówienie Donalda Trumpa. Ogłosił ...
Onet
97,422 views

1:41:30
The ONLY Technical Analysis Guide You'll E...
Ross Cameron - Warrior Trading
108,490 views
21:28
RSI Indicator Secrets: Powerful Trading St...
Rayner Teo
1,033,667 views

1:03:42
Learn how to use two effective trading ind...
SMB Capital
248,458 views

21:58
How I Nailed Trading with the MACD Indicat...
Ross Cameron - Warrior Trading
568,601 views

48:15
Reading Candlestick Charts Was HARD Until ...
Ross Cameron - Warrior Trading
1,030,720 views
44:00
Best RSI Indicator Trading Strategy - Wyse...
Wysetrade
2,903,128 views
4:22
How to Use the Relative Strength Index (RSI)
Charles Schwab
236,663 views

21:05
Donald Trump Launches TRUMP Coin 📈
Ross Cameron - Warrior Trading
53,631 views

29:17
Trading was HARD Until I Learned this BASE...
Ross Cameron - Warrior Trading
41,870 views

9:06
Beginner Guide to the RSI Indicator
Trading 212
1,813,694 views
1:37:30
Ultimate Guide on ADDING to Winners with S...
Ross Cameron - Warrior Trading
220,433 views
19:08
You are Using the RSI Indicator WRONG! (RS...
Bybit Learn Official
996,169 views
18:44
The Ultimate Short Selling Guide - Everyth...
Ross Cameron - Warrior Trading
27,432 views

54:56
How to Read Candlestick Patterns (Step-by-...
Ross Cameron - Warrior Trading
501,562 views

3:06:12
The Ultimate Day Trading Guide for 2025 (F...
Ross Cameron - Warrior Trading
174,009 views

1:24:48
My Bear Market 🐻 Day Trading Strategy
Ross Cameron - Warrior Trading
160,984 views