Control Charts simply explained - Statistical process control - Xbar-R Chart, I-MR Chart,...
5.28k views1581 WordsCopy TextShare
DATAtab
In this video, we delve into the fundamentals of Control Charts, a vital tool in quality control and...
Video Transcript:
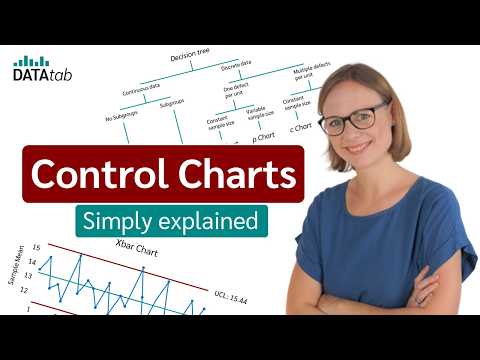
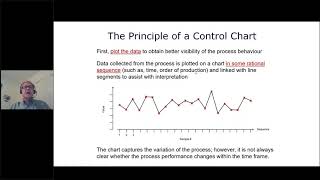
this video is about control charts first we discuss what control charts are and why you need them then we are going to explore the different types of control charts so what are control charts control charts are a type of statistical process control tool used to Monitor and control processes by tracking the performance of key variables over time they help identify Trends shift or any unusual patterns that might indicate a problem with the process therefore control charts give important information about the stability of the respective process depending on the format in which the data is available
different types of control charts will be used to find out which one is right for you you can use this decision tree we will go through this decision Tree in more detail later don't worry it's not complicated but what are control charts used for to understand this let's first look at an example of an xar R chart let's say we work in quality management at a fulfillment center in a fulfillment center products are stored packed and shipped to customers the primary purpose of a fulfillment center is to ensure that orders are processed efficiently therefore the
stability of this process should be monitored for the this purpose the time from order receipt to shipment is measured so our objective is monitor the average processing time to ensure it stays within acceptable limits of course we need data to monitor the process to obtain data we take a random sample of five orders per day so at the first day we measure a processing time of five orders for example the processing time for the first order was 12 minutes the processing time for the second order was 14 minutes and so on and so forth similarly
we measure the processing time on the second day on the third day and so on let's say we measure the times on a total of 25 days but how do we get an expired chart with this data to do this we first calculate the mean values of the five orders from all 25 days now we can create the xar chart to do this we plot The 25 Days on the xaxis and the mean values we just calculated on the Y AIS so we have the first point the second the third and so on and so
forth now we are almost finished we only need to calculate these three lines the center line is simply the mean value of all values so we just calculate the mean value of all points the red lines are the upper and lower limits the upper control limit UCL is the threshold above the central line usually set at three deviations from the mean it indicates the upper boundary of process variation the lower control limit LCL is the threshold below the central line also set at three standard deviations from the mean it represents the lower bound rate of
process variation note there are different ways to calculate the sigma some are a more accurate approximation others are a more straightforward way to calculate it the simplest way to calculate Sigma is to calculate the standard deviation of all data in addition keep in mind that there is a difference between control limits and specification limits control limits are based based on process variability and statistical calculations whereas specification limits are defined by customer requirements or engineering tolerances now we have the so-called xar chart in most cases the xar chart is extended by the r chart R stands
for range to create the r chart we simply calculate the range of each day for example on day one the low lowest value is 12 and the highest is 15 so we get the range of three we can now plot these values 3 3 3 5 and so on until the end three if you want to calculate an xar R control chart with data tap simply copy your data into this table and click on statistical process control now you only need to select the variables below and you will get an xar R chart your data
can also be available in such a format now we know what an xar chart is but what about the other types let's start with the IMR chart the IMR chart stands for individual moving range chart but what is the difference with the xar r chart in the case of the xar r chart we have several observations at each point in time if if we do not have several observations at each point in time but only one we use an IMR chart so to create the IMR chart we simply draw the corresponding value at each point
in time since we have only one value per point in time we cannot calculate the range therefore we use a moving range in the moving range chart we calculate and plot the difference between the conse itive points such as the difference between two successive points between a first and second point for example we have a difference of one between the second and the third point we have a difference of two so we entered a point at two here to create an IMR chart with data tab copy your measured values into this table again if you
now simply click on one variable an IMR chart will be created automat ically now that we've discussed the control chart for continuous data what if we have discrete data in the control charts of the discrete data we look at the number of defects in a process here we differentiate between one defect per unit or several defects per unit we'll go through what that means in a moment in addition in both cases we differentiate between constant sample size and variable sample size let's say you work for a company that manufactures light bulbs now you want to
monitor the proportion of defective bulbs produced each day to do this you take a random sample of 10 light bulbs each day and count the number of defective light bulbs the first day two were defective on the second one on the third three and so on and so forth okay hopefully in reality there are far fewer defects and Sample should therefore be larger in this case we have one defect per unit a bulb is either defective or not and we have a constant sample size so we use an NP chart so the NP chart is
used to plot the defect counts over time to identify Trends or shifts in a defect rate on the first day for example two lamps were defective on the second day one was defective and so on now the question is what is the difference between constant sample size and variable sample size in our example with the lamps we took a constant sample size every day now we could also have a machine that randomly sorts out a lamp from time to time one day it sorts out 155 lamps the next day 180 lamps then 121 one and
so on and so forth in this case our sample would contain a different number of lamps each day and we would have a variable sample size to get the error rate we then have to divide the number of 40 lamps by the number of randomly drawn lamps so we have one def fact per unit and a variable sample size we therefore use a p chart to create a p chart we need two columns one with the samp example size and one with the number of defs found with these values we can now calculate the proportions
and plot the values what about multiple defects per unit let's say a car production plant wants to monitor the number of defects found in each car body produced to maintain high quality standards each day one car body produced is inspected and the total number of defects per car body is recorded in this case we use the C chart to draw the C chart we simply need the number of defects found per car for example four defects were found in the first car so we enter a point at four but what is an example of a
u chart there we have several defects per unit and variable sample size imagine a software development team wants to monitor the number of B Max per software release the individual releases are of course different in size one way to measure the scope is to measure the number of lines of code added so we have a column with the number of lines of code and the number of reported box this allows us to calculate the Box per line of code with this data we can now create a up plot of course you can also create a
control chats online with data step for discrete data to do this simply click on attributive now you can either select one or more effects select the measured values and then either specify a constant sample size or specify the variable with the sample size the correct control chart will then be displayed automatically below you can see a list of the control charts with instructions on how to create them thanks for watching and I hope you enjoyed the video
Related Videos
15:57
PROCESS CAPABILITY: Explaining Cp, Cpk, Pp...
CQE Academy
204,107 views

25:53
Design of Experiments (DoE) simply explained
DATAtab
43,888 views

45:17
Regression Analysis | Full Course
DATAtab
821,959 views
24:15
Introduction to Statistical Process Contro...
Cody Baldwin
27,564 views

59:59
The Macroeconomic Impact of Climate Change...
E-axes Forum on Climate Change, Macro and, Finance
61 views

3:50:19
Data Analytics for Beginners | Data Analyt...
Intellipaat
1,624,033 views
20:41
Part 1- Control Charts: X-bar chart, R-cha...
RealEngineeringExplained
12,007 views

1:19:41
Python data handling - ETL and GUI with Pl...
RocPy
46 views

20:08
Why the p-Value fell from Grace: A Deep Di...
DATAtab
132,624 views

16:04
The 7 Quality Control (QC) Tools Explained...
CQE Academy
654,510 views

14:23
Full Factorial Design (DoE - Design of Exp...
DATAtab
13,439 views

27:00
Correlation Analysis - Full Course
DATAtab
61,145 views
18:41
Attribute Data Control Chart Examples!! Ho...
CQE Academy
65,213 views
1:01:53
Statistical Process Control (SPC)
Quality Management & Training Limited
17,683 views
![One-Way ANOVA [Analysis of Variance] simply explained](https://img.youtube.com/vi/mOdYddj5IG8/mqdefault.jpg)
14:14
One-Way ANOVA [Analysis of Variance] simpl...
DATAtab
3,516 views

13:01
Types of Data in Statistics - Nominal, Ord...
DATAtab
2,118 views
11:43
Quality (Part 1: Statistical Process Control)
Infinity MFG
242,077 views
22:40
SPC I Statistical Process Control | SPC Vi...
Quality Excellence Hub
75,749 views
42:51
APA Tables & Figures for LCA
IMMERSE Training Program
50 views

20:21
What is Statistics? A Beginner's Guide to ...
DATAtab
26,653 views