Best Time Frame For Swing Trading Strategies
1.05M views1508 WordsCopy TextShare

Wysetrade
💰 EXPERT CONTENT: https://www.wysetrade.com
🛠 OUR TRADING TOOLS: http://tools.wysetrade.com/
�...
Video Transcript:
hey guys so in this video we will show you the best time frame for swing trading and for finding key support and resistance levels also make sure to hit the subscribe button and to turn on the notifications bell so that you know exactly when new content is released so from looking at the comments a question that is asked over and over again from the last video is what is the best time frame for swing trading and for identifying support and resistance levels also right now comment below on what topics you want us to cover so
that we know what you want and we'll work our best to create those videos for you so here on the Aussie Swiss daily time frame as you can recall from the last episode we've broke down how to identify support and resistance levels and as a side note our videos are designed in a linear fashion meaning this video right now failed on top of all past videos so make sure that you are all caught up so that you understand exactly what we are talking about so again here on the daily timeframe you will most likely spot
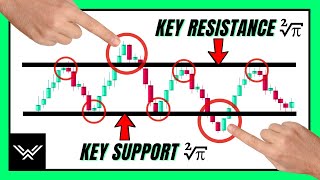
support and resistance everywhere you have a level up here you have a level here another level here another level and another level so the problem with drawing in this many lines on the chart is that you have now confused yourself and if cluttered up your chart with lines everywhere some of these levels are useful for day trading but right now our focus is on swing trading again if you can recall from the last video we want to keep our charts simple and clean so this is why we use the weekly timeframe to find our key
levels instead of drawing in all these minor daily levels so let's jump to the weekly and break this down now here in the weekly time frame notice how the support and resistance levels you drew in from the daily are not visible on the weekly so let's go ahead and remove all these daily levels so here's the key to identifying or dynamic support and resistance levels look for levels of support and resistance that are obvious and visible on the weekly timeframe notice how we have an obvious swing high up here so we draw it in next
to the right another level of resistance so we draw it in and along the bottom we have an obvious level of support and here are all your dynamic levels the reason the weekly timeframe is important is because you are seeing the big picture as each candle holds a lot more information and represents all the buying and selling that occurred throughout an entire week so this is a very key point you need to understand swing trading before you can understand day trading as you need to know what is occurring on the big picture and bigger trends
in order to understand how to trade the shorter timeframes and smaller trends so that you don't get caught now let's do this from the top down again on another pair so here's the pound yen and again starting from the weekly time frame we want to identify our key weekly levels along the top we first spot this obvious level of resistance so we draw it in next we spot this level here with multiple rejections so we draw it in along the bottom we have an obvious level here and finally another swing load down here so these
are all your key support and resistance levels meaning the obvious levels that you can spot on the weekly time frame and now we jump to the daily timeframe to further confirm these levels here in the daily you can now see more clearly where the key levels are that we drew in on the weekly and now all the other levels you can spot on the daily are minor levels so again spot your key levels on the weekly confirm the same levels on the daily and then look for price action on the daily for possible trade entries
at these levels we will dive deeper into price action entries in an upcoming video but right now focus on identifying your key levels on the weekly and using the daily for confirmation and price action entries so let's do this again on another pair here's the pound Ozzy and again starting from the weekly time frame along the top we have this obvious level here so we draw it in moving on down we have this next level here with multiple rejections so we draw it in you again we spot this level here with multiple rejections so we
draw it in you and finally along the bottom and a swing low with multiple rejections you plus we also have our trendline here that connects all the swing lows of this uptrend you now that we have all our key levels identified on the weekly let's jump to the daily timeframe to confirm these levels so here in the daily you can again see how the key levels you drew in on the weekly fall into place on the daily and leaving out all the minor levels so that you don't confuse yourself price is currently pulling back to
this key weekly support level here which is also where the trend line lines up perfectly so if we get good price action through this candle close followed by intraday confirmation there will be a possible trade entry long again we will discuss price action entries in another episode now before we continue if you're enjoying this video and want us to continue to make more videos week after week please hit the thumbs up button and also leave some comments below with your thoughts as well as what kind of videos you want to see now we're going to
show you a bonus technique through using the monthly timeframe so let's jump to that so you can also use the monthly timeframe to spot key levels as well using the monthly timeframe to identify key levels isn't a must because often since the monthly is such a large timeframe to use you won't be able to always spot levels but we're gonna show you this technique anyways so that you can use it if you choose so here in the pound Swiss monthly timeframe we often find that monthly levels can hold more weight to them if used correctly
also when you jump between timeframes you'll forget where the level of support or resistance came from so to solve this we'll make the monthly support and resistance levels a certain color in this case green and then the weekly level will be a different color again starting from the top we spot this obvious level up here so we draw it in next we spot this over here so we draw it in you moving on down another level with multiple rejections so we draw it in and then the swing low with multiple rejections so another level you
so here we have all the monthly levels drawn in and we jump to the weekly to further confirm these levels now here in the weekly time frame you can see how the monthly levels fit in we also have this weekly level here so we draw it in you notice how price recently blew right through this weekly level and tapped the monthly level and snapped right back causing this wick to form now I'm going to show you how this played out on the daily so here in the daily this was your weekly level we just identified
and this here is your monthly level price came down to this weekly level but no price action occurred and all we had was this bearish to momentum candle the blue right through price then continued down to this monthly support level which is when we finally had a reaction to the level through the wick sticking out now you can take this even a step further through using the four hour time frame to further confirm this candle so let's jump to that so here in the four hour time frame you had this decent rejection Kendyl of the
monthly support followed by an inside bar which is a reversal pattern now there were many ways you could have entered on this which we'll go through in a following video most traders use support and resistance incorrectly so if you enjoyed this video and want us to continue to make more videos make sure to hit the thumbs up button and also in the comment section let us know your thoughts and what kind of topics you want us to cover next and we'll work our best to create those videos for you so thanks for watching and I'll
see you in the next episode [Music] [Music]
Related Videos
21:34
Support And Resistance ONLY WORKS If You A...
Wysetrade
355,463 views

19:26
My Scalping Strategy is Boring, But Makes ...
Scarface Trades
337,897 views
26:12
Always Wait For THIS Before Entering Trade...
The Rumers
142,248 views

21:18
US MARINES VS CLIMBERS - Who is Stronger?
Magnus Midtbø
423,808 views

1:48:24
How to Swing Trade | Simple Strategies fro...
Richard Moglen
328,247 views

20:04
The Dumbest Drivers Ever
Daily Dose Of Internet
2,157,783 views

28:55
Best Trend Lines Trading Strategy (Advanced)
Wysetrade
4,857,437 views

34:09
Retired outdoors woman makes seven figures...
B The Trader
173,282 views

21:58
How I Nailed Trading with the MACD Indicat...
Ross Cameron - Warrior Trading
697,168 views
35:32
Swing Trading Crash Course 2025 (For Begin...
Humbled Trader
240,935 views

12:36
Advanced Technical Analysis (FALSE BREAKOU...
Wysetrade
492,064 views
7:38
What is the Best Timeframe for Swing Trading?
TRADEPRO Academy
37,654 views

16:55
🔴 The MOTHER of All Indicators (Dangerous...
Trader DNA
377,349 views

22:59
The BEST Candlestick Pattern Guide You'll ...
Data Trader
977,722 views
1:18:58
Why Weekly Charts Will Make You a Profitab...
Deepvue
26,396 views

56:06
Swing Trading for Beginners w/ Jerry Robin...
Chat With Traders
292,923 views

14:55
Best Moving Average Trading Strategy (MUST...
Wysetrade
3,310,922 views

47:27
Trading Psychology: How to Handle FOMO (Dr...
SMB Capital
538,831 views

29:47
The Ultimate Guide to Swing Trading for Be...
Humbled Trader
183,699 views

19:21
The ONLY Price Action Trading Strategy You...
Wysetrade
465,055 views