Support Vector Machines Part 1 (of 3): Main Ideas!!!
1.47M views2419 WordsCopy TextShare
StatQuest with Josh Starmer
Support Vector Machines are one of the most mysterious methods in Machine Learning. This StatQuest s...
Video Transcript:
support vector machines have a lot of terminology associated with them brace yourself hello I'm Josh stormer and welcome to stat quest today we're going to talk about support vector machines and they're gonna be clearly explained note this stack quest assumes that you are already familiar with the trade-off that plagues all of machine learning the bias-variance tradeoff you should also be familiar with cross-validation if not check out the quests the links are in the description below let's start by imagining we measured the mass of a bunch of mice the red dots represent mice that are not
obese and the green dots represent mice that are obese based on these observations we can pick a threshold and when we get a new observation that has less mass than the threshold we can classify it as not obese and when we get a new observation with more mass than the threshold we can classify it as obese however what if we get a new observation here because this observation has more mass than the threshold we classify it as obese but that doesn't make sense because it is much closer to the observations that are not obese so
this threshold is pretty lame can we do better yes going back to the original training data set we can focus on the observations on the edges of each cluster and use the midpoint between them as the threshold now when a new observation falls on the left side of the threshold it will be closer to the observations that are not obese than it is to the obese observations so it makes sense to classify this new observation as not obese BAM no it's a terminology alert the shortest distance between the observations and the threshold is called the
margin since we put the threshold halfway between these two observations the distances between the observations and the threshold are the same and both reflect the margin when the threshold is halfway between the two observations the margin is as large as it can be for example if we move the threshold to the left a little bit then the distance between the threshold and the observation that is not obese would be smaller and thus the margin would be smaller than it was before and if we move the threshold to the right a little bit then the distance
between the obese observation and the threshold would get smaller and again the margin would be smaller when we use the threshold that gives us the largest margin to make classifications heads up terminology alert we are using a maximal margin classifier BAM no no BAM maximal margin classifiers seem pretty cool but what if our training data looked like this and we had an outlier observation that was classified as not obese but was much closer to the obese observations in this case the maximum margin classifier would be super close to the obese observations and really far from
the majority of the observations that are not obese now if we got this new observation we would classify it as not obese even though most of the not obese observations are much further away than the obese observations so maximum margin classifiers are super sensitive to outliers in the training data and that makes them pretty lame can we do better yes to make a threshold that is not so sensitive to outliers we must allow misclassifications for example if we put the threshold halfway between these two observations then we will miss classify this observation however now when
we get a new observation here we will classify it as obese make sense because it is closer to most of the obese observations choosing a threshold that allows misclassifications is an example of the bias-variance tradeoff that plagues all of machine learning in other words before we allowed misclassifications we picked a threshold that was very sensitive to the training data it had low bias and it performed poorly when we got new data it had high variance contrast when we picked a threshold that was less sensitive to the training data and allowed misclassifications so it had higher
bias it performed better when we got new data so it had low variance small BAM oh no it's another terminology alert when we allow misclassifications the distance between the observations and the threshold is called a soft margin so the question is how do we know that this soft margin is better than this soft margin the answer is simple we use cross-validation to determine how many misclassifications and observations to allow inside of the soft margin to get the best classification for example if cross-validation determined that this was the best soft margin then we would allow one
miss classification and two observations that are correctly classified to be within the soft margin BAM when we use a soft margin to determine the location of a threshold brace yourself we have another terminology alert then we are using a soft margin classifier aka a support vector classifier to classify observations the names support vector classifier comes from the fact that the observations on the edge and within the soft margin are called support factors super-small bam note if each observation had a mass measurement and a height measurement then the data would be two-dimensional when the data are
two-dimensional a support vector classifier is a line and in this case the soft margin is measured from these two points the blue parallel lines give us a sense of where all of the other points are in relation to the soft margin these observations are outside of the soft margin and this observation is inside the soft margin and misclassified just like before we used cross-validation to determine that allowing this miss classification results in better classification in the long run BAM now if each observation has a mass a height and an age then the data would be
three-dimensional note the axis that age is on is supposed to represent depth and these circles are larger in order to appear closer and thus younger and these circles are smaller in order to look further away and thus older when the data are three-dimensional the support vector classifier forms a plane instead of a line and we classify new observations by determining which side of the plane they are on for example if this were a new observation we would classify it as not obese since it is above the support vector classifier note if we measured mass height
age and blood pressure then the data would be in four dimensions and I don't know how to draw four dimensional graph wah-wah but we know that when the data are one-dimensional the support vector classifier is a single point on a one-dimensional number line just in mathematical jargon a point is a flat affin zero dimensional subspace and when the data are in two dimensions the support vector classifier is a one-dimensional line in a two dimensional space in mathematical jargon a line is a flat affin one-dimensional subspace and when the data are three-dimensional the support vector classifier
is a two-dimensional plane in a three-dimensional space in mathematical jargon a plane is a flat affin two dimensional subspace and when the data are in four or more dimensions the support vector classifier is a hyperplane in mathematical jargon a hyperplane is a flat Athene subspace note technically speaking all flat Athene subspaces are called hyperplanes so technically speaking this one-dimensional line is a hyperplane but we generally only use the term when we can't draw it on paper small BAM because this is just more terminology ugh support vector classifier seemed pretty cool because they can handle outliers
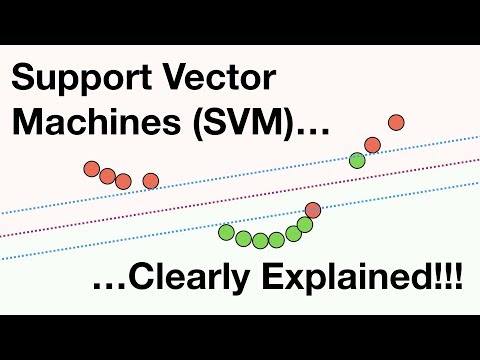
and because they can allow misclassifications they can handle overlapping classifications but what if this was our training data and we had tons of overlap in this new example with tons of overlap we are now looking at drug dosages and the red dots represent patients that were not cured and the green dots represent patients that were cured in other words the drug doesn't work if the dosage is too small or too large it only works when the dosage is just right now no matter where we put the classifier we will make a lot of misclassifications so
support vector classifier czar only semi-cool since they don't perform well with this type of data can we do better than maximal margin classifiers and support vector classifier x' yes since maximal margin classifiers and support vector classifier x' can't handle this data it's high time we talked about support vector machines so let's start by getting an intuitive sense of the main ideas behind support vector machines we start by adding a y-axis so we can draw a graph the x axis coordinates in this graph will be the dosages that we have already observed and the y axis
coordinates will be the square of the dosages so for this observation with dosage equals 0.5 on the x axis the y axis value equals dosage squared which equals 0.5 squared which equals 0.25 now we use dosage squared for this y-axis coordinate and then we use dosage squared for the y-axis coordinates for the remaining observations since each observation has X and y-axis coordinates the data are now two-dimensional and now that the data are two-dimensional we can draw a support vector classifier that separates the people who were cured from the people who were not cured and the
support vector classifier can be used to classify new observations for example if a new observation had this dosage then we could calculate the y-axis coordinate by squaring the dosage and classify the observation as not cured because it ended up on this side of the support vector classifier on the other hand if we got a new observation with this dosage then we would square the dosage and get a y-axis coordinate and classify this observation as cured because it falls on the other side of the support vector classifier BAM the main ideas behind support vector machines are
one start with data in a relatively low dimension in this example the data started in one dimension to move the data into a higher dimension in this example we move the data from one dimension to two dimensions three find a support vector classifier that separates the higher dimensional data into two groups that's all there is to it double BAM going back to the original one dimensional data you may be wondering why we decided to create y-axis coordinates with dosage squared why not dosage cubed or pi divided by four times the square root of dosage in
other words how do we decide how to transform the data in order to make the mathematics possible support vector machines use something called kernel functions to systematically find support vector classifier in higher dimensions so let me show you how a kernel function systematically finds support vector classifier in higher dimensions for this example I use the polynomial kernel which has a parameter D which stands for the degree of the polynomial when D equals 1 the polynomial kernel computes the relationships between each pair of observations in one dimension chips are used to find a support vector classifier
when D equals two we get a second dimension based on dosages squared and the polynomial kernel computes the two-dimensional relationships between each pair of observations and those relationships are used to find a support vector classifier and when we set D equal three then we would get a third dimension based on dosages cubed and the polynomial kernel computes the three-dimensional relationships between each pair of observations and those relationships are used to find a support vector classifier and when D equals four or more then we get even more dimensions to find a support vector classifier in summary
the polynomial kernel systematically increases dimensions by setting D the degree of the polynomial and the relationships between each pair of observations are used to find a support vector classifier last but not least we can find a good value for D with cross validation double bam another very commonly used kernel is the radial kernel also known as the radial basis function kernel unfortunately the radio Colonel finds support vector classifier x' in infinite dimensions so I can't give you an example of what it does exactly however when using it on a new observation like this the radio
kernel behaves like a weighted nearest neighbor model in other words the closest observations aka the nearest neighbors have a lot of influence on how we classify the new observation and observations that are further away have relatively little influence on the classification so since these observations are the closest to the new observation the radio kernel uses their classification for the new observation BAM now for the sake of completeness let me mention one last detail about kernels although the examples I've given show the data being transformed from a relatively low dimension to a relatively high dimension kernel
functions only calculate the relationships between every pair of points as if they are in the higher dimensions they don't actually do the transformation this trick calculating the high-dimensional relationships without actually transforming the data to the higher dimension is called the kernel trick the kernel trick reduces the amount of computation required for support vector machines by avoiding the math that transforms the data from low to high dimensions and it makes calculating the relationships in the infinite dimensions used by the radial kernel possible however regardless of how the relationships are calculated the concepts are the same when
we have two categories but no obvious linear classifier that separates them in a nice way support vector machines work by moving the data into a relatively high dimensional space and finding a relatively high dimensional support vector classifier that can effectively classify the observations triple bam hooray we've made it to the end of another exciting stat quest if you liked this stack quest and want to see more please subscribe and if you want to supports that quest consider contributing to my patreon campaign becoming a channel member buying one or two of my original songs or a
t-shirt or hoodie or just donate the links are in the description below alright until next time quest on
Related Videos

7:15
Support Vector Machines Part 2: The Polyno...
StatQuest with Josh Starmer
363,884 views

14:58
Support Vector Machines: All you need to k...
Intuitive Machine Learning
174,434 views

16:17
ROC and AUC, Clearly Explained!
StatQuest with Josh Starmer
1,616,217 views
21:58
StatQuest: Principal Component Analysis (P...
StatQuest with Josh Starmer
3,086,876 views

13:11
ML Was Hard Until I Learned These 5 Secrets!
Boris Meinardus
362,508 views

17:12
Résumé : Mbappé découpé, le Real Madrid s’...
beIN SPORTS France
982,066 views

15:26
🔥 J’ai infiltré le Salon de la Sorcelleri...
Frère Paul-Adrien
144,640 views
23:54
Gradient Descent, Step-by-Step
StatQuest with Josh Starmer
1,472,809 views

49:34
16. Learning: Support Vector Machines
MIT OpenCourseWare
2,047,969 views

15:12
Naive Bayes, Clearly Explained!!!
StatQuest with Josh Starmer
1,144,796 views

20:27
Regularization Part 1: Ridge (L2) Regression
StatQuest with Josh Starmer
1,158,165 views

23:01
But what is a convolution?
3Blue1Brown
2,878,183 views
18:08
Decision and Classification Trees, Clearly...
StatQuest with Josh Starmer
857,796 views

36:15
Transformer Neural Networks, ChatGPT's fou...
StatQuest with Josh Starmer
813,195 views

28:44
Support Vector Machines (SVM) - the basics...
TileStats
52,260 views

15:52
Support Vector Machines Part 3: The Radial...
StatQuest with Josh Starmer
289,324 views
1:20:57
Lecture 6 - Support Vector Machines | Stan...
Stanford Online
262,642 views

25:46
XGBoost Part 1 (of 4): Regression
StatQuest with Josh Starmer
699,038 views
3:53:53
Machine Learning for Everybody – Full Course
freeCodeCamp.org
8,243,327 views