Tutorial for Traders: How to Read a Price Chart
13.08k views3259 WordsCopy TextShare
Thomas Wade
The only people who know where the market is heading are institutions. They are the ones who make th...
Video Transcript:
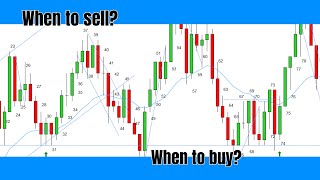
what's going on guys welcome back to my youtube channel and in this video we're going to talk about how to properly read a price chart because there's a lot of advanced traders that are watching my videos and they already get the idea how to trade but there are also a lot of new traders a lot of beginners who take a look at a chart for the very first time and this is what you would see today and as you can see you know to to untrained eye this is a clear naked chart no indicators no
technical tools anything like that and it can be very hard trying to identify when to go long when to go short you know when to buy and what to do market like this you know it's fairly hard to read so this is why i want to make this video to help you guys make it a little bit simpler how i read the price chart every day i'm going to start going through the process in my mind what i was doing today when i was trading and so first thing i like to do i like to
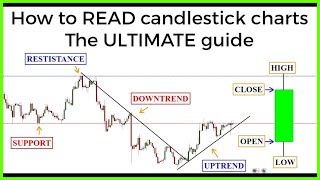
use the indicator that is called 21 bar ema so we just plot the ema you make it 21 bars and i use this indicator as to tell me what the trend is if it's uptrend or downtrend to see how the prices are reacting to it if it's a trading range and also the ema keeps pulling prices closer to it every time you get far away from ema you see prices are trying to get to the ema every single time so this is just a supportive indicator and this is ema is one of the key entry
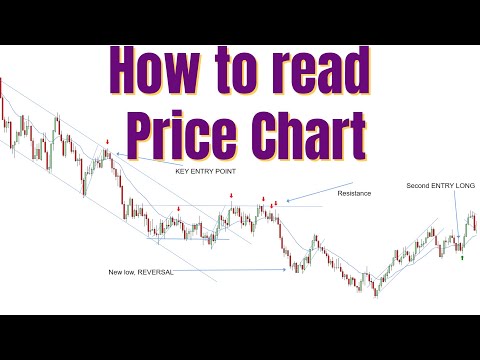
points every time i'm expecting a bounce for prices to make a bounce it is either trendline or ema so ema is one of my key entry points other key entry points i'm looking for at the charts to take the trades that's what the key entry points are the key entry point just means that there are specific locations on the chart where there is a higher probability that the trade is going to be more successful and key entry points are trend lines ema and support and resistance lines so as i came in today i saw this
downtrend a little bit and if you see like this you can see that there is some geometric pattern that prices are forming you can see the ema is pointing lower you can see each high is lower than the previous one you're making lower highs you're making lower low so this is a downtrend but i wanna even though i know this is a downtrend i still want to see where are most likely going to be the best setups so what i did is i drew approximately a trendline something like this and you can you're going to
be tweaking the trend lines making fit throughout the day you know that's no problem you don't have to be perfect you just have to be close and what i did i just copied it and pasted it to the lows and you can see it fits off the lows nicely you can probably make it fit even more cleanly but i like it like this and you can see now prices are swinging up and down up and down and you can see trend line is acting as a support and as a as a resistance line so this
is they're just slanted they're just tilted lining support and resistance lines and why am i using these trend lines because there's a rule in price action that not everybody knows that after a break of a trendline there is most likely going to be a retest of a new extreme and that goes for the bigger channels the main channels throughout the day and for the shorter term ones so not only my job as a day trader throughout the day is to find the bigger bigger trend lines to identify the larger trend i'm also using the trend
lines to help me identify the shorter turn trends because they are just as important and remember what i said a few few seconds ago after break over trendline there is most likely going to be a re-test of a new extreme and this is a very important information that i'm looking for because every time i'm taking the trade this is the information that i keep in the back of my mind okay so now that you see that we are making a lower high slow rows we are in this downtrend and we are identifying key entry points
i cannot just take any trade that i want i want to make i want to take the highest possible chance highest possible win rate trade that is possible the trade that has the largest chance to win and what i'm using is the pattern called second entries because market moves in two so you can see there's a lot of two-legged pullbacks throughout the entire chart there's a lot of second entries and it just goes back to human psychology it works in our real life and it translates into trading as well so what i'm doing i'm using
the combination key entry points with the second entries and of course overall market context so as the prices bounce here lower from this lower trend channel line i'm naturally expecting for prices to get to the key entry point higher trend channel line right here and you can see what i did i drew the short term trend line just as i'm you know looking for the trend line so i drew the short term trend line and i have a break and a new high at this point on this bullish uptrend has played out this this bullish
uptrend according to price action rules is over because after a break there's most likely going to be a new high which happened right here and that's all we had for this correction now this is the new law right here we have a first century short we triggered below this bar we traded up higher it felt and the second entry short happened right here now why is this is not a good trade to take because we are still looking for a new high of this uptrend working up higher first century short second entry short we have
to let this correction play out play out break and new high and you can see at this point on one two three four touches of the trend line and we have a break a new high this is a key entry point nice bearish bar we are in a downtrend and i'm looking for prices to get to the lower side as well so this was the first trade according to price action rules and hopefully you guys can identify it and then as you as you can see prices traded out lower and now we bounce off once
again from the lower side of the trench channel line we have a new low right here first century short pullback second entry short but why i did the market setup why this is not a good setup well it's because not only we are not close enough to the key entry point that is the trend line we are not even close enough to the ema so this was the reason why you have to wait and why you cannot go short into very low of the day notice how close you are to this low of the day
yes we are in a downtrend we are making lower highs and lower our lows but you you are way far away from ema you need a deeper correction you are still way too close and then you just keep going lower and lower and lower behold we have a new law right here and you can see the trend is starting to see fairly strong right now we have a first century short pullback second and too short now why it is at the key entry point so this is good it is at the ema but why this
is not a good setup even if this is the second entry just like the case here we have the shorter turn trend line working up higher we need to wait for a break any new high from this point on with the new high maid this bullish correction has played out and we can now go safely short we can sell the market and you can see nice reversal bearish bar but still it would be preferable to wait for prices to get to the upper trend channel line but this is such a good enough setup you can
see ema is holding prices each time then there is no arguing that the ema is going to hold these prices and you can see that the move wasn't really that big we should have went much lower we should have made it to the lower trend channel line but you can see we prices found support right here and this is the case where you had to start being leery because we should have we should have made it much lower right here but we just only made it to this double bottom and we instantly reverse from here
once again to this triple bottom now and we instantly reverse from here this is how you can see that the trend is available ring it's starting to lose momentum and you have to be you have to quit selling the market even this trade is fairly iffy it is much this trade is much safer this is a little bit more risky but still we have a break new high ema is holding prices and a nice bearish bar in and down trend but the fact that we bounced right here and we didn't make it lower you know
this is an indication that there's some bullish support happening and you can see we broke prices however we broke the trend line but this is not enough reason for us to go long just because we break the trend line doesn't mean the price is going to reverse remember what i said after break over trendline is the trend line rule there's most likely going to be a retest of a new extreme and you can see we have a one leg one bullish leg up correction second bullish leg up we have a new low right here first
century short we trigger one tick lower below this bar pull back second entry short but still we are inside of this channel right here so we have to let it play it out break any new high and we have a potentially short right here because we are waiting at this point on this bullish correction has played out with the break and a new high and we are finally waiting to make a new low of this bigger trend working down lower and you can see at this point on you can see that there is some resistance
time to form here and this is what i was starting to eyeball when i was trading live this day that you can see there are some matching highs here we confirmed right here and you can see the next few lows they're confirming prices as well and this is the big indication this is the green light for trades that happen right here because once we made a little correction here we bounce from here but we found resistance again at the same at the same key entry point this is why according to price action this is a
safe place to enter and now notice you have a double tap right here and you can count this both ways you can have a first century long pull back second entry long that failed which in this case it would have been losing trade and that's okay that will happen not everything is going to work you can see it you would have gotten stopped out just by one single take and it reversed exactly where you thought it was gonna go so first century long pull back second entry long this is a second entry long but we're
not looking for second entry longs because we are in a downtrend we are waiting for a new low so we are looking for failed second entry longs because we want to go short so when this point in this particular case you would have gotten stop scout stopped out and you had another chance to re-enter because this is a this is a trap they trap a little bit more bulls the e we close below the ema and there's a big stim at the end of this bar and what that means that at the very close of
this bar a lot of people started selling this is exactly what we want to see and we are still looking for a new law of this bigger downtrend broken lower so that's exactly what happened and from this point on once we have a new law right here after prices make a break and a new low new extreme there's going to be some sort of correction or possibly full-blown reversal so from this point on you should be really more literally not going short because you have a new law right here first entry short second entry short
even though this is a second entry shot we already have a break and a new low and we are still inside of this uptrend so this is a no trade even though it is a second entry short choices have to let this one go without you and the same thing happened here first century short second entry short it is at the ema but it is very low at close to very low over the day you already made a big enough move for people to starting buying again so this is why you have to skip it
again because you already have a break any new high you can see how the trend is starting to waver a little bit and we are starting to reverse and the first sign reversal is happening right here when the once the prices are rallying up through ema ema is not putting almost any resistance big green bullish bars working up higher you have a new high right here this is just the first entry so you just have to ignore this this is a new high right here you have a first century long pull back second entry long
but this is a horrible signal bar this is a bearish bar so when we are going long we are looking for bullish signal bar so even though this is a tool i can pull back to the key entry point to the ema and is the second entry long you cannot go long above this bearish bar this is the safer entry to go long above this it has a little bit bullish tense to it so this is much safer bullish bar two like a pullback to the ema second entry long and important thing is we try
to make a new low we have this one leg down pull back attempt to make a new low we didn't make it but it's okay because there's the ema and we are looking to make a new high of this uptrend so we have a break and a new high so once again the trend ryan rules has played out here perfectly just like throughout the entire market with this bullish rally up that happened just for a quick moment we have a break and a new high so from this point on once again the same story goes
all over again you're just sticking to trendline rules and you're just trying to find second entries or failed second entries and we have a new high right here and from this point on with the break and new high we are supposed to be looking for some sort of shorts we have a new high right here pull back first century long that failed and that's okay because this is the first entry pull back we go through the ema this is exactly what we want to see we go through ema second entry long but now we are
way too low below the ema we already have a break and a new high and this is now a felt second entry long this is exactly what we're looking for because we're trying to go short it is inside of this trend line and it is a nice bearish bar and in this particular case if you come from this low first century short pullback second entry short you get a little bit lower high from this high still below the ema still inside of the trendline key entry point good place to re-enter right here and perfect once
again till the t price action rules we have a break and a new low so what does that mean yes once again the prices may go into correction or we are possibly going to reverse so the same story goes all over again you draw the trend line from the low so you can see how it fits nicely prices are working up higher you have a newer height right here three century long pull back second entry long we have a break and a new low so this bearish correction has played out we have a break and
a new low second inch along nice bullish big bar and once again you even get a higher you even get a higher low excuse me a higher low from from this bar so this is how the market can get much more easier to read and hopefully you guys are getting a grasp that you have to draw these trend lines and you have to find the key key levels and if you draw the trend lines you can see how trading can become much more simpler and you can see if you just keep looking for the highest
probability setup if you just look for second entries or third second entry longs the trading can become so much easier and you can really avoid a lot of losers so i'm just going to zoom out a little bit so you guys can see bigger picture and this is how it looks if you use price action rules if you use the rules that i teach you and this is how it looks without any you know chart reading skills without the ema without the trend lines you know nobody can really make sense of this you know this
is so chaotic that nobody can really tell you where to go long where to go short if you don't use the price action rules if you don't draw the trend line if you don't use the ema as a supportive indicator so hopefully this video was helpful to you guys and see you guys in the next video
Related Videos

18:04
MASTER Trading Trading Ranges Like a PRO |...
Thomas Wade
11,742 views

21:58
How I Nailed Trading with the MACD Indicat...
Ross Cameron - Warrior Trading
740,531 views

1:26:08
No.1 Nitric Oxide Expert: This is the anti...
The Diary Of A CEO
1,157,595 views
22:11
Reading A Price Chart Bar by Bar | Price A...
Thomas Wade
41,968 views

3:33:33
Just Listen! Frequency Of God 1111 Hz: Une...
Frequency Harmony
5,026,102 views

33:39
The Most Dangerous Building in Manhattan
Veritasium
9,533,096 views

3:58:39
Eliminates All Negative Energy, Tibetan He...
Inner Peace and Meditation
5,781,780 views

34:14
Ce se află 𝐀𝐒𝐂𝐔𝐍𝐒 sub 𝐏𝐈𝐑𝐀𝐌𝐈𝐃...
Cristian Presură - Fizica Povestită
131,157 views

27:14
Transformers (how LLMs work) explained vis...
3Blue1Brown
5,964,150 views

2:02:20
Cafe De Anatolia - Desert Music 2024 & Des...
Cafe De Anatolia
985,236 views

1:09:23
WEBINAR: How to Trade with Volume Profile ...
Trader Dale
475,432 views

29:37
Largest Bitcoin Miner Reveals His Bull Mar...
Anthony Pompliano
116,166 views

6:05:28
Activate 100% of Your Brain and Achieve Ev...
Relaxed Mind
5,391,548 views

18:37
How To Draw Trendlines Like A Pro (My Secr...
Rayner Teo
749,915 views
16:25
Candlestick charts: The ULTIMATE beginners...
The Trading Channel (The Trading Channel)
5,027,981 views

28:30
7 Rules for Becoming a Profitable Trader
Thomas Wade
12,101 views

31:16
5 Price Action Rules EVERY Trader NEEDS To...
Thomas Wade
2,029,088 views
7:42
How to Read Price Charts in 15 Seconds (An...
Spencer Li - Synapse Trading
9,831 views

3:53:57
Deep Focus & Energy Boost — Ultimate Music...
Deep Chill Music
682,048 views

18:02
Beginners Guide To Reading A Price Chart (...
Thomas Wade
59,934 views