The Only Trading Strategy You'll Ever Need
635.59k views1720 WordsCopy TextShare

TradingLab
Once you watch this video, you'll understand the trading strategy I use on a daily basis. A 3-step f...
Video Transcript:
I have a 3 step formula that I ve backtested 1000 s of times And every single month that I tested it, it was profitable in the long term. No indicators, no patterns, just pure price action baby. And by the end of this video, you too will know this strategy.
And will be able to take calculated trades just like this one and make insane amounts of money. To jump right into it, the first step involves market structure. Now, this is arguably one of the most important steps.
Because if you even slightly just slightly fk this part up. It will ruin the whole strategy. *meme* One of the very first things you learn as a trader is uptrends and downtrends.
Its almost the sippy cup of trading. A chart that makes higher highs and higher lows is an uptrend. A chart that makes lower lows and lower highs is a downtrend.
Simple enough. Everybody know this. Now you may be thinking.
Why are we even going over this? I already know all of this. Well, what if I told you, you re probably doing all of this completely wrong?
Let me explain. So going back to our example. The chart does this, making higher highs and higher lows.
And as we already stated, its an uptrend. Okay. .
But then something interesting happens. The chart starts heading downwards. Which in the process, price makes this low, and breaks right through it.
And this exact point, is where I see the majority of traders make the mistake. Since price broke this low, a lot of traders think we are now in a reversal and price is in a downtrend. So they start looking for short trades because they now think price is going to head lower.
But what if I told you this chart is actually still fundamentally bullish. *crowd gasp* You see, sure price made this low. But this low is actually not a low at all, or at least a valid one.
Why? Because price never broke the valid low which is right here. *switch up* You see, the only way you can get a valid low is by breaking the previous high.
If price did something like this, where price didn t break the previous high. This would not be a valid low. I want to make this clear In order for a low to be validated.
It needs to break the previous high. If you do not understand this part of the strategy. The strategy will not work.
, So say if price does breaks this high, we now know this is the valid low. Okay good. So now price is in an uptrend.
Which means, we should only look for bullish trades. The only time we should start looking for short trades is if price breaks this low. It can do anything right here.
It can go up, down, sideways. Literally anything as long as it doesn t break this low. We are in an uptrend.
So if price did this. What are we in? Well a lot of people would say downtrend, because we broke this low right here.
But like I said before, a low is only validated if it breaks the previous high. Which this low did not break the previous high. So its not validated.
So we are still looking at our previous low. Which price hasn t broke, so we are still in an uptrend. Now say if instead of doing this, price did end up breaking upwards.
Since price did break our previous high. Our new low will be transferred from this point, to this one. I know it can be slightly confusing But the main thing you have to remember is the only way a low is validated is if it breaks the previous high.
If you remember that one simple rule, you will easily be able to identify if we are bullish trend or a bearish one. So that s the first step. Identifying if we are in an uptrend or a downtrend.
So whats next? That would be step 2 in the formula. Step 2 is identifying supply and demand in the markets.
Demand zones take place in uptrends. Supply zones take place in downtrends. A good style of thinking is you want to buy from demand zones and sell from supply zones.
The reason why you want to buy from demand zones is this. Here if we look closely. The market is going up.
Since we saw a large push from the beginning of this move. It simply shows us that a lot people wanted to buy from this point onwards. So we can assume, if price comes back down to this area.
Traders will have the same style of thinking and want to buy in this same area again. A supply zone is the exact opposite. Since we saw a large downwards move from this point on.
It shows us that a lot people want to sell at this area. So if price ever retests this zone we can assume price will again move downwards from this point. This supply and demand theory is the core of our strategy But We still have one more step in our 3 step formula But lets put all that we learned so far to the test on a real life chart example.
So looking at a real chart. We see price moved upwards Came down, and then broke this previous high. Which means we have higher highs and higher lows.
Meaning we are in a . uptrend. Since we are in an uptrend.
We only look for long trades. WE DO NOT look for any sell positions As shorting in a uptrend is just silly. *meme* Since this low broke the previous high, this is our valid low and price will only be in a downtrend if it breaks this point.
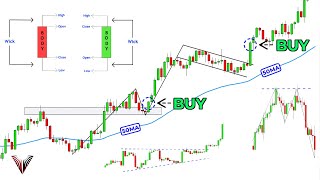
So now that we know we are in an uptrend, we want to look for demand zone opportunities. We can find our demand zones by finding an area of consolidation or a point where price moved sideways before having a sharp move upwards. As you can see from this chart we had some consolidation right here.
The price shot straight upwards. How I like to mark my demand zones is marking the candle right before the impulse move. So grab your rectangle tool on the side.
Find the area of consolidation before the big move. Then mark from the low to the high of the previous candle before the big move. This is our area of demand.
Again, we are not even considering areas of supply because we are in an uptrend. So we don t need to worry about that. We wait for price to re-enter into this zone and this is where we would enter.
Set your stop loss right below the demand zone and set your take profit at the recent highs. Boom we got an easy trade. So that s an example of one winning trade.
But I want to show you just how accurate this strategy really is. So lets break it down with a real chart example. Here we get an uptrend, because price is making higher highs and higher lows.
As we can this low is what broke the previous high. So, this is where price need to break in order to be in a downtrend. Which is exactly what happens.
So now we are in a downtrend and we only look for areas of supply or short trades. So we mark our areas of supply. Price comes back up this area of supply.
We enter. Set our stop loss above the area of supply. And set our take profit at the recent lows.
Boom easy winning trade But wait! we re not done Price created another area of supply up here and we re still in a downtrend. So we wait for price to come up to this supply Enter Set our stop loss above the area of supply and target recent lows.
Another winning trade. But again, we re still not done. Price created another area of supply.
Wait for price to come up to it. Set stop loss above the area of supply. Set take profit at recent lows.
And again we got another winning trade But wait theres more We got ANOTHER area of supply Wait for price to come up here again Set you stop loss and take profit. And we got another winning trade. That s the power of this strategy.
Its extremely accurate for one. And two, you are only trading in the direction of the trend Which raises the probability of you winning a trade by a lot. So now that you know just how powerful this strategy really is.
Lets go to the third and final step on how to improve this strategy even more. Our last step involves risk to reward. Sometimes while using this strategy, you ll get a trade that checks all of the boxes.
But when you setup your stop loss and take profit. Its has a low risk to reward like in this example. We only want to take trades if the risk to reward is above 2.
5:1 Mean for every $250 we re getting back we re only risking $100. So even if the chart follows both step 1 and 2. But the risk to reward is under 2.
5. We do not take this trade. This one rule increases the profit rate of the strategy by a ton.
So for our final example we have price making higher highs and higher lows. Meaning we are in an uptrend so we only mark our areas of demand. Price consolidated right here before shooting upwars.
So we mark this area. We wait for to come to this area again. Enter.
Set our stop loss below the demand zone. Set our take profit at the recent high. Last step is to check our risk to reward and make sure its over 2.
5. Which in this example its 3. So we re good to go there.
If its anything under 2. 5, we do not take the trade. Wait for price to play out and we get a beautiful winning trade.
Then we just repeat the process Forever . .
Related Videos

55:11
Master This ONE Candlestick Pattern TODAY ...
Ross Cameron - Warrior Trading
1,308,960 views

10:33
I Found The Secret to Technical Analysis
TradingLab
108,841 views

11:46
weekly vlog: trading scams, GJ shorts, wal...
HANNAH FOREX
824 views

1:41:30
The ONLY Technical Analysis Guide You'll E...
Ross Cameron - Warrior Trading
222,749 views

21:49
Convert TradingView Indicators into Strate...
Michael Automates
1,007,506 views

25:10
The Only Day Trading Strategy You'll Ever ...
JeaFx
246,841 views

22:59
The BEST Candlestick Pattern Guide You'll ...
Data Trader
727,350 views
1:17:35
The Only Technical Analysis Video You Will...
The Trading Channel (The Trading Channel)
24,385,209 views

39:19
Support And Resistance Didn't Work Till I ...
Rayner Teo
2,076,842 views

24:05
My Incredibly Easy 1 Minute Scalping Strat...
Riley Coleman
330,433 views

48:15
Reading Candlestick Charts Was HARD Until ...
Ross Cameron - Warrior Trading
1,269,031 views

21:25
How to Invest for Beginners in 2025
Mark Tilbury
2,124,193 views

21:58
How I Nailed Trading with the MACD Indicat...
Ross Cameron - Warrior Trading
652,070 views

30:09
I Wasted $5,000 on Trading Education, Only...
The Secret Mindset
429,953 views

8:29
The Strategy That Made Him $1.1 Million In...
TradingLab
1,052,849 views

13:34
How a SCAM NBA Trade Destroyed A City
Hoop Reports
327,924 views

29:47
The Ultimate Guide to Swing Trading for Be...
Humbled Trader
147,695 views
12:42
1 Indicator, 3 Uses! Most Powerful Trading...
PineTrades
550,588 views

10:20
Robinhood Trader Commits Suicide: What Act...
InTheMoney
2,795,209 views

33:20
I've Been Trading For 13 Years, Here's My ...
Rayner Teo
163,053 views