How to Make a Fishbone Diagram (Ishikawa Diagram) - Root Cause Analysis
93.15k views2360 WordsCopy TextShare

David McLachlan
⭐️⭐️⭐️ GET THIS TEMPLATE PLUS 52 MORE here: https://www.etsy.com/listing/1199800561/50-project-manag...
Video Transcript:
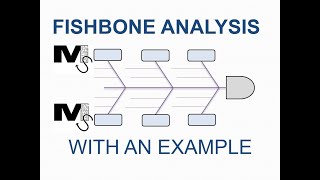
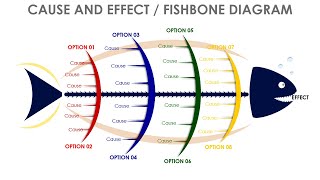
[Music] hi everyone have you ever wanted to get to the real cause of a problem or an issue that you're facing in your business one of the best ways to do that is with us an ishikawa diagram or a fish bone diagram this is a technique that was used in the toyota production system or lean and it's a really really great way to find the real cause behind the issues that might be happening in your business with the ishikawa diagram we put the problem or the opportunity at the head of the fish that's why it's
called a fish bone diagram as well there's a the head of our fish and here are the bones and here's the tail of the fish and in looking at this fish bone diagram and the problem that we're facing now we're putting these uh the brainstormed ideas into buckets so buckets such as information are we not getting enough information for example as we're brainstorming with our team or maybe there's something to do with the people maybe the people need more more things or maybe the people are not don't have the training that they need maybe there's
something to do with the process is it a different process that we need to try and is it the system down below as well is it the is there a problem with the system that we're working with and do we need to change it this is what we can use to brainstorm with our team and then when we do brainstorm one of the best things to do is to take actions so what is the action that we need to take who is it assigned to and what is the status of that particular action and we're
going to learn how to create this in excel today so let's get into the sheet it's going to be a whole bunch of fun now the first thing we're going to do is just do up the header row with all of the titles and the information and we might speed this up ever so slightly as we do that so we can get into the real goods of the ishikawa diagram itself some things we want to capture are the process or the area and we'll just turn this white so that we can see it and then
we'll give ourselves a box so that we can capture that information but we also want who has authored this particular diagram and that way we can capture that before we set up our fishbone diagram now the first thing we need to do when we're setting up our fishbone diagram is to insert the shapes that we need and the first shape we need is just a rounded shape it's in the flowchart section of your shapes and it's called the delay syst the delay symbol but we're not going to use it as the delay symbol we're actually
going to use it as the head of our fishbone for our fill let's just give that a light gray and for the outline let's give that the same color as we're working with in our color template and the border a little bit larger as well we want to edit the text here and this is the problem or the opportunity if we format this shape what we'd like to do is just look at the text options now what we can do is actually put this in the middle and the center and maybe make this bold and
a little bit larger so that it does stand out and as you can see it's now wrapping around so we just want to reduce the margins on this shape and that way it's just going to stay in the center without wrapping around and we'll be able to see all of the text that we've input now the second thing we do if we copy this and paste this across we can get rid of the text but an easy way to do this with the same formatting is to go to format edit our shape and change the
shape and what we want to do is just change this for the tail of our fish we can grab this little section here and turn it around hold shift and it will turn it around and match up exactly horizontally for us and now we have a nice tail but we need to link that together now and again we use our shapes and we're going to use just a normal line what we can do is we can actually connect this directly to our items as you can see the connector points do show up so that's connected
nicely and all we need to do now is just change the weight make it a little bit larger so that it really stands out and now our ishikawa diagram is starting to take shape now we can copy this line again ctrl c to copy and ctrl v to paste and we're going to start putting in the bones of our fish as you can see there we go that fits quite nicely if we just make that down make that go down a little bit and now that's lining up quite nice now if we copy and paste
that again we can simply put that make our second bone make sure that lines up nicely again and now we can do the same for our the bottom bones down the bottom as well but that's not everything that we need we need to copy this again and paste this again and what we need now are some horizontal lines because these are going to be the other the other types of uh of where we're actually labeling the ideas that we come up with now if we put that we can actually make that a little bit straighter
that's looking quite good again if you hold shift that will give us a nice straight line and all we need to do now is just copy these down copy these down until we have enough that we can start working with and if we fill out these out for the rest of our bones then that's going to give us the bones of our fish bone diagram now that we've done that we need the buckets that we want to brainstorm with so that the way we do that is a it's a little acronym called pips so it's
people information process and system and that's one of the the best ways in your ishikawa diagram to label those buckets and to to group those brainstormed ideas into now to label these ones we're just going to go to shapes again let's choose a nice rounded rectangle and select this in here as well if we edit our text this one can be our information now the same as we did with our problem or our opportunity we can format this to be whatever we please let's just give it a nice a light color maybe a dark gray
make it a little bit larger and of course we have to change those margins so that it doesn't overlap for our first one we want this to be our people bucket so are there any ideas or brainstorming ideas around people down the bottom we just want our process and our system buckets we'll color that a nice light blue and system we can color a little bit differently again now we've got our ishikawa diagram and we can start putting our brainstormed ideas against all of these different areas but to do that we're going to need some
text boxes so that we actually can fill these items out as we're brainstorming with our team to do that we go to insert and insert text box and if we just create a text box here now we can start working with this and formatting this in the way that we want if we edit the text then we can say here is one of our idea ideas and if we just reduce that down a little bit now for this we want it to be in the middle we can have it over to the left and that's
fine but when we format the shape with our text options again we want to reduce those margins where we can we do want to wrap the text in shape so that's right for our shape options we also want our properties we want our box to resize the shape to fit the text and that way if we have more text it's just going to resize the box for us automatically now we don't need an outline for this so we can get rid of the outline and now we don't need a background as well so we can
get rid of the background and now we've got our idea that we can just copy all of these into into the different bones so that we can easily start writing these ideas whenever we need to as we're doing that as well what we can do is just go to view and grid lines because we can actually get rid of the grid lines now now that we've already got our ishikawa diagram and it is starting to look really good as you can see we now have a beautiful ishikawa diagram that you can use to brainstorm these
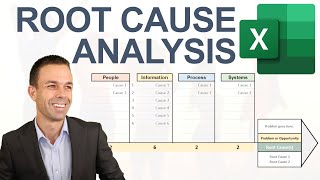
ideas with your team but one thing that's missing is how do we take action on these particular items and for that we just needed an action register and that's also extremely easy and extremely beautiful to create in excel let's select the area below our chart and just color this in so we know what we are working with then we can single out the chart itself so let's select these items here and turn these back to white or even no fill is fine and let's start putting a border around this so that we know what we're
working with we'll have a heading border and then we'll just separate the numbers here as well for the heading border let's color this our beautiful turquoise color just to make sure that that looks really nice and stands out and of course we'll turn the text to white for all of our items we want to put them in the center and in the middle again and we'll work with the rest of that as we go along we'll merge these three and we'll merge these two together because this one is going to be the status this one
is going to be the owner and this one is going to be the action now we can select our chart area and if we go to our more borders section just in our borders more borders what we can do is a couple of things at once we'll select a normal line do that as a vertical line and a dashed line do that as our horizontal line not diagonal and if we click ok there then that gives us all of the lines that we need but we still need to just merge these together so that they
do work with what we're wanting and to do that we merge a couple and then we can copy the rest down very easily same for our owner and same for our status as well and then all we have to do is just add the thick box around the edge again if we enter our actions and our owners then all we have to do is enter the status as well and for the status we're going to use a little trick first of all we just need to set up the statuses so we want not started we
want in progress and then we want complete we'll just give those a little bit of a different color so that we know not to mess around with that too much but once we've done that we select all of our status road and we go to data and we're going to go to data validation data validation and we're going to select a list the list source is this particular list that we've just set up not started in progress and complete and if we drag and select all of that and click ok now if we select here
we can actually choose from a drop down and this is a really really wonderful easy way to do it but we still want to just give them a little bit of color so that we know if something's not started we want it to stand out to do that we're going to go to home conditional formatting and new rule or manage rules but what we want is cells that contain the cell value equal to and what we're going to do is just do the same cell value as we're taking the values from so let's do our
not started one which is that one and let's give that one a bit of a an orangey color and click ok and let's do the rest of those as well manage those rules in progress we can give that a light yellow click ok and apply and for our last one cells that contain cell value equal to complete let's give that a nice light green and if we click ok and apply and click ok again now we have some beautiful colors to go along with our actions and all of our action register and this is a
great way to brainstorm now you have created an ishikawa diagram all of your very own that's really usable as well with the action items and the action list i've really enjoyed spending the time with you creating this sheet today and i hope you've enjoyed yourself too i'll see you in the next video bye for now [Music] you
Related Videos

20:10
Fishbone Diagram EXPLAINED - Root Cause An...
The Business Analysis Doctor - IIBA Certification
16,284 views
11:20
How to Make Root Cause Analysis in Excel (...
David McLachlan
17,576 views
11:03
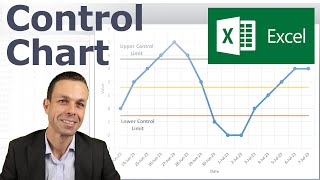
Making a Control Chart in Excel (with dyna...
David McLachlan
92,584 views

20:29
How to Make a VALUE STREAM MAP in Excel (P...
David McLachlan
75,249 views

14:25
The Classic & Reverse Fishbone Diagram | A...
i-nexus strategy software
48,758 views

20:04
The Dumbest Drivers Ever
Daily Dose Of Internet
3,370,580 views
17:13
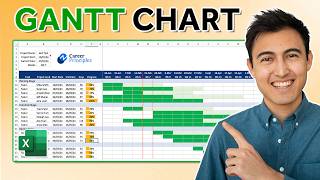
Make This Awesome Gantt Chart in Excel (fo...
Kenji Explains
634,513 views
7:07
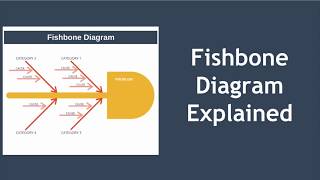
Fishbone Diagram Explained with Example
EPM
417,277 views

8:32
What is Root Cause Analysis (RCA)?
IBM Technology
87,033 views
10:58
Fishbone Cause and Effect Analysis and Exa...
Mister Simplify
60,047 views
24:22
Root Cause Analysis Course - 5 Whys and Fi...
Brion Hurley
407,629 views
6:16
How to Create A Pareto Chart Like A Pro in...
Luca Balestrieri
367,091 views
15:59
How to Make the BEST Gantt Chart in Excel ...
David McLachlan
1,770,302 views

13:41
Live Ishakawa Fishbone Diagram Build
DTI Training
44,109 views
16:04
The 7 Quality Control (QC) Tools Explained...
CQE Academy
757,640 views

21:50
Excel Vlookup Tutorial - Everything You Ne...
Excel Campus - Jon
2,671,730 views

14:03
Root Cause Analysis WITH (ACTUAL Example)
Learn Lean
86,575 views

10:21
Trump’s Press Secretary BANS CNN's Kaitlan...
Gleise Deliane
1,246,177 views
13:38
Fishbone diagram slide in PowerPoint
POWERPOINT UNIVERSITY
48,353 views

24:31
Excel Charts and Graphs Tutorial
Kevin Stratvert
830,747 views