Graph the efficient frontier and capital allocation line for a three stock portfolio using Excel.
3.31k views5502 WordsCopy TextShare
David Johnk
I wrote some Lambda functions for portfolio calculations here they are:
/* These Excel Lambda funct...
Video Transcript:
okay i' I've done portfolio uh modern portfolio Theory before on Excel but um I thought about this and I I thought of a way to do this a little bit quicker and show you more interesting stuff on Modern portfolio Theory I'm going to show the effici frontier I'm going to show things like the capital allocation line how to use solver to find different to optimize different things on your portfolio so without further Ado let me just get started hopefully this video will be interesting so I'm going to we have to do a start date so
I'm going to go equals today uh minus 365 to go one year back for for end date I'll go equals today okay and then we we just get the we're going to use the stock history from the built-in stock history function on Excel to go ahead and get some stock price data so I'm going to go to stock comma start date I'm going to Absolute reference that and then the end date and I'm going to absolutely reference that and um so now we have the we have the close now this is quick and dirty I
actually I I recommend using adjusted clothes like from Yahoo finance um but we're just just because I adjust a close like apple pays dividends and right here you can see that it's not folding dividends into the prices and all that as of October 2024 um Excel doesn't have adjusted close hopefully someday they will all right so but just to demonstrate this so you know how to do this assume this is just a close I'm going to go copy I'm going to paste it over here and this one I want to make sure it points to
this so I'm going to drag it over to uh uh John Deere and then I'm going to get rid of the dates so I'm going to in order to drop the dates when I down all this I already have the dates over on the left I'm going to do three commas and a one and then let me drag it over one more time to get Google so now we have the price history on all the uh for three different stocks right um obviously you won't have stocks that have positive returns over the period that you're
doing it it'll actually make it make this come out a little bit better um well not maybe not obviously but you should try I mean if you want it to come out the way it's coming out here you want to use a uh stocks that have positive returns I already checked before we did the video this has positive returns and so we're going to save some time I wrote some the I wrote These Lambda functions and uh and you could put them in one at a time like if you go up here to name manager
you could add each one of these in I could go a new and I could put them in each one at a time but uh I suggest to uh to use this if I go to my home screen you see I have this Excel labs and the way you would get that is you would just go to a store we get to store we type in store you want to go browse add-ins and then we want to look for if you just type labs and enter and and you want to look for this Excel Labs
the Microsoft garage product and go add project and go add you go add then this little test tube will return turn will turn up on your home screen okay so I already have mine there so I'm just going to go ahead and click on it and I'm going to go to modules and I'm going to go new and we'll just call this module portfolio and I'm going go add and then I'm going to go back to uh back to here I'm just going to copy all this this now I'm going to go ahead and I'll
put this on the video I'll put it under the description or in the first comment because this is just text so you can you can do the same thing you can just paste this into your Excel so I'm going to go copy I'm going to go over here I'm just going to paste it in and it puts those in there and and and it's not going to appear yet if I go here to the name man go to formulas and go to the name manager you can see it's not there but if I hit this
little save save button now if I go look in the name manager put all those functions in there and you know we named it portfolio so it's portfolio dot then that's the name of the functions all right so now we can use them so now we can do things like uh uh we can do like uh we could we could calculate like the average returns right and so if I go here I go equals portfolio if I start portfolio all those functions I just put came I did uh did just can't uh all those functions
we just just imported it right here because we started them in the portfolio and uh the one we want is uh we want the portfolio expect return is what they average is so if I do that it asks for it asks for well not portfolio I'm sorry we want uh not portfolio we don't have we haven't formed a portfolio we want the portfolio uh let me look here not the see we have portfolio expected return and expected return so we want expected returns but it asks for the prices so I could highlight these prices right
but but but if I hit I'm going to hit Escape instead of highlighting them I'm just going to highlight them right now I can name them anything I want but I'm going call them P for prices because that's the way the way those lamb Lambda functions are and uh so now I can go in here again I can go equals portfolio and we want portfolio uh not portfolio expected return but the not the double portfolio but just the expected return of these right and if I double click that and then I go p and since
I highlighted these and called it P up here you can see that it uh highlights some form me if I just hit enter it puts those in and then we could also do the standard deviation of those returns and so I can go equals portfolio again and then we want the standard deviation of returns and then also P again and it puts the standard deviations let me highlight those and I'll make them make them all percent and by the way I didn't use log returns here I just used a simple that divid by that minus
one if you wanted to you could go in there and adjust my my my my Lambda function very easily you go in here into a name manager and go where we do uh where it says periodic returns if you edit this formula uh you could put natural log in there and that would work but I'm not going to get into that all right so this is just regular periodic returns again you get you get the idea no matter what I use now I'm going to do something called a sharp sharp ratio so I need to
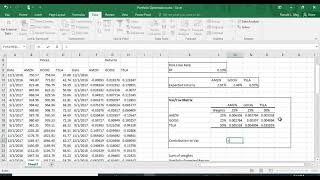
I need to put the risk-free rate in here and this is going to be the daily risk-free rate so I'll call it uh 0.175% uh per day okay it'll just give some kind of risk-free rate here yeah so now we can do the sharp ratio yeah so that's going to be equal to parentheses the average return minus this risk-free rate and I'm going to go ahead and F4 that because I'm going to copy it across divide by the standard deviation and this isn't a percent of course it's a just a number let's take it out
one more place and then we can copy that across and let's go ahead just for reference I'm going to go equals whatever this was this we have a reference of what we have so now we have now we have our uh our descriptive statistics for for our individual Securities so that expected return for Apple uh John Deere and Google so they all have positive returns that's good so that this is the return and this is the risk right the standard deviation is the measure of risk and this is the the the am the amount of
return per unit risk that's basically what this is the amount of return per per the amount of return in percent for every % return of standard deviation which is my risk okay so this kind of compares the too so the highest sharp ratio the sharp ratio is kind of kind of uh join these two right because you can look for the least riskier or the best return but this kind of measures them both together which is kind of nice okay all right so um so now let's form a portfolio so I'm going to go my
weights and uh what I'll do is I'll say uh equal just I'll just mindlessly put onethird of my money into each uh not without any thought I'm just going to put a third of my money into each one of these stocks right and uh so if I sum that that should equal 100% right let's go ahead and make this percent because it's a little bit easier to read okay so so if I had like $10,000 I would invest uh dollars invested would be equal to of course this F4 times this so I would do three
I'd buy $3,300 $3,333 worth of each one of these stocks so if I sum that just a double check again I like to put double checks in here $110,000 right so that's should be equal to that and then the number of shares of each one well it'd be equal to uh it' be equal it' be equal to this divided by and we'll just use the the price the price of the stock I'm recording this on I'm recording this on uh 103 right right and uh so the close at this price today okay and this is
of course this is the number of shares so that's going to be a number so I this is how many shares of each stock I would buy okay um so now we kind of know what's going on and so now let's calculate if I do this if I put a third of my money into each one of these and I buy this many shares what would be my so now we can do some portfolio statistics so we can go to the portfolio expected return or average return same thing and uh so that's going to be
equal to portfolio and that's where I'm going to use a double portfolio portfolio portfolio expected return and that asks for the weights now again I'm going to hit Escape because I'm going to use the weights a lot so I'm going to highlight these I'm going to go up here again I'm just going to say w for weights I can say any letter I want so um but I use W because it just kind of makes sense here so I'm going to go equals portfolio uh portfolio expected return and then W it highlights those and then
P it highlights those now if I would have called that Z it still would have highlighted those and still would have work but I'm just using wmp just to and then we can do the portfolio standard deviation and that's going to be equal to portfolio uh standard deviation you know you're doing a portfolio calculations because it's asking for the weights right I double click it see how it down below it asks for the weights first and I called the weights W so that just kind of makes sense I called the price is p and again
uh we're going to calculate the sharp ratio just let me copy this and paste it and that'll that'll do the same do and then we can go ahead and highlight these and we can do a format painter format them all the same so now I have the let me put the formulas in here just so you can see them and this is the daily daily right these are daily returns this is based on daily information I'm this formula actually lives this formula actually lives over here this is a spilled array the formula lives over oops
lives over there right it lives in this first cell see when you click on it you can see it's a spilled array CU it U it does that um all right so now so now we can see so let me let me do some highlighting here so I'm going to highlight this I'm going to go conditional formatting uh I want to say if this is less than uh my portfolio return I want to make it a custom format I want to make it uh I want to fill it with a dark red because I don't
want to look at it okay so in that case my portfolio didn't outperform as far as expected return it didn't didn't outperform Apple or Google and then we're going to do the same thing here I'm going to go here and go conditional formatting and highlight sell rules so if the risk is less greater than that's not going to all perform so I'll go greater than um this again I'll make it custom format dark red so so just by mindlessly just by mindlessly uh diversifying and putting a third of my money into you can see that
my risk is lower than the risk remember lower is better none of these P none of these stocks would be better than uh 0151 let's do the same thing with the sharp ratio I'm going to go conditional formatting uh so if it's uh less than that sharp ratio down below it's not good again we'll go to go custom format dark red okay and uh and uh so this sharp ratio is less than that well hold on that didn't 064 this should be read also let me check conditional formatting manage rules CL let me do this
conditional formatting manage rules G13 G14 and G13 is okay so this rule I made some kind of mistake let me delete it let's try that again if these conditional formatting highlight cells rule if any of these are less than this then we want to make it red okay okay all right so so the sharp ratio like again the sharp ratio the only the only place the sharp ratio is better is an apple okay so you can see that uh the portfolio I'll perform because if it's red the portfolio is better right than any the red
numbers all right so now the question is so let me just copy this down just so we have a copy of it so I'm going to go copy and uh paste it down here well I'm going to paste it as values because I don't want to lose anything and then uh I'm going to say this is equally weighted this to have a copy equally weighted this this we have a copy of it because I'm I'm going to form several portfolios so now we can say well can I can I do something better so how about
if I want to maximize a sharp ratio to get the highest sharp ratio possible what weights could I do here to do that so I can use solver for that so I'm going to go here I'm going to go into Data I'm going to go to solver and then uh solver in order to get solver up you can Google on how to turn solver if you don't have it here under data it's very easy to do so what I'm going to do is I'm going to uh set this sharp ratio to a maximum by changing
these weights right here okay I have to add one constraint I have to say this equals I going to spend all my money so that's has to equal to one and I'm going to go okay one is 100% I'm going leave that check leave everything as a default If It Go solve then okay so now so now I changed these right now you can see now my Sharp ratio is 0072 which way all perform these very well U my risk is much lower than these and the only return that was all performed that that all
performs it is Apple so so I got I'm in a much better situation here just by and these are the weights I would use I spend I'd buy 31 shares of Apple two shares of John Deere and 12 shares of Google Now remember this might seem like magic right because this is based off history so you don't know you putting these weights doesn't guarantee you the same thing is going to happen in the future right um also I use daily if you use weekly you're going to get different results monthly if you don't go back
as far so so this is just showing you but B basically what this showing is the power of diversification and balancing your portfolio the right way can can really affect how how things happen all right so let me copy this down because I'm I'm going to do some other ones I'm going to go copy let me paste it here paste values I want to put a space here too just to give us a little bit of room all right and this one was uh we'll call it maximum sharp ratio let me let me just highlight
these just to kind of make it look a bit nicer let me make it like uh light blue okay so um so how about how about if we want to have the least amount of risk that's possible okay so the least amount of risk what I could do is I I can go ahead and go back to data again and then go to solver and I could say well let me just reset all just so you see how this is done reset all and what I want to do now I want to minimize my risk
which is the portfolio standard deviation Again by changing these weights okay and I'm going to add the constraint that uh this again don't forget to do that equals 1 okay now this just makes sure that none of these go negative that you don't short anything let we go solve and then okay so my minimum variance portfolio would be this this is the least risky you can see that this risk is way lower than these three risks let me copy that down copy let me just put it here paste values this is the minimum okay um
all right so we have a lot of um let me see if there's anything else we might want to do uh if you try to maximize the return well it's going to be it's going to be it's just going to maximize onto apple right so that's probably not that's kind of a trivial thing to do but what we could say is okay what what if I uh what what what's going on here let's let's graph this and see what's going on so what I'm going to do is I'm going to go here and I'm going
to say let me do it here I'm say equals Rand array and we're going to go one row in three columns right and I'm going to sum that so I'm going to go here to Auto sum and what I'm going to do is I'm going to do these weights based off these random numbers but I still on V one equal one so I'm going to go here this is equal to um this divided by this I'm going to go ahead and F4 that uh total then if I drag that random number across so it's always
equal 100% so every time I hit F9 it'll recalculate and I'm I'm getting all these random portfolios with different expected returns and standard deviations okay so I'm just randomly generating portfolios so I want to do that because I want to I want to generate a lot of data points with different weights so let's go ahead and um so now what I'm going to do is I'm going to go over here I'm going to go uh trial let me do it down one more one more down trial we go one you I'm going to generate several
trials so uh if I go here to fill series columns I'm not going to go crazy let's just do 2,000 trials so that' be like hitting half n 2,000 times and then we'll put uh here I'm going to put the portfolio standard deviation and here I'm going to put uh the portfolio expected return so here I'm going to go equals portfolio standard deviation o let me try that again so equals the portfolio the number for the portfolio standard deviation and here equals the number for the portfolio expected return we'll put the weights here so this
equals these weights just to keep track of them we don't have to but kind of nice to see the weights so this is equal to those right and go weight okay so every time I H N again those are going to change and those are all those numbers I'm changing they're just kind of copying across from what over there was on the left but here's the magic I can take this I can highlight all this and then uh I'm going to scroll back up and what I'm going to do is I'm going to go to
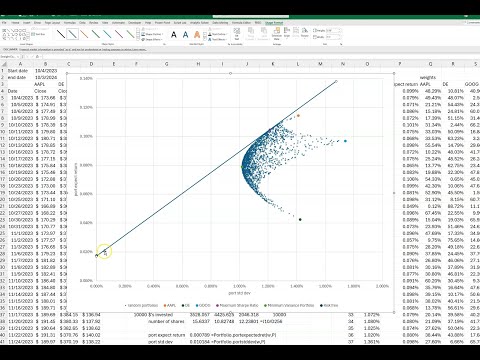
uh data and then what if analysis data table and since this is in columns I'm going to go here and the trick is I'm just going to hit on a blank cell and go okay and let me just uh let me just format all those the same okay so now we have uh so now we have uh that's like hitting F9 2,000 times so let's just graph what's going on so I'm just going to graph uh this much stuff right here scroll back up to the top and we're going to insert a scatter plot and
there we can see our I'm going to get rid of the title we don't really need that and this's just make those dots a little bit smaller so I'm going to format the data series and I'm going to go in here to [Music] markers and marker options built in want to make those as small as possible also make them something that doesn't stick out so much okay and then let's just go ahead and uh make this graph a little bit bigger so we can you can see what's going on so you can already see this
is called the efficient Frontier this little this little border and all these different dots are different uh different portfolios of those 2,000 portfolios that's all of them right here okay you're going to get different shapes depending on but normally you're going to get something resembling kind of a parabola so so uh so we can just uh let's start labing this just so it makes a little bit of sense so I'm I'm going to I'm going to add some so I can go add chart element axis titles primary horizontal so I'm go equals um the horizontal
is the portfolio standard deviation right uh let's see if it took that nope it didn't take it the way I wanted let me try that again uh click here and then we're going to go to chart design add charart element axis head primary horizontal and we go equals portfolio standard deviation okay wait try one more time x titles horizontal equal portfolio standard deviation and try again AIS titles primary vertical and go equals portfolio expected return so now I have those and um so you can add some of these things here like uh we could add
first we could add just the individual Securities well no let's uh yeah let's just add some data here this is show you how cool this is so we we can do we can do a uh I'm going to go select data and this first series I'm going to edit it and when I'll call this is just uh random portfolios okay randomly weighted portfolio Okay and then I'm going to add another one what I'm going to add is I'm going to add Apple by itself and the X Series for apple is a standard deviation which is
this right here remember the standard deviation is on the X and the Y now you have to delete these you just can't highlight you have to delete it in the Y is the average return I'm going to go okay so you can see that that one right there is Apple okay and see how I put a little orange dot there for you now what I'm going to do is I'm going to put the legend here so I'm going to go add chart element Legend and we'll put it on the bottom down here so it's showing
here the little dots or the run them and an apple is this one that kind of makes sense cuz apple is the highest return so of course that would be the highest just Apple by itself 100% Apple would be right right around there somewhere right so let's add some more points so I'm going to go to select data and we go add let's add John Deere remember the X Ser the x- axis is a standard deviation and the Y AIS delete this out of here is the the average return you can see it puts uh
John Deere down here and that makes sense that John Deere is the lowest return one in the standard deviation 1.42 4 is about right there okay we can add let's go ahead and add in Google the sech name of Google so I'm just going to go click on Google the X Series are the standard deviation and the Y series is uh average return and then we have Google so those are my three Securities and anything in between is where randomly you know any other random portfolio is going to be landing in there now some other
things we could add we can add some other things that we that we uh we put here like we did a maximum chart ratio and that's a special I'll show you that's actually a very special uh the reason I did that it's a special point on on our on our fishing Frontier so I'm going to go ahead and add that in so again I'm going to go uh select data and uh add in the series name is maximum sharp ratio and the X values for that is uh this standard deviation and the Y values are
uh this this return you see that's this right here okay and let's go ahead and add the minimum variance portfolio that's also uh kind of an important important point so that's going to be minimum variance portfolio and the X values are this and the Y values are uh right here so now we have the minimum variance portfolio here and it's nice we have the legend down here if you forget which one each one of these are okay and I'm going to add one more you know let me add one more thing I'm going to add
uh the risk-free rate so I'm going to go add risk-free rate and the risk-free rate is going to be zero zero on the X because there's no risk and the Y is going to be this this per day so the risk fee rate is going to be over here on the on the Zero X because there's no risk right the standard deviation is a risk now uh so you can see a lots going on here let me just make this graph a little bit bigger so I can explain what's going on so so this is
called the efficient Frontier from from the this minimum variance portfolio up at this point is called the efficient Frontier because like say if I went remember this this Green Dot is John Deere if I invested in 100% John Deere well this is the level of risk I could go up straight up almost all the way up to right here uh to Apple and for the same amount of risk I can invest in Apple so why would I do that okay so any any point along here below this minimum variance if any point I could go
straight up and get get a higher return for the same amount of risk so why would you take less you you You' want a higher if you're if you're a rational investor you're not going to take less return for the same amount of risk so you're always go up here from this minimum variance portfolio along all along this Edge right here so this purple one is the special one where it did the maximum sharp ratio so the so I could actually jump off of this efficient froner by doing something called a capital allocation line so
that mean uh let me do this I'm going to draw a shape here and draw a line so if I draw a line from from here tangent to that to that sharp ratio that's called the capital allocation line so now this becomes my efficient Frontier because I'm jumping off there so I can do if I did 50% of my portfolio I did 50% of my portfolio in risk-free and another 50 % into this into these weights so I did did $10,000 $55,000 invested in this which would be half the number of shares here and another
$5,000 invested in my risk-free which would be like a treasury or something well I'd be exactly halfways down in this line so I jump here okay so so i' be jumping from from this efficient Frontier to that also I could short I could short this portfolio and uh and come out come out here along this line so so that's called the capital allocation line so anyway I hope I didn't miss too much I'm just kind of rambling on here but I'm basically showing you what you know sharp one the Nobel Prize and Maris won the
Nobel Prize for modern portfolio Theory so in this short time I don't know 33 minutes I basically showed you what two Nobel Prize win winners were talking about right so Excel I mean back when they were doing they didn't have Excel so was a lot harder but but anyway I think hopefully that makes sense uh I think I'm going to stop there because I've already gone on for 33 minutes but uh like I said these Lambda functions I'll put them down in the description if you want to try to do your own portfolio uh hopefully
that kind of makes sense what's going on this is like I almost covered a semester of portfolio theory in 33 minutes so that's not not too bad um so anyway um thanks for watching if you haven't subscribed to my videos to my channel my picture will come up if you click on that picture it will uh subscribe you uh if you like my videos give me a thumbs up that always helps me encourages me make me any comments if you have any questions I probably probably miss some things and thanks for watching that's it for
today bye-bye
Related Videos

14:43
Efficient Frontier Explained in Excel: Plo...
Ryan O'Connell, CFA, FRM
34,487 views

32:47
Use Excel to graph the efficient frontier ...
David Johnk
142,947 views

12:20
Trump stumbles as Musk’s fraud claims come...
MSNBC
509,739 views

14:00
Trump tells Ukraine “You should have never...
BBC News
665,679 views

8:57
Trump Brings The Receipts To Read Off Shoc...
Forbes Breaking News
1,662,530 views

5:15
'Largest Money Laundering Scheme In Histor...
Forbes Breaking News
573,398 views

9:46
Audience Q&A – SNL50
Saturday Night Live
2,123,880 views
8:47
Graph The Efficient Frontier And Capital A...
Ryan O'Connell, CFA, FRM
138,536 views

13:05
Efficient Frontier and Portfolio Optimizat...
Ryan O'Connell, CFA, FRM
18,282 views

21:25
How to Invest for Beginners in 2025
Mark Tilbury
2,031,566 views

12:59
Constructing the Capital Allocation Line i...
Darwinex
7,438 views
15:36
Combining two stocks in a portfolio in Exc...
Initial Return
4,052 views

8:44
Close Encounter 50th – SNL50
Saturday Night Live
4,833,541 views

15:38
Plotting Efficient Frontier for Four Secur...
Ronald Moy, Ph.D., CFA, CFP
11,089 views

15:02
Tracing the efficient frontier in Excel / ...
Initial Return
2,240 views
23:13
Calculate a binomial interest rate tree fr...
David Johnk
1,922 views

17:02
Portfolio Optimization using Solver in Excel
Fabian Moa, CFA, FRM, CTP, FMVA
67,423 views

19:35
Portfolio Optimization in Excel
Ronald Moy, Ph.D., CFA, CFP
38,501 views
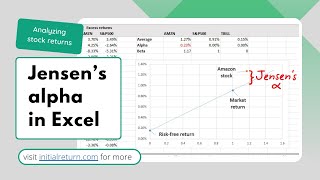
15:47
How to calculate Jensen's alpha in Excel /...
Initial Return
5,117 views
17:46
Portfolio Optimization in Excel - Revised
Ronald Moy, Ph.D., CFA, CFP
15,080 views