Bollinger Bands %B strategy - Live $4,000 Profit in One Trade!
19.92k views1589 WordsCopy TextShare

GeekOnDaily
In this live trading video, I’m revealing a powerful strategy that helps you capture full trends wit...
Video Transcript:
hey everyone welcome back to another exciting live trading session I'm thrilled to have you here because today I'm going to share something truly powerful an amazing strategy that can help you capture big profits in the market one of the biggest secrets to becoming a successful Trader is learning how to identify and trade in a strong trending Market why because when the market is trending it offers some of the best opportunities to maximize profits but here's the catch most Traders face a common problem they know the market is trending they enter a trade but they fail
to ride the full Trend instead they exit to early out of fear or uncertainty leaving a lot of potential profit on the table so how do you stay in the trade with confidence and capture the full Trend without second guessing yourself that's exactly what I'm going to teach you in today's session I'll break it down step by step and show you a live example so you can see this strategy in action and understand how to apply it in real time make sure to watch till the end because this strategy could be the key to unlocking
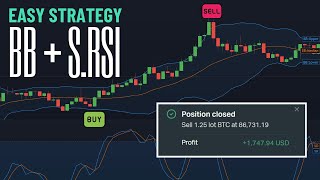
uh consistent big profits in your trading Journey all right let's get started with setting up our chart for this powerful strategy the first thing we need to do is add two important indicators that will help us identify high probability trade setups these indicators will give us a clear picture of Market movements and help us make confident trading decisions go to your trading platform's indicator search bar and type in Bullinger bands once you see it in the search results click on it to add it to your chart next let's add the Bullinger bands sent B indicator
this indicator Works alongside Ballinger bands and tells us where the price is in relation to the bands it helps in spotting strong Trends and confirming entry and exit points Binger band are a fantastic tool that help us understand Market volatility overbought and oversold conditions and possible breakout points once both indicators are added to your chart you'll start seeing how they work together to highlight the best trading opportunities now that we have added both Ballinger bands and Binger bands sent B indicators to our chart let's make the setup even more organized and easy to read by
default when you add the Binger bands indicator it appears on the main price chart where the candles are displayed how however to make analysis easier and keep our chart clean we need to move the Binger bands to the same Paine as the Binger bands sent B indicator here's how to do it click on the settings gear icon or the small 3 dot menu next to the indicator name look for an option that says move to New pain or move to existing pain depending on your trading platform now both indicators should appear in the same lower
pain below the main chart making it easier to analyze their relationship by doing this we get a a clearer and more focused view of how the Binger bands and scent B indicator interact this will help us quickly spot Trend reversals breakouts and ideal trade setups without any distractions from the price chart once you've successfully moved the indicator you're all set for the next step understanding how to use these tools to capture the full Trend with confidence sometimes the default colors of indicators can blend in with other elements on the chart making it harder to read
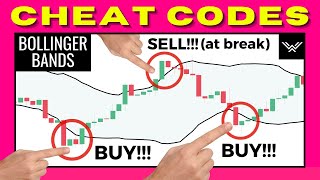
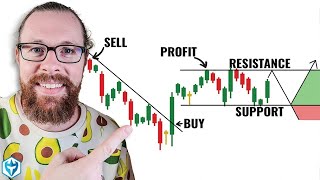
the signals properly to fix this I'm going to change the color of the Binger band sent B indicator to make it stand out better now the Ballinger band scent b line is much clearer and easier to follow helping us make better trading decisions the black line which represents the Binger bands sent B indicator helps us understand where the price is in relation to the upper and lower Binger bands this gives us a clear signal about the strength of a trend here's what we need to watch for when the black line crosses a above the upper
Ballinger band it indicates a strong uptrend this means the price is breaking out above the normal range and there is strong bullish momentum this is our signal to enter a Buy trade once we have entered the Buy trade we stay in the trade as long as the black line remains above the upper band this helps us ride the full Trend and maximize our profits we exit the trade when the black line crosses back below the upper Binger band this signals that the bullish momentum is fading and the price might start pulling back back or consolidating
as we can see when the black line pierces above the upper Binger band The Market starts it's moving up strongly this confirms an uptrend and we enter a Buy trade right here we hold the position and let the trend continue as soon as the black line crosses back down below the upper band we exit the trade and lock in our profits before the trend loses strength this simple yet effective approach ensures that we are only trading strong Trends and not exiting too early which is a common mistake many Traders make now that you understand how
to use this setup for buy trades let's move on to the next part how to use the same method for sell trades in a downtrend now take a look at the chart the black line has just crossed below the lower Bullinger band this is a clear sign that the market is entering a strong downtrend since we have confirmation of bearish momentum I take a short trade here to ride the trend down when the black line crosses below the lower ball band it indicates a strong downtrend this tells us that the price is breaking below its
normal range and sellers are in control this is our signal to enter a short trade because the market is showing weakness and there is potential for further downside Movement we stay in the trade as long as the black line remains below the lower Ballinger band this helps us capture the full Trend and avoid premature exits we exit the trade when the black line crosses back above the lower Binger band this signals that the bearish momentum is weakening and the price might start reversing or consolidating as the price continues to drop the black line remains below
the lower band confirming that the trend is still strong this approach ensures that we are trading with the trend and not against it allowing us to take advantage of strong Market moves with confidence now before we move forward there's something very important you need to understand if you look at the chart you'll notice two colored zones the green zone at the bottom this is called the oversold Zone the red zone at the Top This is called The overbought Zone when the blackcent be line enters the green zone it means the price has dropped significantly and
is trading near the lower Ballinger band this signals that the market is oversold meaning sellers might be exhausted and a reversal to the upside could happen soon however we don't immediately exit just because the prices in the green zone we wait for confirmation such as the black Line crossing back above the lower Ballinger band before closing this cell trade a common mistake Traders make is jumping into trades too early just because the market reaches the oversold or overbought Zone but remember just because something is oversold doesn't mean it will immediately go up and just because
something is overbought doesn't mean it will immediately go down instead we use these zones as a warning sign that a reversal could happen soon and we wait for confirmation before making our move now let's take a closer look at the indicators and see what's happening in real time the blackcent B line has now crossed back above the lower Bullinger band this is exactly the confirmation we were waiting for as we discussed earlier when the black line enters the green oversold Zone it signals that the market is in a downtrend but a potential reversal could be
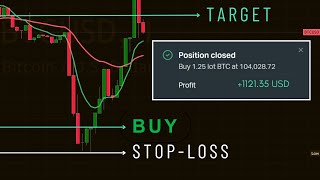
on the horizon now that the black line has moved back above the lower band this tells us that the selling pressure is weakening and the price is likely to start moving back up this is our signal to exit the trade and secure our profits I am now closing the trade with a solid profit of over $4,000 this is why it's so important to follow a structured trading plan instead of making emotional decisions we entered the trade based on a strong downtrend signal stayed in as long as the black line remained below the lower band and
exited only when we got confirmation of a potential reversal this strategy helps us maximize our profits while ensuring we don't stay in a trade for too long and give back our gains that's it for this video if you found this helpful don't forget to subscribe for more trading strategies like this video If you enjoyed it share it with fellow Traders drop a comment below if you have any questions or thoughts I'd love to hear from you see you in the next one and happy Trading
Related Videos
9:13
Bollinger Bands & Stochastic RSI - Live Tr...
GeekOnDaily
881 views

19:25
NEW GROK 3 AI from Elon's X Good For Creat...
Michael Automates
115,787 views

16:25
SAVAGE: Trump’s Press Secretary SHUTS DOWN...
orgutarifleri
976,524 views

11:28
5 TradingView Indicators I’d NEVER Share P...
Magic Indicator Strategies
42,411 views
12:42
1 Indicator, 3 Uses! Most Powerful Trading...
PineTrades
557,550 views

19:26
My Scalping Strategy is Boring, But Makes ...
Scarface Trades
179,690 views
10:44
Master This RSI Scalping Strategy – Live T...
GeekOnDaily
10,613 views

10:32
This Indicator PREDICTS Market Bottoms wit...
Data Trader
140,491 views

18:16
Even US Shocked by EU’s Surprise Ukraine D...
The Military Show
1,115,434 views
12:47
My EMA Trading SETUP You NEED to Know! - ...
GeekOnDaily
8,085 views
20:22
ULTIMATE Bollinger Bands Trading Course (I...
Wysetrade
768,485 views
16:25
I Made My First $100K Trading One Simple 5...
Garland Trader
21,719 views
15:01
One Trading Strategy For Life | 100% HIGH ...
Stacey Burke Trading
32,444 views
45:19
The Only Bollinger Bands Trading Video You...
Mind Math Money
22,959 views
55:18
How to Read Candlestick Charts (with ZERO ...
Ross Cameron - Warrior Trading
3,158,997 views

11:21
STOP Using The MACD! Try THIS Indicator In...
Data Trader
1,669,201 views

36:05
Pairs-trading strategy from scratch in Python
Algo-trading with Saleh
96,287 views

21:52
Jon Stewart Reworks Trump & Elon’s Sweepin...
The Daily Show
5,848,113 views
9:19
EMA Trading Tip - Spotting Reversals with ...
GeekOnDaily
7,060 views

8:39
20 EMA High & Low Trading Strategy – Live ...
GeekOnDaily
81,586 views