Fatigue (Strength-Number of Cycles) SN-DIAGRAMS in Under 10 Minutes!
95.87k views1491 WordsCopy TextShare
Less Boring Lectures
Endurance Limit,
Stress-Life Method,
Idealized SN Diagram,
Fluctuating Stresses,
Completely Reversed...
Video Transcript:
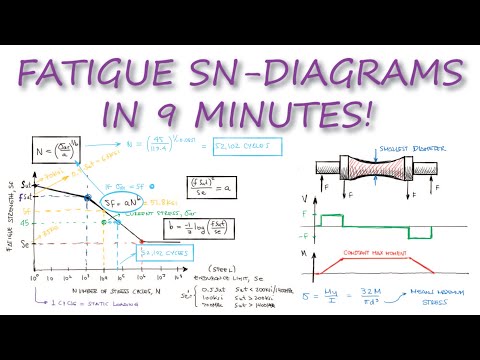
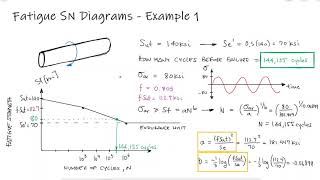
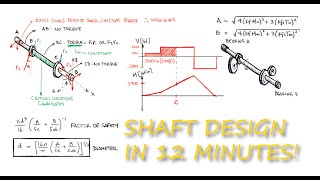
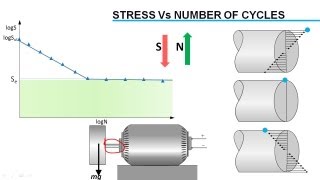
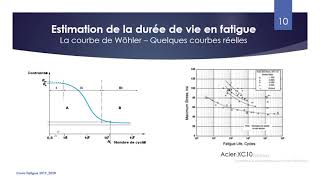
when the stress out a notch crack or other locations of stress concentration exceeds the yield strength plastic deformation happens this plastic strain together with fluctuating stresses is enough for a part to develop microstructural flaws that eventually lead to failure as opposed to a failure approach that we studied in the last two videos where we try to calculate crack growth and critical crack lengths that lead to fracture failure fatigue fracture does not use concepts from fracture mechanics such as crack length or fracture toughness fatigue failure predicts life by comparing the intended operation of your design to the behavior of test specimens that have been experimentally recorded more importantly fatigue approaches don't try to calculate a quote unquote real stress corrected by stress concentration factors that increase with time due to imperfections that develop with operation to compare them to an ultimate strength either instead in the stress life method for fatigue calculations we compare nominal stresses that can be calculated using everything we've learned so far and that are kept unchanged over time to a strength property that decreases over time or more precisely a property that decreases as loading cycles occur we call this property the fatigue strength this practical approach to estimating fatigue life consists on being able to adapt any kind of fluctuating stresses to the empirical results of a very standardized test for a given material so let's take a look at a specimen subjected to cyclic loading between two stress levels commonly called constant amplitude loading and let's start by defining a couple of terms that we will be using regularly the mean stress is written as sigma m and it's the average between the minimum and the maximum stress and the alternating stress or stress amplitude is of course the amplitude or the distance between the minimum the maximum stress over two we call fluctuating stresses of constant amplitude a completely reverse stress when the mean stress is zero since the minimum stress value is just a negative value of the maximum stress these completely reversed stresses are pretty common and will be useful for many of the applications we will study in this course like for example shaft design where bending stresses vary from negative to positive sigma continuously while rotating this notion is exactly what we use to experimentally measure this fatigue strength property that i mentioned before a bending machine is used on a specimen to cause a known bending stress that is highest at the center if we look at a quick transfer shear and bending moment diagram we see that the moment is constant throughout the middle section and because the cross-section area is smallest at the center the maximum bending stress will occur exactly there since the specimen is constantly rotating a specific point on the surface of the rod will go from a positive normal stress tension to a negative normal stress compression of the same stress value and of course everything in between if identical specimens are tested using distinct stress values until they break we would see that the specimens that are subjected to completely reverse stresses of low magnitudes break after many cycles while specimens subjected to completely reversed stresses of higher magnitudes break after fewer cycles if we do this for several values of alternating stress we develop a plot that we call the sn diagram sometimes but not often called volia curve or stress life diagram where the y-axis which records the stress that was used and ultimately made the sample fail for a specific number of cycles is called the fatigue strength failure with less than one thousand cycles is usually classified as low cycle fatigue and failure with over one thousand cycles as high cycle fatigue for some materials that never fail for stress levels below a certain threshold and by never we usually mean 100 million to 1 billion cycles as it would be impossible to test for infinite cycles the fatigue strength value for that threshold is called the endurance limit stress values below the endurance limit will quote unquote guarantee that the part will have infinite life depending on the material the values for this curve will obviously change and actually for some materials there is no such thing as an endurance limit like aluminum alloys for example however the overall behavior or shape of this plot is similar and for this reason for preliminary and prototype design a simple idealized yet conservative version of the sn diagram is very helpful the low cycle region for 1000 cycles or fewer is represented by a line that has a gentle slope and that runs between the ultimate strength to a fraction f of the ultimate strength an initial fatigue strength of sut makes sense since for a one cycle stress meaning static loading would require the stress to reach or exceed the ultimate strength for it to fracture the values for f are usually a function of the ultimate strength and they are usually found by curve-fitting experimental testing they can either be the equations from the curve fit or the curve itself the second line for high cycles before infinite life goes from fsut to the endurance limit the endurance limit can be estimated for steels as half the ultimate strength for suts below 200 ksi or the equivalent 1400 megapascals and 100 ksi or 700 megapascals for any material that has a higher ultimate strength relationships to find both f coefficients and endurance limits for different materials can be found online or in textbooks and engineering handbooks one of the most important capabilities from this idealized and again conservative diagram is being able to relate fatigue strength to number of cycles especially for the high cycle region since this region is represented as a straight line in a log log scale we know that sf is equal to a times n to the b just like we did in our previous video of crack propagation link in the description below if the fatigue strength sf is equal to fsut for n equal to 10 cubed and sf is equal to s e for n equal to 10 to the sixth we obtain two equations with two variables a and b if we divide the equations we find an expression for b and if we square the first equation and divide again we find an expression for a if we're looking to find how many cycles apart would last for a specific completely reversed stress we can assume that the part will fail when that stress sigma ar is equal to or exceeds the fatigue strength sf and solve for n the n diagram only applies to completely reversed stresses but in future videos we will see how to transform any fluctuating stress to make use of the sn diagrams let's take a look at a quick example a rotating beam made out of a 1020 steel has an ultimate strength of 70 ksi if the specimen is subjected to a completely reversed stress of 45 ksi what would the factor of safety be for 10 000 cycles and separately how many cycles would it endure before failure the first thing i know is that the estimated endurance limit is 0. 5 the ultimate strength since the ultimate strength is below 200 ksi the f factor for a steel with an ultimate strength of 70 ksi would be 0. 9 by using the expressions that we just derived i find that the coefficient a is equal to 113.
4 ksi and the b coefficient is equal to minus 0. 085 therefore for 10 000 cycles the fatigue strength would be equal to 51. 8 if the beam is being subjected to a completely reversed stress of 45 ksi and the fatigue strength is 51.
8 then the factor of safety is 1. 15 if i take a look at the sn diagram to see what i just did i would see that for 10 000 cycles the fatigue strength is 51. 8 but i'm only subjecting the specimen to a stress of 45.
Related Videos
2:53
Fatigue SN Diagrams - Number of Cycles to ...
Less Boring Lectures
27,015 views
11:35
Fatigue FAILURE CRITERIA in Just Over 10 M...
Less Boring Lectures
73,763 views

8:23
Understanding Fatigue Failure and S-N Curves
The Efficient Engineer
552,463 views
1:03:57
Introduction to Fatigue: Stress-Life Metho...
TheBom_PE
95,189 views

12:01
Fatigue Test
MaterialsScience2000
455,511 views
8:09
CRACK PROPAGATION and Paris Equation in Un...
Less Boring Lectures
25,659 views

17:58
The Incredible Strength of Bolted Joints
The Efficient Engineer
3,161,204 views
12:34
Marin Factors for ENDURANCE LIMITS in Just...
Less Boring Lectures
18,248 views

11:15
Fatigue STRESS CONCENTRATIONS in Just Over...
Less Boring Lectures
30,850 views
33:37
Goodman Diagram Design Example
Dr. Cyders
108,886 views
1:00:54
Midrange and Alternating Stress | Goodman ...
TheBom_PE
48,444 views
11:59
Shaft Design for INFINITE LIFE and Fatigue...
Less Boring Lectures
91,081 views

7:13
SN Curve (Fatigue Curve) - Theories of Ela...
Ekeeda
140,890 views
6:32
Fatigue Failure Analysis
Sabins Civil Engineering
386,070 views

17:34
ADHD Is a Curse… Until You Learn This
ADHDVision
443,714 views
46:43
Comparison of Fatigue Analysis Methods
nCode Software
7,760 views

19:17
Basic Fatigue and S-N Diagrams
Dr. Cyders
182,606 views
7:32
FRACTURE TOUGHNESS and Crack Modes in Und...
Less Boring Lectures
24,942 views
33:31
COURS 2 : ESTIMATION DE LA DUREE DE VIE EN...
Elminor Hassan
13,084 views