The CASH FLOW STATEMENT: all the basics in 9 minutes
61.8k views2049 WordsCopy TextShare

Long Term Mindset
📈 Check out Finchat for FREE!: https://finchat.io/brian/
▼FREE ACCOUNTING INFOGRAPHIC EBOOK:▼
🧑�...
Video Transcript:
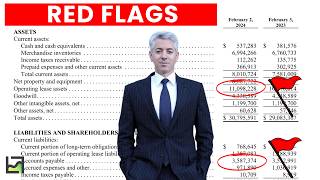
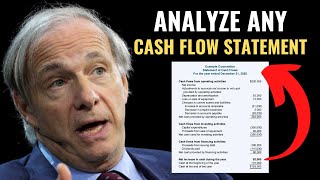
imagine if you could quickly tell if a company was a cash flow machine or a cash burning dumpster fire believe it or not but you can do that in just a few seconds by analyzing its cash flow statement but what is a cash flow statement and how do you read it in this video I'll explain the layout of a cash flow statement the key terms to track and tricks to analyze it fast all in less than 10 minutes hi my name is Brian Feroldi I'm a financial educator who's been analyzing and investing in individual businesses for more than 20 years the clock is ticking so let's get going so what is a cash flow statement it's a financial report that shows how cash moves throughout a business over a specific period of time usually a quarter or a year its primary purpose is to show if a company is producing cash or consuming cash the cash flow statement answers the question are you generating cash or are you consuming cash like the income statement the cash flow statement is measured over a period of time so there's a start time and an end time to the cash flow statement the cash flow statement can be broken down into three primary sections there's operating activities investing activities and financing activities let's take a look at the cash flow statement of a pretend business I made up called best coffee company now at the very top of the cash flow statement is the company's net income this number is actually borrowed from the bottom of the income statement which shows just how tightly these two statements are related to each other now once we start with net income the first thing we have to do is add back any non-cash charges non-cast charges could be things like depreciation amortization or stock-based compensation now the reason we add these back is on the income statement these non-cash charges were accounted for in cost of goods sold and operating expenses but remember they were noncash so since cash didn't leave our bank balance we need to add them back in when accounting for them on the cash flow statement the next line item here is changes in working capital these could be cash movements due to changes in receivables accounts payable or inventory during any given period these numbers can flow up or down on the company's balance sheet and depending on the direction they could be producing cash or consuming cash once we add up all of these lined items together we get the total amount of cash that flowed to the business due primarily to the company operating itself the next section is called investing activities and this is how the company uses its cash flow to make investments in the business the most important line item here is something called Capital expenditures which is all spending done on property plant and Equipment this could be building stor or paying for furniture or equipment used in the business the next line item here would be Acquisitions where we would account for any cash payments that we made to acquire another company the final item here would be sale of Investments so if we sold one of our assets such as capital expenditures or one of our Acquisitions that would generate cash due to investing the next thing we do is we add up all of the sources of cash from investing activities we add them together the final section is called financing activities and there's a number of ways that we could add or subtract cash to our balance sheet based on what we're doing with financing the first major category here is are we borrowing money or issuing debt that would create cash or are we repaying debt that would consume cash the next major category relates to our stock if a company is issuing stock and selling it to investors that would create cash or if the company is repurchasing stock from those same investors that would consume cash the final category here relates to dividends if a company is making dividend payments to its shareholders that activity would consume cash then we simply add up and subtract all the sources of cash due to financing activities now once we've done all that we take the cash flow from operating activities we add it to the cash flow from investing activities and we add that to the cash flow from financing activities that gives us our total amount of change in cash during that particular period Then when we add that change in cash to what we started with we end up with our ending cash balance and this number goes right to the balance sheet and becomes our new cash balance at the end of the period showing once again and how these statements are related to each other now it's important to understand that not all companies use these exact terms and layouts when they're making their financial statements in fact not all companies even call this financial statement the cash flow statement for example I've seen the cash flow statement called the statement of cash flows the financial flow statement the statement of cash operations or even the operating cash flow statement in fact here is a visual that shows some of the different terms that you might see on a cash flow statement itself and this is true of all the financial stat statements where the terms you might see on them vary greatly from company to company now if you're interested in learning more about these terms I created a free ebook called financial statement school that will allow you to download these visuals so you can understand all the financial statements visually to grab a free copy of this ebook just visit the link you see on your screen or click the link in the video description now there's another critical term that you get from reading a cash flow statement but it's not specifically called out on the cash flow statement that term is called free cash flow this is the total amount of free cash that a business generates and can be used to reward its shareholders calculating a company's free cash flow is fairly simple you simply take the total cash flow from operating activities and then you subtract the spending on Capital expenditures this simple calculation will give you the total amount of free cash flow that a company generated During the period now the cash flow statement that I showed you only had one year of data for Simplicity however cash statements usually have multiple years of data on them which can help the investor spot Trends here for example is three years worth of financial DeMent for best coffee company now when it comes to learning how to analyze a cash flow statement there are five key numbers that I look at first the very first number that I pay attention to is the cash flow from operating activities this is the total amount of cash that was generated from operating the business in this case we see that cash flow from operating activities is consistently growing the second number that I pay attention to is the company's Capital expenditures or spending on property plant and equipment in this case we see that this company is continuing to increase its capital expenditures from $1,000 all the way up to $2,000 the next number that I like to focus on is a company's cash flow related to debt in this case we see that this business has repaid in two separate tranches $1,000 worth of its debt which means that it's deling its balance sheet which I view to be a good thing the next number that I pay attention to is the amount of stock that a company is either repurchasing from its investors or issuing to those same investors now the final number that I always pay attention to is in the non-cash charges section and specifically I like to focus on how much stock-based compensation a company is issuing to its employees I want to make sure that this number is reasonable when compared to the company's size and that it's not over ISU stock to its employees now that you know the five key numbers to look at let's take the look at the cash flow statement of a real company to see these numbers in action here is the cash flow statement of Dollar General a retailer in the United States the first thing to note is the direction that we're looking at here in this case the right hand side is the oldest data and the left hand side is the most recent data so we're going to be reading this cash flow statement from right to left the other thing to note is that this company's net income which is taken directly from the income statement has actually dropped from 2. 4 billion down to 1. 7 billion during this particular time frame all right with that in mind let's take a look at those five key numbers on the cash flow statement that I teed up before the first number to look at here is the cash provided by operating activities this is the cash flow of The company generated from operations notice that this figure was $2.
9 billion do in 2022 and this dropped all the way to $2. 4 billion by 2024 so the trajectory here is downward the second number to pay attention here is the company's spending on Capital expenditures which it calls purchase of property and Equipment this figure was just $1 billion in 2022 but it's increased to $1. 7 billion in 2024 this is most likely to be money spent on building and opening new stores now with these two key numbers in hand we can actually calculate this company's free cash flow if we subtract purchase on property and equipment from cash FL operating activities we said that in 2022 this company was generating $1.
8 billion in free cash flow but that dropped all the way to $600 Million by 2024 this is a trend that is definitely not favorable for investors now once we know the company's free cash flow the next number that I like to pay attention to is the debt balance notice that in 2022 the company wasn't doing much with its debt neither issuing it or really repaying it that changed greatly in 2023 when the company issued almost $4 billion in new debt and it repaid about $1 billion in debt that means that this company issued a net $3 billion in debt during this period in 2024 we saw the company issue about $2 billion in total new debt but it also repaid about $2 billion in total debt so the company's debt balance didn't change much during 2024 now from there the next number I pay attention to is what the company is doing with its stock in this case in 2022 we see that the company bought back about $2. 5 billion in stock from its invest investors in 2023 the company bought back $2. 8 billion worth of stock from the public markets however the company did not buy any stock back at all during 2024 now the fifth and final number that I pay attention to here is the company's issuance of stock-based compensation we see that this number was $78 million in 2022 and it declined all the way to $51 million in 2024 now $51 million might sound like a lot but when compared to $1.
Related Videos

11:21
EBITDA vs Net Income Vs Free Cash Flow Exp...
Long Term Mindset
565,166 views

8:27
Warren Buffett: How To Analyze a BALANCE S...
Long Term Mindset
1,040,060 views

13:26
Cash Flow Statement Basics Explained
Leila Gharani
1,071,099 views
6:21
Balance Sheet Red Flags (4 Warnings Signs)
Long Term Mindset
68,999 views

18:49
Free Cash Flow Explained
Long Term Mindset
27,130 views
9:58
The INCOME STATEMENT Explained Simply
Long Term Mindset
14,647 views
21:42
Discounted Cash Flow | DCF Model Step by S...
Kenji Explains
1,059,289 views
12:32
Prepare Cashflow Statement in 10 Minutes: ...
The Financial Controller
123,426 views

30:28
Financial Statements Explained | Balance S...
365 Financial Analyst
158,703 views
32:26
Build a Dynamic 3 Statement Financial Mode...
Kenji Explains
1,181,170 views

15:10
The CASH FLOW STATEMENT for BEGINNERS
Accounting Stuff
1,095,925 views

10:49
WARREN BUFFETT: Stop Watching EPS
Long Term Mindset
62,365 views
27:16
Advanced Statement of Cash Flows (Indirect...
TLC Tutoring
27,094 views
16:12
How to Analyze a Cash Flow Statement Like ...
Investor Center
729,076 views
7:24
Reading Income Statements Is EASY When You...
Long Term Mindset
13,320 views
9:28
How To Read Financial Statements In 9 Minu...
Long Term Mindset
28,397 views

1:01:51
Exposing the TRUTH About Roth vs Tradition...
The Retirement Nerds
1,488,666 views

30:15
Stock Valuation Lecture: How We Value A Bu...
Long Term Mindset
33,432 views

14:42
My Data-Backed Investing Plan for 2025
Long Term Mindset
28,852 views

12:39
Free Cash Flow explained
The Finance Storyteller
151,800 views