I Found an UPGRADED Version of The Heiken Ashi
141.11k views1232 WordsCopy TextShare
TradingLab
The Heikin Ashi is a very popular indicator. Whether you've used it or not, it's a great weapon to a...
Video Transcript:
You NEED to stop using the heiken ashi RIGHT NOW! I found an indicator that is infinitely better than the heiken ashi. The heiken ashi, is an indicator that a lot of traders use to find the general direction of the market.
Clearing out the noise of regular candlesticks. But what if I told you I found a secret indicator that performs WAY better than the normal heiken ashi? Actually to be specific, I backtested this indicator and its 2x more profitable than the normal heiken ashi.
Ope, come, come on back. There ya go. This indicator uses I m gonna share with you what the indicator is, how to use it to its best potential, and I m even going to share with you a profitable strategy with this indicator.
Lets get straight to it. Okay, so is your typical normal candlesticks. Where there s a bunch of red and green everywhere and the chart is pretty hard to tell which way the price is heading with all the noise.
This is bad because it could lead to false signals. This is a chart with the heiken ashi. It eliminates the noise to where the candles are replaced and you can clearly see which direction the market is heading.
Making it easier to read the chart. But this indicator isn t perfect *gasp* One of the main issues with the heiken ashi is it doesn t provide the juicy information normal candles sticks do. It only provides the smoothed out version of the price, not the real price.
For example: Finding chart patterns or key areas of support or resistance. That s until god himself made this new secret indicator. Actually, his name is jackvmk.
But you get my point it s a good indicator. Now the reason this indicator is so good is because instead of replacing your candlesticks it just adds a heiken ashi overlay so you can see both the price action of the candles AND the heiken ashi all in one so you get the best of both worlds. Another great thing about this indicator is it s way better at not providing false signals compared to the normal heiken ashi.
For example, this is a chart with the normal heiken ashi. As you can see it provided a lot of green candles in this uptrend but then it placed some red ones where it could easily fake you out and make you sell early. Now this is the same exact chart with the improved version of the heiken ashi and as you can see it only provided green candles.
So, there s no fakeouts and you would of made way more profit on this trade. So now that we know why this indicator is good, lets add it to our chart and give you the best possible settings for this indicator. I ll be using tradingview as my charting platform.
If you don t yet have it, ill leave a link in my description. Go to the indciators tab and type in smoothed heiken ashi and click this one by jackvmk Next go to the settings. Alright now the optimal settings depends on what type of trader you are.
If you re a short term trader, I would recommend changing these two settings to 5 and 5. As this makes it better at analyzing short term price movement. If you re more of a long term trader, change these settings to 20 and 20.
As that will make it better at finding long term trends. For the sake of this video though, we are going to be somewhere in the middle so we are going to keep it at default at 10 and 10. So this how I use the indicator.
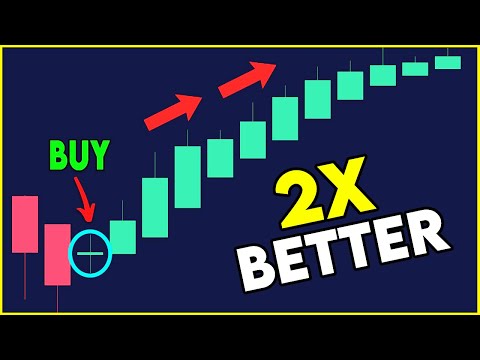
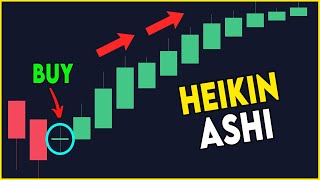
Green candles signals an uptrend. Red candles signals a downtrend. This means it s great for signaling possible reversals.
For example here, the market is in a downtrend signaled by these red heiken ashi candles. But then all of a sudden we got a green candle. Signaling a possible market shift.
Then the market heads upwards. But here s a secret trick you can use in order to raise the chance of you finding these perfect revsals. You can use the size of the heiken ashi candles as a way to identify strength.
For example, here the candles start off small and starts to slowly get larger and larger. Signaling the market is gaining momentum and strength. Same thing with weakness.
If the candles start to get smaller. You can easily identify the market is losing momentum and is getting ready to reverse. So as an example.
Here the chart is in a downtrend signaled by the red candles, but you can start to see the candles are getting smaller and smaller, showing its losing the downwards momentum. Then we get a green candle. This signals a market shift is likely to occur, which is exactly what happens.
So now you know the basics. You know why this new indicator is better than the normal heiken ashi And where to begin to start reading it Now it s time to get into some actual profitable strategies using this amazing indicator. But first.
Let s get into some of my favorite strategies with this indicator. Now I want to make this clear. You shouldn t just enter a long trade because the heiken ashi turns green and enter a short position just because it turns red.
This will not work in the long term. Instead, you should do this. First you want to find a strong downtrend.
Again, we can do this by finding red heiken ashi candles and we want to see the candles getting larger and larger. Signaling this is a strong downwards trend. The next step is finding a trend change.
We can do that, by seeing the red candles start to get smaller and then a color shift from red to green. But you aren t going to enter yet. Instead, we are essentially going to use the new heiken ashi candles as a support.
Wait for price to do a pullback and come back down to the heiken ashi candles. But we still need a little more confirmation. Wait for price to show its going to respect this area by giving a green candle.
Once we get the green candle, we can now officially enter the trade. Set your stop loss at the low of where it the heiken ashi candles earlier. And set you take profit to a 1.
5 risk to reward ratio. You are then going to wait for price to hit your take profit. But we aren t don t yet.
Once price hits your take profit, sell half of your position for guaranteed profits. Then, move your stop loss to your entry. We are then going to wait for the heiken ashi to turn red to sell the rest of our position.
Once it does. Exit the trade fully for some really nice profits. This is a beautiful strategy.
I absolutely love using it. Test it out and let me know how it worked for you on Instagram. Next we are going to over how I made over $70,000 in 60 days using this specific strategy.
This one, is one of my favoirts I use every day. Thanks for watching and ill see you guys next time!
Related Videos
18:24
Heikin Ashi Charts 🔥| "Learn to Ride mass...
Fortune Talks
318,967 views

11:14
STOP Using the Heiken Ashi! This Indicator...
Data Trader
706,008 views

14:39
How to use these 3 Heikin Ashi Charts to C...
Prateek Singh - LearnApp
1,087,858 views
5:24
This Indicator Predicts The Future
TradingLab
355,964 views
![I Found an Upgraded Version of The MACD [INSANE]](https://img.youtube.com/vi/auK8PGULXXw/mqdefault.jpg)
12:32
I Found an Upgraded Version of The MACD [I...
TradingLab
369,512 views

16:24
🔴 EMA-Heiken Ashi | This is The Trading S...
Trader DNA
2,544,284 views
8:02
This Smoothed Heiken Ashi TradingView Indi...
Magic Indicator Strategies
200,268 views

7:41
How She Made MILLIONS Using The MACD
TradingLab
190,520 views

55:11
The ONE Simple Candlestick Pattern You NEE...
Ross Cameron - Warrior Trading
672,428 views

16:52
🔴 M5 HEIKEN ASHI SCALPING STRATEGY **HIGH...
Trader DNA
200,011 views

8:29
The Strategy That Made Him $1.1 Million In...
TradingLab
879,824 views

16:04
What Do Hedge Funds Think of Technical Ana...
TradingLab
1,172,630 views

21:58
The ONLY Technical Indicator You'll EVER N...
Ross Cameron - Warrior Trading
318,246 views

14:55
Super Accurate Heiken Ashi Strategy | BEST...
FXSMART
7,640 views
10:10
Heiken Ashi CHEAT Strategies For Scalping ...
The Secret Mindset
1,110,446 views

8:20
Get PERFECT Entries Using Fibonacci Retrac...
TradingLab
208,674 views

14:15
Revealing My Heikin Ashi Trading Strategy ...
Chad Trades
27,872 views

14:11
The Math Equation That Beat Wall Street | ...
Chaos Theory Institute
255,572 views

6:52
How I Made $70,536 Day Trading in 60 Days
TradingLab
123,543 views
6:05
The Heikin Ashi Trading Strategy (Simple &...
TradingLab
494,529 views