Become A Swing Trading Wizard | VectorVest
6.34k views6243 WordsCopy TextShare
VectorVest
A Swing Trade is one in which you own stocks for a few days, possibly a few weeks if the stock marke...
Video Transcript:
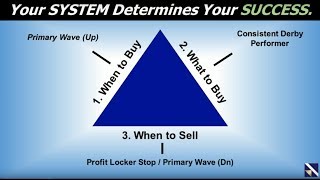
[Music] all right hello everyone and welcome to this week's special presentation become a swing trading wizard my name is steve chapel the director of trading systems development here at vector vest and i'm delighted to be your host for this presentation because boy do i have a very robust trading system to share with each and every single one of you here today and so let's get right to it yeah i like to hit you with the proof is in the pudding right up front what you're looking at here is not a back test this is taking a screenshot taken from robert trader and you're looking at an 83 return since october of 2019. there are some things to talk about you know because we've done this same presentation several times over the last three years as we've been running this same methodology for three consecutive years almost it will be in april of this year and this has been our experience we've been clocking a 50 to 60 percent annualized rate of return for the last three years consecutively and it very much moves in the same kind of fashion that you see on this chart so that's really nice because i want to give you a little bit of a walkthrough of the experience here you know if you start on the left hand side of the chart and kind of work your way across you will see some rather big jumps you know times where the stocks that are going to be in this portfolio just explode there are going to be times where we trade through you know a bit of back and forth and once we get on the other side of it you know it explodes again and so that is the nature of the system that we're going to be describing but what is really nice to share with you is that this isn't just our experience from again this past year it's been our experience ever since we turned at least as an idea back in april of 2018 and so it's worth talking about you know it really is and so we're going to do a lot more of it another thing that i want you to pick up on this graphic if you draw your eye to where my cursor is right in the middle of the equity curve here and we look at the covid situation you know here is a trading system that was able to cope with that whole situation very very well indeed where we only experienced a 6. 95 drawdown uh as a result of that entire experience you know and so this is a system that will keep you out of harm's way when thing when you know the market comes off its rails and boy when it starts to really cook you know it's going to take advantage of it and take advantage of it quickly and those are the main messages i want to get across here early there's a lot more to talk about we're going to talk about how we get got here and you know hopefully share with you something that you'll consider doing yourself right so let's get right to it this system is going to be comprised of three cornerstones is how i like to lay it out and so your system folks is going to determine your success i just want to get that out of the way quick and that is systematic is the way to go for most folks because you can just rely on the system to carry you through no matter what the market throws at you right and so our three cornerstones are going to be when to buy when do i start buying stocks at all what do i buy and finally maybe the most important right when do i sell to capture those profits or even potentially cut losers early right so let's talk about how we get there and we're going to break it down piece by piece okay so first thing is we follow the primary wave what's called the primary wave in vector vest and that's the backbone of the entire system it truly is that's where a lot of the magic occurs now there's more to it there's going to be some some other magic that's going to come into play here as well but that really is what allows us to get these kinds of returns because when a mark when the market turns you know it's very quick to signal hey you know the market's turning and it's time to start buying stocks also when the market's turned down it's very quick to help us get out of our portfolio and get out of harm's way so real quick let's go take a look at the primary wave and hit that point home so if we come over here into vector vest i'm going to go right up to the top to the timing tab okay and from the timing tab we'll go to the market timing graph all right now when i get here i'm going to go back to about a year so you can get some idea here because i want to scroll back and maybe the best place to start is how in the world did you guys stave off all the potential losses back when covet hit or really began to hit right so if i come to the bottom here we can of course click on something called the primary wave and when i do that i want you to focus on a few things here okay so a green arrow is an arrow in which we look to go long the following day if the market is rising and we go and buy 10 stocks if it is and we use a search based upon something we'll tell you about here in just a little bit okay that search can change and often does campaign to campaign so there's the chance that for each one of these green arrows we could be using a completely different search okay but for now let's keep the focus on the timing so as i mentioned when a green arrow is issued we look to go along the following day if the market continues to rise okay when a red arrow is signaled that's a date in which we look to close down the campaign the following day if the market follows through to the downside which you can see it did here on 224 and that's how we were able to stave off all the rest of you know sort of the debacle i guess i would say at this point right and then get us in very quickly when the market started to rally now a lot of times when you have a huge market sell-off like this you'll have a quick sharp rally for a few days and then kind of a retreat and then it really gets moving and that's sort of what happened here so we did move to a cash position because you absolutely never know that that's going to be true right and then got back in and this is where the portfolio really began to take off was back in you know april uh but again it's going to do this not just this past year you know but any year going forward and so if we you take a look at where we are today we've had several different campaigns and you can the the thing i want you to observe is look at where price is when the green triangles appear and where price is as the red triangles appear and what you see is a system that keeps you on the right side of the market far more often than not and that's what you need to move the needle the way we do with these kinds of returns okay and when i say that i mean year in and year out okay now there's going to be further questions to address one thing i do want to get out of the gate here while we're on this graph because i think it might help is whatever search we start a campaign with we continue to use that same search for the duration of the campaign it can only change from campaign to campaign okay so there's no reset on the search until you complete a cycle from green to red then you could potentially use a new search on the following green depending on what we'll show you next all right so let's get to that so the next thing we're going to talk about is what search to use and what we're going to be using is the consistent derby performer and i know we're going to have a great write-up in the vector vest views this evening centered around the vectorvest derby and what we're going to be showing here is a different perspective and how we come up with the best search for this particular way of trading the derby okay now the whole the key here is that first word consistent that truly is the key so let's get to it okay so i'm going to go back to vectorvest here of course i'm going to go right up to the derby tab and from the derby tab here is where the magic happens in terms of stock selection you know dr deleto and i traveled around to countless numbers of seminars and events at this point over my goodness i've been here almost 20 years you know it and the single most frequently asked question i think either one of us or anyone here you know ever received was guys you got all these searches in vectorvest which is the one i should use right now you know and while we always know there's about a baker's dozen or so strategies that we really love you know like a hottest grow stocks or seattle bear beater you know and things of that nature there's no guarantee that that's going to be the best pick the next time you think about using it right and so we came back and we said you know guys we need a tool right that can help us address the single most asked question we ever received and that that's what you're looking at here okay so what this does it takes the best quality searches we have in the entire unisearch tool of which there's i think just over 200 that we're looking at at this point okay and what we do then is we have the ability to monitor the search performance and what we do is we look at up to 10 stocks as if you were to buy a 10 stock basket in any strategy what it allows you to do then is see what the performance is over any time interval you want over the past 90 days what you're looking at right now is a singular day we're looking at the market open this morning to where we are now and you know you've got ballistic new highs right up here at the top so if i click in there i can see what stocks are in that strategy and you see a boy b square and li zi and transentarix those stocks are going bananas you know i know this ocgn has been getting a lot of press as well and you know you can take a look at some of those stocks by just highlighting them and view the stock graph and see what they're doing you know go to like a three month graph here get a peek you know and see if it's something that you want to look at where this transenterics is a little bit more consistently moving up you know and so it's a great way to find stocks that are really moving and then one of them odds are is going to catch your eye because you can go down through the list you know and just kind of eyeball those all those stocks now the other thing is my goodness you know if this complete basket of stocks overall you got eight stocks moving you know two that are kind of going working your way against us so what if you just you know thought about buying all the ones that are up you know a lot of times that's a pretty good methodology to get you off to a good start but you know one day doesn't necessarily make a robust strategy what we know right now is these are the strategies that are on fire today right but when we were putting this system together you know the thing that dawned on me as i sat down to you know dr ludo came to me one day and said steve you we went to all the trouble to put this tool together what we need to do is figure out a scientific way to use this thing to consistently make money right and the first thing that dawned on me is i sat down to conquer that task you know is we've got all this data you know we've got 90 days worth of uh three calendar months anyway of trading data that's usually about 64 to 67 some odd days you know just about any time i look so let me show you what i mean i come over here and there's many different analysis modes and what i did was i wanted at least double confirmation of strategy selection so we're going to use two of these modes that i felt were the most robust to make the assessment of consistent derby strategy okay we're going to start with very the start date now when i do this instead of just looking at a singular data point a drop down calendar will appear and i can go all the way back to three months ago and we can take a look at say november 11th through yesterday february 11th or even right up to the current day if you like but a lot of times we make this assessment before the bell rings okay so typically you're going to be going like an 11 to 11 barring some kind of holiday all right now with that being said what you have now is a different slice you know different look right seattle bear beaters wasn't at the top today but what we see is that is the most consistent strategy from a buy and hold perspective over the last 63 trading days you can see the number over here to the left okay and so what do i mean by that well if i click on the green bar now we've got a different look you're not looking at the stocks because we're looking for strategy consistency thereby we know that on any day that i picked seattle bear breeders i had a very good chance no matter what 10 stocks were in there to make money that's the main message right so if we look back at the history here from the first run november 11th of 20 to february 11 this year it had 10 stocks so this strategy finds 10 stocks on a consistent basis okay and we like to invest in 10 right out of the gate so that's good 100 winners all of them went up over that three month cycle 84 return on investment which is super good right that's annualized out to 330 percent with very little drawdown and a high efficiency rate so terrific result here now what we care about most is not so much all of this information here what we care about most is the one that's at the top you know what we're trying to do is isolate a strategy that is as you look at the result here look at how many stocks were picked how many winners you have what the gain loss was you know so as we continue down the list here boy you know you see just gain after gain after gain look this one was up 190 from uh middle of december up through 211 okay and so what we're holding constant is that end date whenever you do a scientific experiment you know you only want to vary one thing at a time so we're just varying the purchase date you know the sell date it always remains constant now the stocks that are in there certainly can be different on a daily basis and a lot of that has to do with search you know if it's a conservative blue chip kind of strategy and sometimes we've selected those you know because they were the most robust a lot of times there's not a lot of turnover you know in a strategy that's looking at blue chips high safety stocks and there shouldn't be right whereas with a price and volume scan you know like price volume boomers or something you know you could literally have 10 new stocks each and every single day but the beautiful thing about it is you know is that it doesn't matter you know whatever has been working the best whether it's buying those high safety stocks or buying those exploding stocks for the last three months that's what the derby is isolating for you okay and so you know you can go in and you can look at all the runs you can even look most recently and we have hit some volatility here over the last three days you know and you'll see that here in a little bit but it's been a terrific strategy for us and you'll see that as well okay all right so with that being said we didn't pick seattle bear beaters just because it was at the top of this list because knowing a little bit about the primary wave you saw some brief excerpts of charts moments ago right and you saw that boy it looks like a campaign's only about maybe seven or ten days in length on average right so we can't really utilize that full three months to the best of of of that ability right but what we can do is try to find a strategy that not only is good from a buy and hold perspective but is also good in the first week gets off the ground fast and runs and so the way that we do that is with another analysis mode called sliding window so sliding window what it's going to do is hold a number of days constant so in other words do i want to see strategies that make the most money consistently over a three-day period a two-day period a five-day period a 10-day period and so on well i started with five it was the very first number i chose i figured a week you know i want my stock selection strategy to have good long-term potential because we might hit a good run in the stock market and go on a couple month run you know but i also wanted to find that that strategy that also got off the ground running quickly in that first week and lo and behold wouldn't you know it seattle bear beaters is number two on this list you know and so how we pick strategies is we look for the strategy with the lowest score and what i mean by that it was the top of the other list and it's number two on this list one plus two is three so unless there's another strategy up here that's got a lower score than three that's the one you pick sometimes you run into a tie that's happened on more occasions than i ever thought it might and what we do and so far with good success is we use this mode as the tiebreaker so if two strategies have a score of four or in this case maybe three whichever one was higher on this list with the lower score on this list would be the the tie breaking element okay so in this case you know unless it could be show me the money long if it were two on the other list then you would go with show me the money law hopefully that makes sense okay perfect that's not the case seattle beer beater is one on the other list two on this list and there's not another strategy around it getting close besides marijuana stocks and we'll see if that continues to have legs because if it doesn't you know seattle bear beater is likely to maintain that separation whereas if the marijuana stocks you know can somehow regroup from what's been happening here lately you know they might overtake because if i go back to the other list it's number two on this list see and so they're moving now what i just said is very important because this this methodology won't ever look at them at all unless they do keep moving see what i mean and so that's the beauty of the system uh and and so far it's treated us very very well as i've mentioned for the last three years and you know i know it can seem a little elementary at least in how we determine the strategy but the beauty is in the data that we're that we're leveraging to make the decision not in how we keep score you know and all that kind of fun stuff because at the end of the day what we're what we're landing on is a consistent derby performer what we said we're looking for right so right now we've been using seattle bear beater by the way we have used seattle bear beaters more than a dozen times in the last three years in fact in the very first year i used it six times in a row and you know what it works really well in the later stages of exuberant runs you know that's why we call it bear beater it really gets legs as you get as the market gets higher and higher and so it's not surprising to me whatsoever that we've been utilizing seattle bear beaters here again at this point this year all right so enough of that i got around third base and start heading home all right so i'm going to go back over here and here's how we sell we sell really on two different subjects one if the primary wave turns down we sell everything we own the following day if the market follows through okay to the downside or along the way during the campaign we use profit locker and we use just plain profit locker at this point 28 7 profit to loss ratio okay 28 target 7 stop let me go and show you what profit locker 28.
7 actually looks like so i'm going to go back over here i'm going to go into robotrader here you can see oh boy we're getting back towards you know if the market keeps running today eventually we're going to be green here we were off a couple of percent early on this morning as the market was under a little bit of pressure again and again you know this past three day cycle has you can see dipped us off a bit we were we closed at 97 percent uh just about three days ago and you know as this market turns and hopefully starts to get some upward legs again if that is to be the case you know i expect we'll be challenging that high price here pretty soon uh once again okay so it's just a function of market direction in in volatility right now as i mentioned moments ago let's take a look at what the profit locker stop looks like because i can show you a beautiful way to present that i'm going to go to manage trading system here and by the way guys i'm going to give you some links to prior videos where i go through all the settings of the trading system i'm not going to go through that whole process again know this i have a document that i can send folks who have the derby that walks you literally step by step click by click through how to put this up how to put this together okay but what you can see here in the trading system is we're trading the primary wave you know as we said we would we buy stocks long on up waves with the strategy of choice for the current wave as we mentioned and just showed you that seattle bear beater okay and we go to cache in a down if i click on customize here's where you put all those settings into play you pick your search you go to stop criteria and here's profit locker okay so in profit locker uh what we've landed on and what has just continued to work we did start with 28. 7 you know it i mean 21-7 so there has been one change we went we went to 28. 7 just to push those winners a little bit higher and we've actually had seven stocks at this point that have closed north of 40 percent when uh on our roi and i'll explain how that can happen as we get into this picture over here on the right okay so in order to draw out profit locker it's got some moving parts in there let's just leave it at that for now what we have to do is assume linear price movement you know as if the stock just went up tick after tick after tick or day after day after day you know at the same percentage then what you have is a stop loss that starts out with a trailing stop okay then once profitability is achieved based upon stop in this case it would be a seven percent trailing stop early on in the trade just to give you some divulge some information right so once we secure profitability you can see it broadens out and allows some further volatility to actually creep into the trade and not bounce you out of it and then as you start to get more and more towards your target then it starts to accelerate upwards and really lock those profits in you'll also see a final trailing component there this one is a one percent trailing stop up at that point and the idea is you've made it to your target if it keeps just going up like a rocket we don't want to sell it you know that's how we got the seven stocks that have gone up more than forty percent a lot of those gapped you know to get there because that one percent that's pretty tight i mean that stock really just has to consistently keep moving at that stage so this is uh this is done intraday even okay so it's not just based on end of day uh data there all right so with that being said you know let's get back over and round into home plate there's a couple of prior special presentations where i go a lot more into the settings and actually give you some of the early excitement when we first began to kick this thing off and really make it public to our subscribers a few years back so 9 7 2018 there was a special presentation just like this one on become a swing trading wizard same same time same title even right for whatever reason we changed that title up to swing trading made easy on 11 5 2019 but that is really on the same uh methodology that we uh explained here as well okay so you can look at a couple other uh times there and and see how consistent this strategy has been you've seen a 2021 perspective now you can look at 18 and 19 there as well okay all right if any of that seemed challenging whatsoever listen i've learned so many times over and over in my lifetime that you can do anything you want to do there's no such thing as can't the real question is want do you want to do it do you want to try to get involved in a system that can yield you potentially 50 to 60 annualized rates of return on a consistent basis right there's no guarantees obviously all i can do is share the last three consecutive years worth of experience with you right but boy you know we might have another strategy two years from now and we're still clicking along at that same clip you know and so listen if this is something you want to do i can help make that a reality for you vectorvest will make that a reality for you most importantly right and we'll help guide you every step of the way on your journey to becoming a swing trading wizard okay we will take you by the hand and show you exactly how to do it and so on top of learning about how the trading system works and and guiding you and taking your hand and making sure that you fully understand that system you know we do something every single day called the jockey club it's a live trading room we get together at 9 00 a.
m every morning so we've got about 30 minutes of preparatory work before the bell rings those are situations where we identify strategy we're going to use for a campaign you know where we get those trades loaded up and everybody can see what we're doing you know everybody can see the 10 trades that i'm getting ready to do in this next campaign uh that kind of thing you know make sure you know if it's something you want to follow along with that that your settings are correct you know and all that kind of stuff along with just getting ready for the day in general you know what does you know step-by-step guidance on market direction what do the end-of-day market signals look like what is our intraday market timing signal look like you know in the derby there's actually let me show you let me go back over here to the derby there's actually an intraday timing model which right now is firmly bullish you have two indicators here both on a zero to two scale the bullish indicator is coming in at a reading of 1. 56 and the bearish indicator is coming in at a value of 0. 57 so which which one you know what what sense do you get from that right well the market's bullish you know that's the sense you get as soon as that green bar goes above one continues to climb you know we feel better and better about it once it gets above one two we feel pretty certain that the market's more likely to go and follow through in that direction you get up to a one five six you know and the market's really clicking along at that point and so you can even graph it and you can see here that the dti really made its first strong move above 1.
2 fairly early in the day even before 10 o'clock and you know in the event that you want to wait for the 10 o'clock rule that we have here at vector vest before you do any executions you can see it's still climbing and making a new high water mark yep you go ahead and you make your entries you know that's what this is telling you here okay pretty cool stuff right all right so you also get daily insight on proper stock selection we talk about those top strategies and the baskets of stocks that are in there we look at them we try to find some good cherry picking candidates for additional trades above and beyond the trading system and a lot of our folks in the jockey club have gotten a ton and i mean ton of value out of a lot of those cherry picks we found end phase at 11 you know what is it now 211 or something right and many many many more you know so uh it's just been terrific and you get guidance on setups entries and exits on all the trades that that we look at we have group interaction which is great now we're starting to get a huge amount of folks so you know we do our best as far as group interaction is concerned at this point but no we look at a lot of stocks that people are trading you know if somebody's on a hot trade we have them give us a symbol and we put it up there on the screen and everybody gets to take a peek at it you know we decide if we like it too we look at stock news market news and from time to time we have fun and engaging competition so it's just a great little group you know and like i mentioned the real value here is you get some of vector vests absolute best coaches at least as far as trading is concerned on a daily basis you know on a daily basis one and a half hours every day it's going to be myself glenn tompkins patrick france or jerry d'ambrosio okay those would be the four guys that are traditionally in the barrel here now you guessed it we're gonna give you an opportunity to get involved and the best news yet that opportunity is free you're going to get a free 30-day trial to everything i just talked about you're going to get real-time you're going to get vector vest derby because it only runs in real time as you might have guessed looking at those intraday results right on that 30-day trial what i always tell folks is if we can't prove to you for free in that first 30 days that it's worth sticking around for the rest of the year don't do it you know if your only objective is to come and watch me fail bring it on because i know if i get you there it's over you know we're not going to do that i can promise you inclu as i mentioned includes the real-time service upgrade and all you got to do is go to this website at the bottom right now to take us up on that offer www. vectorvest. com derby tribe okay and you're there you'll get all the information you need to get going so if you can do it over the course of the next couple of days here we hope to see you tuesday morning markets are closed monday right but we hope to see a tuesday morning 9 a.
m sharp let the fun begin you know let the fun begin also just real quick for those that are interested in just further swing trading and and like to trade more just by the charts you know and and observations that can be made there here's a different kind of an offer where you can go to www. vectorbest. com pst for our precision swing trading course i bring this up because we're right now in the midst of relaunching precision swing trading it's a lot of fun you got some great coaches in there it'll be jerry d'ambrosio dr david paul and myself and we look at charting patterns and technical scans that vectorvest has and things of this nature to identify some wonderful trading opportunities by you know looking at the charts at the end of the day so that's a great potential thing to get involved with here as well okay and if i bring that up here really quick got a terrific deal going you can see just 4.
Related Videos
21:40
Optimizing Performance With Ruler Stocks |...
VectorVest
3,194 views
26:26
VectorVest SOTW - Become a Swing Trading W...
VectorVest
9,521 views

Alpha Waves Activate 100% of Your Brain Af...
Relaxed Mind

54:37
The Ultimate Swing Trading Guide (For Begi...
SMB Capital
230,995 views

Chillout 2025 24/7 Live Radio • Summer Tro...
We Are Diamond

Healing Forest Ambience | 528Hz + 741Hz + ...
Healing Energy Frequency
23:16
Timing the Market: A System that has Never...
VectorVest
2,469 views

1:29:35
Music for Work — Deep Focus Mix for Progra...
Chill Music Lab
3,116,439 views

27:07
The 3 Best Ways to go Cherry-Picking for B...
VectorVest
4,032 views
19:38
A Personal Guide to Smart Investing: Specu...
VectorVest
959 views

2:18:59
+805% Trading Champion of 2023 Reveals His...
TraderLion
260,554 views

Deep Focus Music To Improve Concentration ...
Relaxing Melody

Billboard Pop Songs 2025 Playlist ✨Ed Shee...
Cozy Jazz Ambience
28:51
VectorVest SOTW - How to Identify the Righ...
VectorVest
5,302 views

Cozy Winter Coffee Shop Ambience with Warm...
Relax Jazz Cafe

Indie / Bedroom / Pop / Surf Rock - 24/7 R...
Nice Guys

30:02
VectorVest | Auditorium | Master Investor ...
Master Investor
26,863 views

Remove All The Negative Energy | All 7 Cha...
Healing Energy Frequency
7:21
Intro to Swing Trading Stocks: Strategies ...
Charles Schwab
22,385 views

52:02
ÎN FOLOSUL COMUNITĂȚII | Stand-up Comedy S...
Micutzu Stand-up Official
448,942 views