Football AI Tutorial: From Basics to Advanced Stats with Python
97.55k views12185 WordsCopy TextShare

Roboflow
Let's build a Football AI system to dig deeper into match stats! We'll use computer vision and machi...
Video Transcript:
almost two years ago I published my first football AI video on this channel back then I showed you how to detect and track ball players and referees on football pitch I learned a lot in the meantime so today we are taking this project to the next level I'll show you how to use Sly embeddings to divide players into teams how to use the keyo detection and homography to create video game style radar view we'll also use the extracted dat to calculate some Advanced stats like ball trajectory and vorono diagram illustrating team control over the pitch
and most importantly you don't need to be an AI Guru to follow this tutorial I'll guide you through the whole process all you need to know is some python Basics but before we start let's get one thing straight I'm from Europe and where I live we call the sport football first thing first let's lay out the plan the project is quite complicated so I drawn a diagram illustrating all the models and tools we will use today the Row video will be split into frames and each frame will be processed by two models object detector and
keypoint detector both models will be fine-tuned on custom data sets the object detection model will detect players goalkeepers referees and the ball while the keyo detection model will detect 32 characteristic points on football pit since we'll know the positions of these points on both the video frame and the Real Pit we can later use them for perspective transformation detections for all classes except the ball will then be passed to B track assigning each of them unique Tracker ID and tracking their movement on subsequent video frames next we will use embedding analysis to divide the players
into two teams we will use S to generate embeddings U map for dimensionality reduction and K means to create two clusters of players then using previously obtained results of keyo detection will perform perspective transformation in two directions from Peach plane to frame plane and from frame plane to Peach plane the former will allow us to project virtual lines onto the video the more accurate the predictions of our keypoint detection model then more closely the virtual lines will overlap with the actual lines on the peit on the other hand by projecting the positions of ball and
players from the frame onto the peach will be able to create a radar view known from video games showing the actual positions of players on the pit it should also be possible to draw the exact path of ball movement as well as vorono diagram illustrating the control of individual teams over the peach okay enough of the talking let's write some code let's start by detecting ball goalkeepers players and referees to do this we'll use YOLO V8 object detector trained on custom data set we have a dedicated tutorial on this channel showing how to train such
models so make sure to watch it if if you want to learn more this time however we'll focus primarily on aspects specific to analyzing football game the original data for this project comes from dfl Bundesliga data shootout competition organized by kagle around 2 years ago as part of this competition the organizers released around 80 30C videos from 20 different matches today we'll use this data to fine tune our object detection and keyo detection models I prepared a data set of almost 400 images which I uploaded to roboplow Universe each image has been annotated with classes
ball goalkeeper player and referee notice that goalkeepers and players are separate classes this is because goalkeepers wear different colored uniforms than the Outfield players the additional information that a particular player is a goalkeeper will help us later when dividing players into teams the original images which has a resolution of 1920 by 1080 are then subjected to post-processing including rescaling to a square format of 1280 by 1280 they're also stretched to fill the entire space after the transformation they look like this now one of the key challenges ahead is reliable ball detection the ball is small
fast moving object it can be blurry in frames where it moves particularly fast making it harder for the object detector to accurately located life sport events often have cluttered backgrounds particularly in football when the ball is high in the air amid spectators not to mention other objects on the peach that may look similar and confuse our model when preparing a data set we need to make sure that all these anomalies are included this will help to train a robust model capable of handling all these edge cases later on now that the data set is prepared
is time to train the model by the way all the models necessary for this tutorial are already trained and available publicly so if you want to skip the training part and jump ahead feel free to do so using the chapter time stamps in rof flow Sports repository you'll find a readymade Google C template that we'll use for model training Google collab has a free tier allowing you to use GPU for a few hours this should be just enough for us to train our model for free before we start we need to make sure that the
secret stop located in the left sidebar of Google collaps UI contains our roof flow API key we'll need it to download the detection data set from roof flow Universe to get it log in into your roof flow account or create one if you don't have it yet and then expand the settings dropdown from the left panel and select API Keys now copy it and paste in Google collaps Secrets tab now we need to make sure that our environment is GPU accelerated to do this I run Nvidia SMI command if your output looks like mine you
are all set if not in the top bar click run time and from extended drop-down select change runtime type choose Nvidia T4 accept and restart the notebook next it's time to install necessary python dependencies for the training of object detector we only need two packages ultral litics to train the model and roof flow to download the data set and deploy the fine-tuned model this cell may take few seconds to complete but when everything is ready it's time to download the data set the link to the data set is in the description below the video Once
you open it click data set and then select the version you want to use in my case it's the latest one then click download data set and in the export popup select YOLO V8 as the output format checking show download code click continue and after a few seconds a code snippet will be generated which we copy and paste into Google collab we execute the cell and after a few seconds the data set will be downloaded to our coding environment we can confirm that by opening the data Explorer located in left panel of Google collab UI
in the data sets directory we see football player detection data set divided into test train and valid subdirectories we can also view data yl where among other things we can see class names and paths to the sub directories and finally it's time to start the training the most important thing here is to select a 1280 input resolution by default model trains with 640 input resolution this means that every image and every video frame that runs through the model is first rescal to 640x 640 squares in our case this means that the amount of pixels in
the input image is reduced by four to five times and this is the problem because of our ball detection you see on the raw image the ball barely occupies few dozen pixels and after such a rescaling the amount of information in the image May no longer be sufficient to reliably detect the ball for this reason we increase the input resolution from 640 to 1280 pretty much keeping the amount of pixels the same and boosting the accuracy for ball class detection but nothing in the world is free except of my tutorials so we need to pay
the price and the pric is slower training and slower inference since the input resolution increases the amount of memory needed during the training we need to adjust our batch size accordingly batch size is the number of samples processed in one forward and backward pass of training algorithm if you're training the model on more powerful GPU card you might be able to use larger batch size I set mine to six training such a model will take take at least an hour to complete so I'll use the magic of Cinema to speed up the process by the
way on the right side of collapse UI you see few charts one of them is GPU Ram where 18 to 19 gab of 22 available is already allocated this is the value you need to keep in mind when choosing custom Training hyperparameters you see that we are already in red just slightly larger batch size and we would be done out of memory exception and training [Music] kiled when the training is finished we can Benchmark our model to make sure everything went well a popular metric used in such situations is map mean average Precision it measures
the average Precision across all classes and different IOU thresholds providing a single number to represent the overall performance of the object detector here we can see the global map value and per class value the model does quite well at detecting goalkeepers players and referees and as expected worse with ball class but don't worry we have few tricks up our sleeve that we will use to clean up the ball detections the last step is to upload the model to roboff flow Universe this way we don't have to worry about storing and versioning of our weights we
simp upload the training results to universe and load the model when we need it at the end a link to rlow universe is display where we can find our uploaded model now it's time to use this fine tuned model to build something cool I debated it for a long time whether to use regular IDE or jupeter notebook for coding in this tutorial and in the end I chose Google collab it's just a lot easier to play with different visualizations and I assume that a lot lot of viewers don't have gpus so it should be a
lot easier for them to play with the code there however if you prefer to run your code locally all the code along with installation instructions is in roof flow Sports repository you can find the link to this repo and the collab that I'm using in this tutorial in the description below okay let's start with our Google collab setup before we do anything else we run Nvidia SMI command to confirm that we have access to GPU and after few seconds we should see the familiar output if you see something like this you're all set then we
install our python dependencies this time I need fre python dependencies G down inference GPU and supervision I use G down to download files from Google Drive inference to pull and run models from rlow universe and supervision to process videos and among other things perform really nice visualizations uh this installation should take few seconds to complete I sped it up just a little bit to save some time next we install Sports repository this is the repo where we store a big chunk of our Sports demos uh and utilities we'll use some of them uh for visualizing
the outputs and last but not least we uh pull five files uh those are video files from the original Bundesliga kagle competition and we will use those um as our uh Source videos for demos um so we already downloaded four of them here is the fifth one and at the very end uh I'm setting up an environment variable that will be consumed by the inference package uh telling it which uh execution provid onx should use so in that case I would like to use Cuda our environment is ready now we can play with some models
okay so let's create a new text field and call this section ball players goalkeepers and referees detection and now in the code field we will will import get model from inference package that we just downloaded and user data from google. cab now we will use users data get to extract the value of roof flow API key secret that we set up in Google collab you can see that beforehand I added this secret to Google collab secret step now I'm just retrieving it and I'm also setting up another constant called player detection model ID and I'm
copying the ID of the model that we ftuned for roof flow Universe the link to that page on robow universe is in the description below now I'm creating an instance of model calling the get model function and providing my model ID and my roof flow API key as arguments let's just break the line because it's quite long and execute the cell cell may take a little bit of time to execute because we are pulling the weights from roof flow universe and loing them into the memory I hope that in few seconds we should be we
should be done yeah now I'll create another constant called Source video path and I will just set its value to one of uh the path to one of the files that we uh downloaded from Google Drive just few seconds ago and I'm importing supervision as SV the first utility that we will use from supervision is called uh get video frame generator and we just pass uh the path to our source video file over here and it allows us to Loop over frames of the video here I'm just using the next uh to get the first
frame from the generator and I plot it on the screen awesome now it's time to run uh our uh model on that frame so I'm calling player detection model infer passing my frame and confidence threshold as as arguments and that function Returns the list so I'm just picking the first element from that list and then parsing the result into supervision detections this the class from supervision library that allows us to manipulate the actions and visualize them and do all sorts of useful stuff I'm initiating the most basic annotator from supervision called box annotator that draws
boxes and I'm creating a copy of the source frame and I'm annotating that copy with my bounding boxes passing the copy of the frame and detections to it I run the frame uh run the cell um ah of course um I messed up uh we need to pass the annotated frame to the plot image cool we see the bounding boxes now beforehand I prepared a list of colors that I would like to use for visualization so I'm just passing that list to color palette and passing that as an argument running the cell once again and
the colors are updated awesome now it would be awesome to display more information about our detections to do that I'll use another annotators um another of annotators from supervision Library called label annotator I'm passing the same list of colors um those will be used as Bank background for those labels and I'm setting the text color for black now uh below my box annotator I will run uh the label annotator so once again uh I'm passing the annotated frame along with detections and I press shift enter now what we see is the default uh uh label
uh it's just the class name if I would like to show more information I can do it as well um so I would like to show the class name and the confidence levels so detections class that was created from paring the inference results stores that information so you can just um get class names and confidences from there use zip to Loop over both of them at the same time and pars our labels I just need to pass labels as another argument to label annotator shift enter once again and yep we see uh both class names
and confidence levels now let me show you how to go from processing of a single frame to processing of the whole video first thing first I Define new constant called Target video path uh where I defined the location of the result file and of course I would like our Target file to have the same FPS and the same resolution as the source one so to do it I first create an instance of video info this is one of the utilities available in the supervision that allows you to extract the information about the video I pass
the path to our source video file so that we extract The Source information and then I create another um instance of another utility from supervision package called video sync that allows me to save videos to the hard drive I pass the Target location of the video and our video info object this way we Define the location and the FPS and the resolution and then instead of getting just the first frame from our frame generator we Loop over the frames even important tqdm to get this nice loader visualization showing how many frames we already processed and
how many frames are still to be processed then I indent all the code that previously was there to process a single frame to now process every frame in the for loop I open the video sync with the wh statement and at the end of the nested for Loop I call video sync right frame to pass the currently processed frame into the video sync now I just run the cell I speed up the footage so that we don't need to wait so long for it to finish processing but when it's completed we can download the result
file we just open the file explorer quick download and after few seconds the video should be on our hard drive here's the result as expected players goalkeepers ball and referees are being uh detected we see bounding boxes and labels with probabilities so this is the most basic visualization of the results now let's try to do something more advanced our visualization so far was very simple and to be honest a little bit boring so I plan to make it a little bit more interesting uh by using more advanced supervision annotators uh to be precise I will
use ellipse annotator to annotate uh players goalkeepers and referees and triangle annotator to annotate ball okay so we go to the top of our cell and we start by defining new constant called ball ID it will store the class ID for ball class now I I'm renaming my ball annotator into ellipse annotator and I'm no longer calling box annotator Constructor I'm calling ellipse annotator Constructor uh below I'm commenting out uh label annotator we don't need it for now but I'm initiating new one uh call it triangle annotator um and here I will use a nice
yellow color um to annotate the ball I'm calling color from hex and I'm passing the hex value of that yellow color I can also Define the geometry of that triangle uh those are in pixels now just after parsing our detections we will divide them into two groups so the first group are only detections for a bow class and the second group are all other detections we can uh simply filter them out using uh class ID so here you will have all classes but ball now I'm commenting out the label parsing and in the an ation
section I need to clean up a little bit so I'm renaming my box annotator into ellipse annotator and I'm passing uh different detections those filtered out and instead of calling label annotator I'm calling triangle annotator and here I'm passing on the ball detections now when I run the cell we see new visualizations already looks a lot more interesting um the color coding still the same but instead of boxes we have ellipses and we have the triangle over the ball but the triangle is quite close uh to the ball um doesn't look so good but supervision
have a utility that allows you to expound Boxes by a specific number of pixels so what we will do is we'll expand boxes for ball class by 10 pixels and that should move away the triangle marker a little bit higher so when you run the cell we see that the triangle is no longer touching the ball it's just over the ball that's a lot cooler now we remove one value from our color uh list and that's because we no longer use the ellipse or previous box annotator to annotate the ball and ball had class zero
so the first one uh in the list um and to adjust for that we move all classes for remaining detections uh one down so if players had class ID 2 now they have class id1 and on top of that we use non-max suppression to remove overlapping detections and we use class agnostic true to do it regardless of whether they are from the same class or not it'll just improve the quality of predictions so here is our result uh after change annotators so I made it side by side so on the left of course we see
the the initial annotations and on the right we see the Nuance I hope that you already see that I was aiming for this kind of video game Vibe with ellipses below the players and this characteristic uh triangle marker over the ball uh now let's add some tracking the next step is to add tracking so for that step to have an sense we need to have a way to display our tracker IDs and we will uncomment label annotator to do it we remove this extra color from the um beginning of color list uh the one that
we also removed from from ellipse annotator and we update text position from the default top left uh to the bottom center so we want to display the text kind of like in the middle of those ellipses now we also initiate by track this is the tracker supported by supervision uh and we will use it to track all detections but the ball so we call Tracker update with detections and pass all detections variable but once again this is the variable that stores all detections bable now we also uncomment the labels parsing and instead of displaying class
and confidence now we will only display Tracker ID and put this kind of like hashtag prefix in front of it and we put back uh label annotator annotate call to to our annotation section pass our annotated frame all detections and our par labels and when we run it we see ellipses with tracker IDs awesome so here's the video result for that step we successfully managed to track goalkeepers players and referees and with our next step we are taking that to the next level as we will divide players and goalkeepers into two teams in theory dividing
players into teams is simple we could for instance run our object detection model crop boxes containing players and then calculate the average color of pixels within the crop however this approach have few drawbacks first besides the player the crop also includes the back ground like the grass the stands or even other players second the proportion of pixels representing the player and the background in the crop varies depending on player's pose third different lightning in different areas of peach affect the average color value all this makes the color based approach unreliable it may work for some
scenes but it will definitely fail for others therefore I've decided to use an approach that might seem over engineered but works perfectly in practice some time ago on this channel I showed you how to use clip image embeddings to look for similar images today we'll use a similar strategy to look for players from the same teams embeddings capture a semantic meaning of an image making it robust to variation in Po occlusions and lightning conditions this time instead of clip we'll use clip it's more computationally efficient making it a better choice for realtime applications for each
crop containing a player will generate a 768 dimensional SE Gip embedding Vector then using umap we'll project this Vector down to threedimensional space umap is a dimensionality reduction technique that helps us visualize High dimensional data in low dimensional space while preserving the relationships between data point finally will trade K means to divide players into two teams K means is a clustering algorithm that helps group similar data points together it will find two clusters in our threedimensional embeddings representing that two teams trust me it sounds complicated but it's actually quite simple so first thing first we
need to collect a sufficient set of player crops for us to use to train our team classification model to do it we once again uh create an instance of frame generator but this time instead of uh looping over every frame what we will do is we'll use stright argument uh to skip every 29 frames and return every 30 frames uh just like before we will use a for Loop to Loop over frame in frame generator uh we will use qdm to get the nice loader uh and uh maybe add a description um saying that we
are collecting uh crops I also created uh a list called crops before the for Loop and we will append our crops to that list now inside the for Loop I'm doing uh everything that we already done in the previous sections so I'm calling the infer function in our player detection model pass the frame pass the confidence threshold uh extract the first value from the list and and pars that result into supervision detections um then once again I'm running non suppression to remove uh the overlapping detections setting the uh IOU threshold to 1 uh 0.5 um
once again uh making it class agnostic next we'll filter our detections by class so previously we uh already done that for ball class but now we will do that for players so in our model uh player have ID to so we just uh use that player ID to filter um detections by class ID and now what we do is we uh do lease comprehension to Loop over detections the player detections that we already have and use one of the utilities from supervision package that allows us to crop out um parts of the image based on
the box definition so I execute that uh cell just to make sure that everything works correctly um the FPS of that video is is 25 and we are striding uh every uh 30 frames uh so that's up to 750 frames so so far so good looks like we get all the frames to make it a little bit easier for us to use that uh I wrap all that code into utility function call it extract crops now I just update the parameter in the frame generator so that we don't use the global value and we use
the the value that is passed as the argument to extract crops function and Below we can test if it still works um it should so let's just wait a few seconds for it to finish yep now we can just display the count of our crops so alt together we got 478 crops uh we can plot sample of that set let's say 100 of them just to visually confirm that we have uh everything we want and here's the result of uh crop collection so we see that there are players from uh green and red team now
we need to build another algorithm to automatically uh sort them into those two teams so I prepared a code snippet uh that will allow us to load sigp model that we'll use to uh create embeddings for those crops uh the code uh is pulling a SE lip uh from hugging phase and uh loading it into the memory um and also making sure to load the model on the GPU if the GPU is available and now we need to run this model on those crops and get our embeddings so the first thing that we need to
do is to convert our crops from uh open CV format that we have right now into the pillow format so supervision is using uh open CV as as the engine internally and uh sigp is expecting those crops to be in pillow so we used Le comprehension to convert crops um from numai arrays into pillow images now we also use uh chunked uh function from more e tools package to split those crops into batches so I set the batch size to be 32 I pass our crops and the batch size to to Chun function and as
a result I will get batches um I initiated the list called Data where we will store our embeddings now we just Loop over the batches use sqdm to get the nice uh loader showing us how many batches were already processed and if you ever used Transformers package you know that models there usually have the model and the processor and the processor is responsible for pre and postprocessing the data and the model just just executes so here we uh pass our batch to pre-processor that creates uh inputs in the format expected by the model then we
just pass those inputs into the model get our outputs um and then what we need to do is is from those outputs get our embeddings so embeddings are located in the last hidden uh state but that um layer have uh higher Dimension so it's not one by 768 it's more than that so what we need to do is we just average out across the second dimension so that uh in the end we will get those nice vectors uh and when everything is done I just append those embeddings into uh the data and use n aray
ah the model was running uh in the in the training mode so it was calculating the uh gradients and that's why we got that exception so we will just call uh with torch no grat and indent everything inside that uh and this will make sure that the model uh don't calculate gradients we need to restart the the upper cell that extract the crops because we already over the crops uh from from open CV to p and right now um you would get an exception uh here so we need to restart the upper cell and go
back here we already have the crops we calculate embeddings so every uh every batch was uh 32 by 768 and when we concatenated them we got 478 by 7 uh 68 so that means that we have 478 examples that exist in this very high dimensional space with 768 dimensions and um that's very hard to to imagine of course so we will use um map to reduce those Dimensions uh and in the end we'll get 478 examples in free dimensional space and when we will have that we will just pass those examples into the like very
popular and basic clustering algorithm called uh K means um that allows us to predefine the amount of clusters of course we talk about football we have two teams so we have two clusters uh so for now we initiate uh both the umap reducer and the clustering model and once that is completed we will um use the umap to to reduce um the amount of Dimensions so we just call feet transform method that method is doing exactly what uh you think it's doing uh so first it trains uh um map and then once it's completed it
uh also run uh kind of like the inference the the projection uh on the input data and as expected we got 478 by three um now we take those project Cs and we pass them into the clustering model this time calling the method feed predict this one will first train the clustering model and then run the predictions and now we can um take a look at the sample of that data so it returns as either ones or zeros depending on so this is pretty much the label of the of the cluster um so we can
treat it uh as class ID for example now we can easily filter out crops based on uh that uh that team ID so I just zip over the crops and clusters and when the cluster is equal zero I I keep them uh and store them into the team zero uh Leist now when we display that Leist um so we display those crops similarly as we did before uh we will see that we'll only have players from one team so this is how the result looks like we successfully divided uh players into into two teams here
is the red team now we need to plug in our team classification uh code into into our uh tracking demo so instead of using the code that we just wrote I will import team uh classifier from Sports repository like internally that class exactly what we just did I just showed you what is inside but it's a lot easier to to use it instead of our code because I don't need to uh run every step manually I can just run it all uh nicely packed into the team uh classifier so at the very top of our
uh tracking uh code I uh call extract crops pass the path to our source video file um and uh then pass those crops to our team uh classifier so all that will happen before we even start tracking um this way we will have the model trained and ready to use uh when we uh want to process frames now what we need to do next is we need to divide our all detections this is the uh the object that we created a few minutes ago it stores all detections except the ball um and from that uh
group of detections we we cut out even smaller uh portion uh those that are only the players and what we do next is we uh do exactly what we did before so we convert the crops uh we we crop out those detections from um the whole frame and then pass those crops uh to our team classifier to the predict method and as a result we will get uh Team IDs we assign those team IDs to to class IDs so when we run our annotators it will automatically Peck uh the color and coding from the one
that we have so far uh so previously it it colored goalkeepers with blue and players with pink and now when we run it uh that color encoding is now uh converted into teams so we have pink team and blue team but we don't have the goalkeepers goalkeepers are still not assigned to the team so how do we do that um to do it we will need to write a short her ristic uh the assumption is pretty much that if we take the positions of all players from both teams and we will average those positioned out
we'll have kind of like the centroids of both teams and goalkeeper should be closer to its own team's centrate so the assumption is pretty much that the defending team is closer on average to their goalkeeper than the attacking team on average because individual players for example uh could be closer but the average of the team uh should be should be exactly how I described it so we will calculate uh this uh inside this helper function called resolve uh goalkeepers team ID uh this function will take uh player detection uh detections and goalkeeper detections so remember
our player detections already have class ID uh where where that class ID Express the team ID so uh players have either zero and one depending on the team that they are belonging to and goalkeepers for now have the the regular class ID something that uh does not relate to their team and now we need to convert boxes into points so uh to be able to calculate the average position of the player we we cannot have boxes we need to have some some exact location of that player and what we will do is we will convert
those boxes into a single point that is in in the middle of the bottom edge of the bounding box supervision has a utility that allows you to do it very efficiently so now we have two n arrays goalkeepers XY and players XY and those nire arrays store coordinates of both goalkeepers and players uh so next what we will do is we will calculate the Cent rates of both teams so we filter out players based on their class ID like I just told you class ID right now Express uh the team ID uh and when we
do it uh so filter out the the num arrays based on that condition and then calculate the mean we end up with the average XY coordinate of the team um and to wrap it up we just Loop over the goalkeepers because it's quite possible that on single wide uh angle uh frame we have more than one goalkeeper so we Loop over the goalkeepers we calculate the distance uh from the goalkeeper to uh centroid of Team zero and centrate of team one and then what we do is we just append uh value to goalkeeper team ID
list uh and we just do an if statement uh if if the team zero is closer then it's zero if team one is closer then it's then it's one and at the end we convert that least into n array because our class IDs and we will once again uh use class ID to to store information about the team is an amp array so so we need to return the N array so the utility is is ready we just go back to our code uh and um call that function uh passing the goalkeepers detections and player
detections and the result of this function will be saved to uh goalkeepers detections uh class ID now what we can do is we can uh take the the players detections and goalkeeper detections and kind of like merge them together into a single uh detections object and then we will we will use that object to pass into our annotators and visualize them uh so the idea is that right now also goalkeeper should have the uh color of the team uh assigned to it and so we need to put all detections back instead of player detections in
all of those annotators and once we are ready we can run the cell so of course once again it will uh collect the crops it will train the team classifier so all of that will take uh a little bit of time um but it should be almost there um ah the merriage function in detections object takes a list and we passed players detections and goalkeepers detections individually so we just need to wrap those values in the list and pass them as a single list instead of indiv objects so we restart the cell once again [Music]
um and in just few seconds we should get the visualization yeah so the goalkeeper is the most left player on that frame and it looks it got assigned to a pink team uh which just by looking at the frame seems correct we don't have the referees visualized uh yet uh because uh they are not part of the all detections anymore so what we will be doing is we just at one more filtering statement uh this time we filter by referee ID and we um add those referee detections uh to our all objects after we assign
teams uh to players and goalkeepers so now we just we just uh have a list of three elements instead of list of two elements uh so we run the cell uh once again and after a few seconds we should see uh both teams and uh referees uh on the frame awesome and here's the result when we run it for entire video works really well um there are believe I believe no accidental team swaps um the only moments where we lose somebody is when it gets occluded and it's no longer detected at all so yeah really
really uh robust solution before diving into key points detection let's take a quick deter to understand homography homography is a mathematical transformation that Maps points from one Lane to another when taking a picture of flat surface like a football field from an angle it will be distorted due to perspective the further away something is the smaller it appears homography allows us to undo this Distortion and get a bar eyes view this is critical for our football AI because it enables us to accurately track player positions ball movement and other key events regardless of where the
camera is positioned and how it's moving moving to perform this transformation we need to calculate a homography matrix this 3x3 Matrix encapsulates the geometric relationship between the two planes it is computed using corresponding sets of points in both the original image the camera perspective and the desired top down view typically we need at least four such Point pairs to solve for homography Matrix once we have the Matrix we can apply it to any point in the original image to find its corresponding location in top down view when the camera is static using homography for perspective
transformation is simple we determine the position of corresponding pairs of points on source and Target Planes once and since the camera doesn't move we can apply the same homography Matrix for each video frame we even showed this approach in our vehicle speed calculation tutorial cameras at sport events however are often placed in various locations and angles and frequently pan teed and zoom during the game this Dynamic nature makes it challenging to determine the position of corresponding points between the video frame and real world to overcome this challenge we will train YOLO V8 keypoint detection model
to automatically identified specific characteristic points on football field keypoint detection is a computer vision task that involves identifying specific points of interest in image or video key points represent distinct features or landmarks such as facial features body joints or object Corners in our case we'll use keyo detection to detect characteristic points on the football peit since the camera can pan and zoom in and out freely following the action we rarely see the entire field therefore we need to Define our points densely enough so that at any time even when the camera is tightly following the
action at least four characteristic points are visible this requirement is related to homography we need at least four reference points to run it I defined 32 characteristic points on the pit including Corners penalty areas goal areas penalty spots and the center circle labeling these images took forever to complete so if you appreciate the effort and would like to see more AI projects like this make sure to subscribe and leave a like it motivates me to keep going now back to the video Once the labeling was completed I applied post-processing steps where we rescaled each image
to 640x 640 squares by stretching them to new format I trained over 10 versions of this model and in my test stretching the frames performed far better than maintaining the original aspect ratio and using latter box speaking of model training let me quickly show you how to do it once again I remind you that all models used in this tutorial have been already trained and are available publicly on roof flow universe so if you want to skip this section feel free to do that using chapter timestamps however if you never trained keypoint detection model before
I highly encourage you to stick around in the rlow Sports repository you can find a link to Peach keypoint detection model training Google collab so if you want to reproduce my experiment or Port this demo to another sport or a completely different use case you're all set the notebook starts with standard environment preparation before we start we need to add roof flow API key to Google collapse secret stop it will be necessary to download the peach keypoint detection data set from roof flow Universe next let's make sure our Google collab is GPU accelerated to do
this I run Nvidia SMI command by default my notebook runs on Nvidia T4 but due to the large amount of computation required to optimize the model I'll upgrade my GPU to Nvidia a100 I click runtime and then select change runtime type from the drop-down when the popup appears select A1 100 and click save this GPU is available only for collab Pro users still you should be fine with Nvidia T4 it will just take a lot more time to complete the training next we install the necessary python dependencies similar to object detection model training we only
need two packages ultral litics and roof flow once the installation is complete we can proceed to download the data set in roof flow Universe we select the desired data set version and then click download data set button when the popup appears select YOLO vate as data export format and check show download code after clicking continue we see a code snippet that we can simply copy to Google collab we paste it press shift enter to run the cell when the download is complete our data should be visible in data sets directory we can confirm this by
opening the data Explorer in left sidebar the football player detection data set is divided into three subdirectories and each of them uh in typical yellow style contains another directories images and labels when we open data we can see something new however it contains a flip index section where corresponding pairs of keyo indices are defined indicating which key points should be swapped when an image is flipped horizontally this information will be used when creating horizontal flip augmentations once we have the data we can start the training I'll be training YOLO v8x poose for 500 EPO and
I know what you're thinking 500 EPO like do we really need that here's a small example where key Point detection results are marked in pink and the lines projected using homography are in blue we will build this literally in a few minutes but in the meantime we can see how the projected Lines no longer closely overlap with the lines on the actual football Peach all due to minor keypoint detection errors that's why we need to train a bit longer and optimize our model as much as possible to speed up the process I set my batch
size to 48 I remind you that I'm running my training on Nvidia a100 if you don't have access to such a beast you'll need to adjust this value accordingly to the amount of vam you have also make sure to disable Mosaic augmentations Mosaic augmentations combine multiple images into one during the training increasing the diversity of your training data those augment ations work great when you expect multiple objects in various configurations to appear in the image in our case there's always one object in the frame the peach in my test I noticed that Mosaic augmentations sometimes
misled our model making it expect multiple Peaches on one frame you can disable this feature by setting the probability of Mosaic augmentations to 0% training this model even on Nvidia 100 takes a lot of time so see you in a few hours just kidding let's use the magic of Cinema to speed up the process once again after the training let's see how the model performs on some images from validation data set it looks promising regardless of perspective the model provides good quality predictions except of one outlier on the third image from left in the top
row the pink dot seems to be in rather random place we'll see how the model handles images from our test videos finally I upload my model to roboplow Universe I can now easily deploy it in browser through the roof flow API and locally using the inference package let's plug it into our football AI demo okay so let's start by creating uh another text cell and call this section uh peach keypoint uh detection uh similarly as before we copy the ID of our model from roof flow Universe uh so we previously did that for object detection
model now we do it for peach detection model uh we create a constant and assign uh the copy value to that constant and then uh call the get model function that we imported from inference at the very beginning of uh of that tutorial uh pass our roof flow APA key along with the model ID uh press shift enter and that should uh download the model from roof flow universe and load it into the memory we didn't need to extract the roboff flow API key from uh secret step uh because we did it already so we
just uh had that value all the time uh in in the memory so now we do exactly what we did uh before for object detection but uh now we do it for uh keypoint detection so we create uh frame generator once again we extract the first frame uh from that frame generator and this playay that frame uh on the screen uh and now we uh run the infer method of our Peach uh detection model pass the frame and confidence threshold and uh parse it this time not into the detections object from supervision but into key
points object from supervision um and once we do that we have access to uh whole array of uh annotators dedicated for uh keypoint detection one of those annotators is a vertex annotator this one is pretty much using simple dots to visualize all the anchors of the skeleton uh so we just set the color and the radius and uh exactly like we did before we we copied the frame uh assign that copy to to new variable and then uh run vertex annotator annotate uh passing that uh annotated frame which is the copy of original frame and
our key points objects to it and we run that and and just like before uh I forgot to swap the variables in exactly the same place so so here's the result and what we can noticed immediately is that there are some key points that are in the right place and there are some key points that are kind of like randomly located so just like object detection results uh key points also have confidence and uh that confidence can be on the skeleton level and on the anchor level so when we take a look at the result
um esec specifically at the confidence values we see that there are some anchors that have very low confidence we can filter those out so I just set out the threshold uh for anchor confidence at around uh 0.5 and now uh I will use that filter to remove uh key points that uh have have lower values so I just pick the first skeleton from XY uh filter uh anchors from that skeleton based on that uh confidence threshold then I create new keypoints object call it frame reference key points uh and assign uh those filtered out uh
key points positions to that uh to that uh new object I call it a frame reference key points because uh I prepare already for the homography so we'll have frame reference key points and Peach reference keypoints and we'll use them to transform perspective uh later on so here are the filter out uh anchors those look really well uh they are almost exactly in the places that we would expect them to be uh and here is the result for the entire uh video what is also important that the anchors are stable um if the if the
model is undertrained they tend to vibrate uh and jump from one place to another it happens from time to time but it's uh very subtle and we'll be able uh to work with that result uh in the next stage so as we discussed to perform homography we need to have pair of points that exist both in source and Target uh planes so we already have points on a source plane uh because those are the point that we uh acquire using keypoint detection now let me show you points on the target plane so inside uh Sports
repository we have an object called soccer uh peach configuration and that uh class stores information about coordinates uh of our 32 points uh on a real uh football pitch so when we print out config vertices we see that we have a list with 32 values those values are tups and uh describe the coordinates in centimeters of all 32 points we also have something called edges uh and those describe which vertex is connected to which vertex on top of that uh in the sports report we also have uh annotators uh we will use few of them
today but uh the simplest one is draw Peach uh so we can pretty much print out uh the uh the layout of the peach based on the uh configuration that we pass uh uh so let's do that um let's display that result uh in the collup now we have everything we need to uh transform perspective uh except of the actual code that will do it uh so let's write a quick utility that will perform that transformation so uh I'll call that class view Transformer um and it will take uh Source points and uh Target points
um uh into the Constructor inside the Constructor we need to make sure that um those points uh that are stored in N arrays are in float 32 format so I'm just uh running as type on both the source and Target and then uh I'm uh creating uh a field uh called M and that will be our homography Matrix and we'll calculate that homography Matrix using using uh open CV method called find homography uh this is the method that allows us to pass more than four points uh to calculate the homography uh we do it because
uh when we will run our code uh we will have uh sometimes more sometimes less points visible on the frame as we already said we need at least four but we would like to be able to have more than four and and that matter allows us to do it so uh find homography we we calculate our homography Matrix and then inside transform points we'll use um that homography Matrix to move our points from uh one plane to another uh because homography Matrix is 3x3 Matrix uh we need to expand the dimensionality of our points because
our points only exist on Tod plane so so we reshape that um nire rering points so that it will have three dimensions then we will run perspective transformation with uh those points with expanded dimensions and our homography Matrix and then once the uh Point uh transformation is completed uh we will uh remove that one extra Dimension uh so now I just uh copied our uh key points uh example that we uh already wrote and we will add um transformation uh to that example uh so what we will do is we will uh first of all
uh have a transformation from Peach uh to camera perspective so we will take all the points we have and uh we also have edges as we uh uh just uh explored so we will transform those points and edges uh from uh the peach perspective to the to the camera perspective um so to visualize those edges we will use Edge annotator that is also part of supervision uh library and now we will uh perform the the point transformation so uh we already have a frame reference uh key points uh as I told you it was part
of the preparation for that uh transformation right now and now we convert our config vertices first into n array and then we filter them using the same filter as we filtered to to remove the Redundant key points from the key Point detection result so the idea here is that uh we have out of the box we have 32 key points and then we remove some of them because they are not visible on the frame and we would like to remove the same key points from uh frame perspective and from Peach perspective so that we end
up with pair of points that exist on both planes and then pass those points into Transformer view view Transformer to to perform that transformation so once we do it then we take all the points that exist on the on the peit plane and we'll transform them uh to the camera view uh this way we'll be able to to draw points that don't even exist there but most importantly you will be able to draw the lines connecting the points that exist on the plane and that don't exist on the plane because they are not visible so
I'm just doing a little bit of uh NPI magic here to um to have the same shape that is expected by key points object and supervision and then uh I uh call Edge annotator annotate method passing the annotated frame and my frame all key points and as a result we get a nice visualization where the pink points are the detections coming from our key points detection uh algorithm and the blue points and the lines are the projections uh performed uh using our view Transformer now now let's go ahead and perform a transformation in uh the
other direction so let's transform points from a camera view into the uh peach perspective so to do it I uh went ahead and I copied our uh detection code that we wrote uh a few minutes ago I'm removing uh from it the part that was responsible for visualizing the results uh on uh camera frame uh but I'm adding uh code that is responsible for keypoint detections so at this point uh I have um the code that is a mix of our object detection example and key points detection example uh and the idea is that we
take our detections uh that we acquire using the object detection model and move them to Peach perspective using our uh view Transformer so uh first thing first we um we acquire the position of ball uh on the frame uh and we do it the same way as we do it with did it with goalkeepers and players few minutes ago so we call get anchor coordinates and we pass a bottom Center as uh the desired anchor so once again this utility converts boxes into points uh and we pick uh the point on the bounding box that
we are interested in and we chose the the middle of the uh bottom edge of the bounding box uh now we import uh draw Peach uh annotator the one that we used already a few minutes ago go and draw points on Peach annotator so so the draw Peach annotator will draw the entire layout of the of the football Peach and uh draw points on Peach will will U allow us to visualize the position of projected uh object uh on the pit so first thing first we we call the draw Peach uh annotator past the config
this will result in in visualizing the the layout of the of the football Peach and then we call draw points on Peach uh pass the config once again but most importantly pass Peach ball uh XY so this is the uh the projected position of the ball uh that is already processed by view Transformer and now I'm just I'm just passing uh color configuration radius configuration so so just uh a few things that will impact how how the position will be visualized uh and I'm just calling plot image passing the Peach um and we will see
the result in just a second uh because it's the same example that we copied uh from the from a few minutes ago it it also uh collects the crops and calculate embedding so uh that will take a little bit of time before we will see the result but it should be yeah it's it's exactly what we expected uh we see the ball uh near the edge of the of the football field so we have the ball already U projected now let's project players so I just copy those two lines uh that I previously used to
project ball position and now I take player detections acquire bottom center uh position for all the players and I uh and I transform them uh from U camera perspective to Peach perspective and I also uh paste those two lines once again this time uh to project the position of uh referees um so right now we have three variables we have Peach ball XY we have uh uh Peach players XY and we have Peach referees XY and just to remind you in the peach player XY we already have both the players and the goalkeepers and now
I just copy and paste uh the uh draw points on Peach call um uh to visualize uh both players and referees and because we would like to visualize players from uh both teams with different colors uh then that's exactly what I do I filter out uh peach uh players XY based on the uh class ID of of the player as you remember we use class ID to store information about the the team ID and then uh I uh visualize both of those thems with different colors and finally I visualize also the position of referees uh
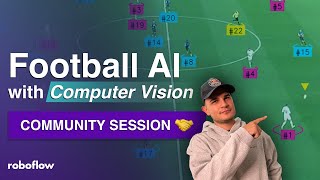
here we don't need to do any filtering we just uh pass a different call um and that's it and when we run it uh we should see a visualization with uh players with from both teams because we will run a team assignment uh as well as referees and the ball projected on the pit so we just need to wait few few seconds uh for that uh training to complete and and uh once that happens we should see we should see the visualization and and there it is awesome here's the allaround result I uh put both
the um Peach visualization and the frame visualizations all together uh so that we can see how how the ball is moving on both visualizations at the same time and and players are moving from one side of the pach to another yeah it it it looks really well now we can easily convert this uh radar visualization into voronoi diagram uh that uh Express the control of the team over portions of the field so to do it uh we just comment out the the visual Iz ation that we just created and we use draw Peach voronoi diagram
uh function available in supervision just as well and uh it will be actually a lot easier to to make that visualization so all we do is we pass the config of course and then we pass uh teams uh as separate arguments so we have team one and team two so to do it we do exactly what we did above we we filter out Peach players XY uh coordinate base on uh class ad values uh then uh we pass information about the the expected color uh configuration so we use the same colors as we did above
um so different color for team one and for team two um and we're almost there and finally we pass uh the peach that we generated above and once we run it of course as usual we need to wait for the uh Team classification model to uh finish uh training uh we should see the uh the generated uh VY uh diagram for our ster field it's taking a little bit of time to complete uh stay patient and there it is and finally I put together uh pretty much the same visualization that I did before for the
uh radar U visualization but this time with vulo diagram updating uh accordingly to position of players uh on the pach um yeah I mean it's it's kind of me mesmerizing to look at that result uh both at the same time this video is a lot longer than I initially anticipated but there is one more item on our to-do list that I promised you that we'll explore and this is B trajectory analysis so I keep my promises but instead of me coding that piece in front of you we'll just go through the code that they already
written and I will just explain it step by step so here is our ball trajectory analysis code it's actually quite simple because we have almost everything we need uh we detect ball using our player detection model we detect uh field uh key points using our um key points detection model and then we perform a perspective transformation that's all we did uh so far but to make those results a little bit more stable I created a Quee where I store my um homography matrices for a Time window equal to five and I average out values in
my homography Matrix and I put it back to a view Transformer this way when we have those uh small vibrations of key points uh we can we can medicate that problem uh by just averaging out the values in the uh homography Matrix and then I just put values uh that I transformed from uh one plane to another uh inside the list and that list stores coordinates of the ball on the football field and most of the time uh we only have one ball and that's great uh but sometimes we have known and even better sometimes
very rar but sometimes we have more than one ball so now what we need to do is we need to clean up those results so what I'm doing is first of all I just uh remove all the entries where I have more than one ball I just assume that if I have more than one ball I don't know which one is it so I just I just remove all of them in reality it would be possible uh to figure out which ball uh is the right one but uh turned out uh I don't really need
to do it um that don't happen very often so I don't lose a lot of data this way uh next uh I just visualized the path uh that I got and here is the here is the small problem that we have so most of the time we get the correct puth but sometimes we don't uh so sometimes we uh get those spikes um and that's because the ball the one ball that we actually detected was not the correct ball so those are those frames where we didn't detect the right Ball but we detected the wrong
ball um and it's still in the data so we need to clean it up and uh I decided to clean it um using uh this uh replace outlier uh based on distance function so this function pretty much uh takes an uh distance threshold so this is the allowed movement of ball between uh detections and if uh the ball uh moved uh more than that allowed distance I just discard um that detection uh and turns out this works really well uh if we run this function on our uh puth uh and I set the distance to
be 5 m I think it's more than enough uh the the path we got is actually really really really clean we covered a lot so far but before we wrap it up let's discuss some important considerations that make or break your football AI project our models have been fine-tuned on broadcast footage captured from above with good view on entire Peach significantly different perspectives such as as low angle shots or those from behind the goal may lead to unexpected Behavior due to changes in object appearance and scale in such cases it would be necessary to expand
our data sets with images taken from those New Perspectives and retrain the model moreover when the camera is low or players clustered tightly occlusions become more frequent those can easily disrupt our bite track tracking algorithm it might be necessary to apply reidentification mechanisms or trackers that consider object appearance such as Massa while homography effectively Maps ground level objects to 2D Peach representation it struggles with objects in the air this is most notable with long passes or high shots where the ball trajectory appears curved on a radar view instead of true straight line addressing this may
require incorporating 3D ball tracking or trajectory estimation models the overall quality of our perspective transformation hinges entirely on the accuracy of our keypoint detector even minor errors in leadmark localization can lead to skewed player position or distorted pitch visualizations one of the tactics we applied to solve this problem was averaging out our homography Matrix across time window but depending on the specific case we may need to come up with more robust strategy last but not least for live applications the entire AI pipeline will need to run efficiently to keep up with game Space the proposed
solution is only proof of concept and we are currently running at around 1 frame per second far from required 30 fps to apply this approach on life sport events it would be necessary to optimize all models by choosing smaller architectures or using Advanced strategies like quantization to speed up the inference today's project barely scratch the surface of AI in sports analytics we tackled key challenges like player tracking and perspective transformation but there is still so much more to explore from Advanced player metrics to model that predicts what will happen next on football field leave your
questions and ideas in comments below and join me for upcoming Community session where we will talk more about this project and Sport analytics in general I'm curious if you have any ideas how to apply strategies we explore today to solve problems outside of sports if you enjoyed the video make sure to like And subscribe and stay tuned for more computer vision content coming to this channel soon my name is Peter and I see you next time bye [Music] [Music] he [Music]
Related Videos
1:42:21
Football AI | Community Q&A (Aug 29)
Roboflow
2,965 views

10:43
The business of football: the big data arm...
Financial Times
175,249 views
12:42
The New Era in Football Statistics
Football Meta
230,142 views
10:59
How to Become a Football Analyst
Football Meta
116,806 views

1:18:59
Gen AI Chat GPT + Python No Code
Havish Madhvapaty
1,703 views
12:32
How Is Artificial Intelligence Changing Fo...
DW Shift
3,231 views

36:34
This puzzle took me three years and requir...
AlphaPhoenix
166,811 views

3:53:53
Machine Learning for Everybody – Full Course
freeCodeCamp.org
6,578,449 views

57:24
Terence Tao at IMO 2024: AI and Mathematics
AIMO Prize
474,664 views

21:57
Understanding Porsche's New Six Stroke Eng...
driving 4 answers
1,958,374 views

19:08
How He Got $600,000 Data Engineer Job
Sundas Khalid
131,049 views

3:50:19
Data Analytics for Beginners | Data Analyt...
Intellipaat
1,649,017 views

3:58:21
Flutter Engage
Flutter
1,915,445 views

2:47:43
This AI PROJECT Got My Student 50 LPA Job ...
Ayush Singh
109,184 views
2:15:02
Data Analysis Project with Python - Footba...
The PyCoach
53,884 views

3:41:42
OpenCV Course - Full Tutorial with Python
freeCodeCamp.org
3,576,427 views

40:08
The Most Important Algorithm in Machine Le...
Artem Kirsanov
453,761 views
2:05:07
Computer Vision With Arduino | 2 Hour Cou...
Murtaza's Workshop - Robotics and AI
2,776,544 views

3:39:55
Sculpting in Blender for Beginners (Full C...
CG Boost
95,331 views
30:03
Object Tracking with Opencv and Python
Pysource
614,722 views