Ultimate Step-by-Step Guide to Technical Analysis (with ZERO experience)
546.59k views10229 WordsCopy TextShare
Ross Cameron - Warrior Trading
Hey!!⚠️Download my FREE Small Account Strategy PDF https://warrior.app/free-strategy-download
Want ...
Video Transcript:
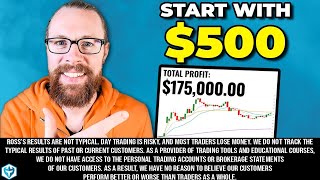
in today's episode I'm going to teach a master class on how to use technical analysis to become a better Trader I'm going to share with you the indicators that I use every single day I'm going to teach you how to read Candlestick charts and I'm going to show you the Candlestick chart patterns that I think have the highest probability of success remember everything I share with you comes from my own experiences trading the markets my name is Ross Cameron I'm a full-time Trader and I'm probably best known for turning an account with less than $600
into more than $10 million of verified and audited trading profits although those results are not typical my experience puts me in the unique position to be able to share with you what is actually working in the markets today at the end of this episode I'm going to give you some recommended readings so you can continue your education I'm also going to share with you a PDF of my own small account strategy that you can download print out and use as a resource as you are improving your own strategy the goal of this class is not
to teach you everything that I know about trading cuz there's no way I could do that in less than an hour the goal here today instead is to teach you the most fundamental concepts that you need to master in order to find success and to give you some skills and some techniques that you can Implement in your own trading today if you find this helpful I hope you hit the thumbs up I hope you subscribe to the channel to get regular weekly uploads just like this to help you become a better Trader now one of
the first things I want you to understand is that we use Technic technical analysis and chart patterns in an attempt to predict what the price is going to do next the traders who predict it accurately will make a lot of money those who don't will lose so naturally we have high stakes in making an accurate prediction and that's why Traders are so obsessed with finding the best technical indicators and learning the best chart patterns that have the highest degree of success because we don't want to lose we all want to have high accuracy now I
can tell you that every single day on chart patterns for pretty much any Financial instrument you could look at there are buy and sell signals because this is a universal language of the financial market and it is well respected by millions and millions of Traders all around the world if you do not yet see those buy and sell signals it is just because you haven't learned to read the language yet but that's okay that's what this class is for now in the older days we didn't have traditional chart patterns like what we have today what
people actually did was from the Wall Street Journal they would take the price of stocks which would be the the closing price and they would just put it on basically graph paper to create their own rudimentary chart patterns but they did this because it felt necessary to understand the context of the current price because that's what these charts do they give us context if I say hey here's a great looking stock at $5 that doesn't tell you a lot $5 relative to what was its all-time high what was its all-time low what has it been
doing recently right we need all that to better understand the context now traders who get really good at technical analysis and really good at reading chart patterns are able to do something pretty incredible we can visualize half of a pattern we can we see half a pattern we can visualize the pattern resolving the way we would expect it to so it's almost like we're we're completing the picture when we look at the chart on on our actual computer monitor we're seeing only half the pattern in real time it's only as it resolves that the full
pattern becomes complete so the the better you get at being able to recognize these patterns when they're in their earliest phases ultimately the more money you'll make now right now Far and Away the most popular type of chart pattern or the most popular type of chart is a Candlestick chart the reason Candlestick charts are popular is because in contrast to a line chart and those sort of old rudimentary charts that traders made in the old days a line chart only gives you basically one piece of information it's the closing price of the stock closing price
closing price closing price closing price but that doesn't tell you anything about what happened during this period of time this is the closing price of this day but what what what what if the the stock happened to go up up I don't know like 100% And then came all the way back down in that one day you wouldn't know any of that from just this one dot on a chart so line charts are completely inadequate for really communicating context around price they're useless we don't use them today what Traders today use including myself are Candlestick
charts Candlestick charts get their name um from centuries ago they were used in Japan for Rice Futures and they gain popularity because they're really incredible charts the reason that Candlestick charts are so special is because each individual Candlestick communicates four pieces of information and they create this visual representation the shape of the Candlestick is created by where the stock opened and closed and it's high and it's low during this period but that visual shape communicates a message so it it really is is it's almost like each of these candlesticks are letters of the alphabet and
when the letters are combined they are either spelling one of two things buy or sell all right so let's break down the anatomy of an individual Candlestick and I'll actually do it on the Whiteboard because it's a little bit easier so a Candlestick communicates four pieces of information the open the close the high and the low all right so what does that mean so when a Candlestick opens that means that trading has begun so let's say the Market opens at 9:30 a.m. eastern standard time that's when the opening bell rings on Wall Street so at
that moment a Candlestick opens a stock opens it let's just say $4 that's the open all right so now we have our first piece of information let's say initially the price goes down to 390 goes down to 390 then and In This Moment right here the shape of the candle would look like a t right here now this is actually somewhat ominous Candlestick shape because it shows that the price is declining all right and then let's say the stock squeezed up to $450 which would be a really nice move and then let's say at the
end of the Candlestick period it closed at $440 right here so these are our four pieces of information we have the low we have the open low the high and the close and we always connect the body around the open and the close so the top here becomes an upper candle wick the bottom becomes a lower candle wick and the body of the candle is typically filled in now some people on their charts will have hollow body candles and that's fine if that's what you prefer it's sort of a visual preference whether you want to
have the candles have solid bodies or Hollow Bodies some people who have color blindness will actually have all the red candles have whole bodies filled and the green candles will have Hollow Bodies so it's easier to differentiate red and green but for those that uh don't have that issue we usually just leave the candles uh fully colored because it's easier to to to see that it's very clearly green when it's filled in so this is one candle now if we were looking at a stock chart that was a 5 minute chart then every five minutes
a new candle begins so this would be 930 to 935 935 to 940 940 to 945 945 to 950 and so on and so forth until we have a stock chart that is completely filled with hundreds of candles to complete the day now in terms of time frames the most popular time frame for active trading is one minute and five minute charts one minute and five minute charts are the most popular because most of the financial instruments that we're trading move relatively quickly some can move as much as 10 or 15% in a matter of
minutes and you might think Ross that's crazy the average mutual fund doesn't return 10% an entire year and while you're right about that what's also true about your average mutual fund is that they're invested in hundreds of different stocks in order to diversify their risk but out of those hundreds of stocks on any given day there's probably one of them that's bucking the trend of the overall market and is doing something exciting perhaps going up 50 or even 100% on on the day because they have great news now the average of the entire mutual fund
may not be affected by the one stock that's moving up but as active traders that one stock that's the one that we're going to be watching that's the one that's volatile and in volatility is opportunity certainly for those of us who want to be day trading okay so when we look at a Candlestick chart pattern the first thing that I want you to understand is that the shape of these candles is communicating some real sentiment so let's start with some green candles here if we see a candle that looks like this what would you think
let's say this is $4 and this is 480 wow the stock just went up 20% it opened at the very bottom it never went down if it had gone down it would have a lower candle wick but it doesn't even have a lower candle wick it just went straight up and it closed at the very top this is as good as it gets this is the strongest candle you could possibly see now whether this is $4 to$ 480 or $4 to $12 you know the size of how tall it is certainly can make a big
difference but this is called a longbody candle so we say longbody candle all right it's a longbody candle it's a stock that's basically gone straight up this is very bullish now longbody candles communicate very strong sentiment essentially no matter where they occur they're showing that there are either a lot of buyers or a lot of sellers there's really no context where a longbody candle is not communicating some serious Market sentiment however when we're talking about variations of these candles it's important to understand whether they're occurring when the stock is going sideways or whether the stock
is trending up so one of the things that's important to understand is that as an active Trader we're trading and wanting to trade trending markets we don't make money if we buy a stock at 12 and sell it an hour later at 12 we want to buy a stock at 12 and sell it at 15 we want to trade stocks that are moving and preferably moving quickly so I'm not going to be interested in trading range-bound sideways stocks but something it's important for you to understand is that when a stock is going sideways you may
initially have longbody candles as it's moving up and then you might have a red candle a couple red candles and then when you get into this area where it's just sort of going sideways you know more or less obviously these would be red and green the candles in this area do not communicate as much information and the reason is because the very fact that the stock is going sideways is already communicating that there's sort of indifference you know there's just sort of a balance between buyers and sellers there's not really strong sentiment so although there
are are some very specific Candlestick patterns and Candlestick shapes that I'm going to show you these are most significant when they occur in the context of a trending stock so I am only trading things that are trending trending means moving higher okay so in the context of something that is moving higher if for instance we have two really big longbody candles these are longbody candles you already you know that these communicate very strong Market sentiment now let's say the next candle does something different we'll give you a I'll give you a couple choices there's a
couple different things that this candle could do so the first thing that it could do is it the price could open it squeezes up but it is unable to hold that level and although it closes green it ends up pulling back a little bit before it closes now I filled in the body of that candle but that was just uh you could fill in these ones too this is a very specific candle and it's called a shooting star a shooting star well shooting stars come back to earth right they they come they come flying down
like that and when you see a shooting star it's named a shooting star to communicate so you understand this shape means something very likely is going to happen which is a decline the price is going to decline this shape combined with the name is a communication of Market sentiment we see the price has moved higher but got pushed back down now this candle could also be red and if it is red it's only a stronger communication that a reversal is coming the reversal in fact has already begun if the candle closes red if the candle
closes green it's an indicator that we are probably going to get a reversal but it's it's not a guarantee until a candle actually goes red and shows that weakness so a shooting star in the context of a trending stock is an indicator of a potential reversal so if you were in a trade for instance you got in down here you know you saw the stock you got in at a great price and it goes Higher and Higher and Higher and Higher and then you start seeing this candle forming your brain should be telling you wait
a second I need to be cautious this is a shooting star shooting stars often uh come just before a reversal and what's often true is that when we see back down here like this this is the opposite of a shooting star this also indicates a reversal so a shooting star is when a stock is moving up up up up up and then you have the long upper body sorry the long upper candle wick this right here is called a hammer if you want you could call it an inverted shooting star uh and some people do
but I don't think that that's a good name for it the name Hammer communicates a message just like shooting star communicates the price is going to decline Hammer is communicating that we're hammering out the base we're hammering out support the stock is holding at the low of the pullback all right so this level down here the low of this pullback is becoming support the price declined but it B bounced up off of it this is an indicator again of a possible reversal so this is true when this price has been declining and it's true whether
the price has been declining for you know 15 candles has just been going lower and lower and lower just imagine those are all full longbody candles and then you have a hammer right down here when you have a hammer right down here the inverted shooting star this is this is an indicator of a possible reversal and we get a really nice move back up so if you were in to the short side or you looking for that reversal the bounce off the low this is the candle you'd be waiting to see when I see this
candle especially after a string of consecutive red candles I am almost always a buyer okay now in this context this was a little bit different because we're really in a stock that is in a position where the stock is definitely trending higher this is just a short-term correction but one of the things that I think it's important to understand is that price rarely goes straight up price goes in waves it goes up and then it pulls back a little and it goes up and it pulls back a little it goes up because buyers are eager
they like the stock and maybe there are some short sellers who have a negative position and they need to cover it for a loss that short squeeze effect is what happened during the GameStop Saga in 2021 so as the stock is making its first leg up it's moving higher and then it starts to roll over and pull back why does that happen happen well if we look just on the chart here the reason this can happen is because up at these prices up here it no longer makes sense really to be a buyer because when
we buy stocks we want to buy knowing where our Max loss is and we figure out our Max loss using technical analysis and using Candlestick chart patterns and I usually set my Max loss at the low of the previous wave so if we're looking at a chart and it's just a bunch of really big green candles then we know that our Max loss is somewhere way down there we might not even be able to see it so that means it no longer really makes sense to buy it right up here that's not a safe entry
when your max loss is down here okay we want to be able to better position risk and reward so that I'm risking $1 to make $2 that's a good risk to reward ratio $1 for $2 and then the next one crosses over the high of that previous candle it's called a candle over candle pattern and so you may often hear me say I'm going to buy the first candle to make a new high these candles made lows new low new low new low relative to the previous candle new low new low new low so the
first candle that makes a new high boom right there I buy on this candle this pattern is telling me to buy right here as soon as the price crosses the high the previous candle I'm in all right so I'm in right there and I want to see that candle squeeze back up my stop loss is the low of the pullback my profit Target is a retest to the high of day and of course I'd like to see it go higher now it goes higher on the second wave up and then same thing happens again people
no longer feel they can buy it up here because the risk outweighs what they may feel as the reward potential so we get another shortterm correction a little pullback a little we'll pull back a couple candles and then we'll look for that first candle to make a new high now sometimes the first candle that makes a new high is not going to be following a picture perfect Hammer like this there are other candles however that can communicate that same degree of possible change in sentiment so let me start drawing out some of these candles we
already know about longbody candles green and red right those are long Body candles we know about shooting stars they have a longer upper candle wick and we know about uh hammers down at the bottom again these can be red or green doesn't matter so this is the hammer oops so this is the hammer candle right here and this one down here is the shooting star shooting star and then uh there's another candle that I'm going to show you which is called the dogee a doe opens and closes at basically the same price that's also communicating
in decision it means the stock went up and down but basically closed to the same price now a a typical DOI will open and Clos the same price but has a little upper candle wick and a little lower candle wick so it's it looks like a cross just like this and this once again is a very high likelihood showing that indecision that this is going to become the base there are a couple of different variations of the dogee we have this dogee right here we also have a dogee like this which is called a hanging
man and we have a dogee like this which is called a gravestone dogee those are the three most common dois that we see and they're all fairly ominous well in name certainly the hanging man and the gravestone dogee because when they occur at the top or bottom of a trend they're indicating something is likely to happen so here's the thing about the price action being indecisive when a stock is going sideways it's already indecisive that doesn't mean anything if we see a dogee but when the price is trending up really strongly and then suddenly we
see that candle of indecision that dogey or that shooting star that's a problem because when something is trending higher we want to just see lots of strong sentiment we don't want to see any degree of indecision when something is really extended and you see IND ision people get nervous and they they hit the exit all right so in this case here we might see a dogee and this is indicating the possible change in Trend now we could see um we could see a hanging man here that would be fine too a hanging man candle a
gravestone dogee would be a little bit less ideal because the problem with the gravestone dogee is that it closes at the bottom closing at the bottom is weak we'd rather see a degree of basing off of a level and then closing higher so I wouldn't be as big of a fan of a gravestone dogee in this location I would prefer to see either a standard dogee a hanging man or a hammer those would be preferable candles all right so if we jump back over here these are these are probably the most common individual candlesticks that
you're going to see these are Candlestick patterns individual Candlestick patterns to memorize to print out print it on a little card just like this and save it next to your desk that way when you start seeing those candlesticks in real time you're recognizing oh here we go we're at the top of a run we're seeing a shooting star we're at the bottom of a pullback we're seeing a hammer or we're seeing a dogee shooting star or dogee um hanging man or gravestone dogee all right so we'll put this one back right here the way I
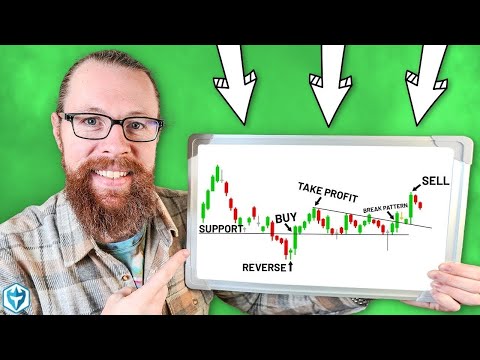
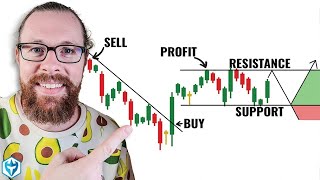
like to teach is I like to build progressively on everything that I'm already showing you so I like to start basic and then just layer on a little bit more detail in a little bit more detail so now if we look back at this chart that I've drawn here I want to talk about the concept of support and resistance so as we're seeing these waves moving higher there will naturally be areas of support and resistance one of the things that I like to do when I'm uh trading is I draw trend lines and this is
going to be called an ascending support trend line right here this trend line we would connect just like this and we see very often during active trading that stocks will respect these types of trend lines and so what that means is that once you have an established trend line like this when you start getting into a longer time frame this let's say goes up you know up here and then it starts to pull back right here it would be therefore predictable because this has ascending support right here we would predict that it's going to bounce
off this price this is called a trend line and it's an ascending trend line so right now we would call this ascending support it's support we connect the low of the first pullback and the low of the second pullback and then that can help us project and predict where the next pullback will find support so this is an ascending support trend line what I will often do as well is I'll draw one on the top side and this is going to be an ascending resistance trend line so as the price comes back up we connected
this line and this line so it was therefore predictable that the price would hit resistance right around here which means means because we saw this we knew this was a place other people would be selling and we would sell there as well we would sell into this level we would not expect that the price was just going to go higher and higher and higher because we knew we had this resistance level now look it's definitely possible and it happens that the price will pierce through a resistance level and if it can hold above that resistance
level that resistance level becomes a new level of support Port this is a very important concept to understand let's jump back onto the Whiteboard so I'm going to show you I'm going to erase this and I'm going to show you an example uh where this is going to be a little bit more clear okay so we have a stock here that has just started squeezing up it's moving higher and it's going to hit a level of resistance right here what is the level of resistance the level of resistance here is $1 $1 for a low
price penny stock is a very critical level of psychological resistance it is very hard for low price stocks to break and hold over $1 so many people put their sell orders at a dollar when they're in a stock at 25 or 30 cents that when the stock comes up to a dollar it's just like there's a wall holding it back it's resistance $1 in this case is considered psychological resistance it doesn't have to be based on a chart pattern it's based on just the psychological effect of Traders p orders at whole dollars this is true
with half dollars as well so really it's definitely true with a dollar but it's true all the way up when you're trading stocks that are lower priced $11 152 253 354 455 so on so forth up until maybe about 10 and then at $10 it operates more in the whole dollar range but we do still notice um around half dollars okay so the price comes up here and this is resistance so we would call this a um a horizontal resistance level so we could actually go ahead and draw a line right here if we wanted
to it's not perfectly horizontal but that's okay all right so first this is resistance so the price comes up to this level of resistance and it pulls back off that level it can't quite break it it comes back up again ah shoot it cannot quite break it it pulls back another time one more time and then it comes back up one more time and it pierces through it right here this is a chart pattern now we'll talk about this chart pattern in a moment but this chart pattern and many chart patterns occur around areas of
resistance what will often happen is the resistance has broken and now the price is going to come down right here and it's going to test it and as long as the price stays above $1 $1 is now become support it was resistance now it's support and now the price increases from here all right so let's say it goes all the way up to a150 so now we're at the whole dollar or the half dollar of a150 so once again we're at a $150 and what are we expecting we're going to see some degree of resistance
because it's a psychological area the price pulls back a little bit and then the next candle it busts through sometimes it won't pull back it just goes right through and we're like wow it held that level so well it definitely means that 150 is now psychological support it goes all all the way up to the next level which could be $2 so now this stock is up 100% on the day it's moving very quickly this is great we got to pull back here pull back here and on this candle it comes up breaks through it
then retests proves it can hold that level and then it moves higher okay so this is a very common Trend in a stock the stock is trending higher but it's hitting levels of resistance each time it breaks over that level of resistance if it can hold over it that now becomes support and of course we have our ascending and descending trend lines so if we connect this approximately this isn't a perfect drawing but approximately like this and then we have on the top side here something approximately like this what you'll notice is that many stocks
will trade in what's called a channel this is a channel and something that is so incredible to watch is when a stock breaks out of a channel so previously let's say this was um this was support of Ascend the ascending support trend line and then right here for whatever reason um the stock breaks down there's a sell order it breaks down and then when it comes back up where does it have resistance now it's underneath this level we see this both when it when the price declined and now it's underneath this level we also see
it when the price breaks above and then comes back down and holds support Above This level so a really important concept for you to understand is that support becomes resistance we see support in the form of ascending trend lines we can see resistance in the form of an ascending uh trend line as well we can also see descending support and resistance lines and we can see horizontal support and resistance lines which typically correspond to half dollars and whole dollars but can also just correspond to areas where for whatever reason you know it could be like
right here at 210 or whatever the price just sort of stalled out and it tapped that level several times and it just wasn't able to get above it so when I'm talking about Candlestick charts right now I I'm wanting to start sort of high level by helping you understand the anatomy of the individual candlesticks and to talk about the general concepts of support and resistance the better you can get at drawing support and resistance lines you're going to find they help you in your trading I can't tell you the number of times I've been able
to draw a trend line early in the morning so I'll draw a trend line connecting this low and this low right here this pen in Step so I'll draw the trend line just connecting these two and then from there the trend line extends out so you can have the trend line extend to the left or right you just connect it in two spots and then it extends and then all of a sudden hours later I'm seeing the price dropping and bouncing off this level or coming into the resistance of this level and it's like wow
this was such an obvious level so many people have it drawn this is a very powerful level of resistance so if you draw it and then you suddenly see the stock is declining or coming up and you see this trend line right there all of a sudden that's equipping you with more information so you can make a better decision in your trade maybe you're taking a bounce off of support because we know the closer we can buy to support the less risk we're taking on a trade if a stock has a lot of support at
$1 and we're buying it at A1 and two c we're only risking two cents a share that is fantastic we only need to make 4 cents to have a 2 to1 profit to loss ratio there are times where I've taken trades just like that where I've only risked maybe 100 $200 $300 and I've ended up making thousands of dollars because my risk was so low at that point it was like it's a no-brainer to take this trade but I wouldn't have been able to understand how small my risk was if I didn't understand how to
visualize support on the chart the best entries are going to be the entries near support okay so now let's talk a little bit more about multi Candlestick patterns so if an individual Candlestick we have our individual Candlestick shapes of long Body candles uh shooting stars Hammers and then do so these are 1 2 3 4 5 six six seven different candles right here and these are probably the most these are like vowels in language these are the most essential in every single almost every single pattern you will see these okay so what we're going to
do now is I'm going to show you the most basic word so to speak in the language of the financial markets okay we have a stock let's just say that all of a sudden there's a news event news comes out right here and it's 700 a.m. all right at 7: a.m. news has come out and the price is squeezing up awesome okay well the thing is for those of you that have been trading for a while you might already know this but for those that are new as soon as news comes out whether it's earnings
or FDA approvals or clinical trial results whatever it is the second news comes out a stock will start moving and you might think how can I get in before the news you can't the only people really the only people that get in before the news are insiders and they're not supposed to do that although we know that it happens sometimes but the only people that are getting in the second the news comes out are high frequency trading algorithms and those are designed by like Harvard MIT graduates incredibly sophisticated Engineers really really smart people working for
hedge funds with millions millions billions of dollars okay so we're not going to be able to get in typically for that first Spike that's all right that's just fine we want to wait for a pull back anyways so I let the price pull back and typically these are my rules of thumb number one it should never retrace more than 50% so if it goes from doesn't matter 50% that's that's how much is doesn't matter the size of the candle if this is from $1 to $2 or this is from A110 to a120 we don't want
to see it retrace more than 50% of this initial move so this is approximately the 50% line okay so if it were R traces you know 20% 30% that's fine a little retracement a little pullback is okay we want to see a light pullback and then what I look for are two things number one I would always love to see a candle that has a bottoming tail whether it's a hanging man it's a dogee or it's a small Hammer I would like to see that bottoming tail because what that bottoming tail communicates is that the
price drops but it came back up right so it just shows as the bottoming tail but we know we had a decline and a rally back up and what I want to do is I want to buy the next candle if it does a candle over candle formation and makes a new high that's the moment I'm in and my Max loss is the low of this candle right here so let's just say for the sake of argument this stock is priced at about $4 a share the low of this candle is 410 let's say the
high high up here is 430 all right so if the high is 430 I know that my profit Target is that this stock goes back to the high of day that means in this case my profit Target is 20 cents a share if I'm going to have a profit potential of 20 cents a share my risk needs to be half of that which is 10 cents right so 10 cents means my stop would be at about $4 that would be that would be my Max my Max loss if I was in at 410 if I'm
getting in if actually my entry is right here at 415 or whatever then maybe it needs to go up to 435 or 445 in any case 2:1 profit loss ratio is what I'm going to aim for and this pattern that you're seeing right here is called a bull flag so this is called a bull flag pattern and the reason it's called that is because when the stock makes its first move up this is considered the flag pole and this little area of sideways consolidation forms a little pennant a little flag here if you drew a
resistance line from the top of the candles to this and you sort of connected it like this so that's an expression it's a bull flag it looks like that and it's very this very amateur it it it looks it doesn't really look like that but that's where the name comes from and it's bull because it's a bullish pattern which means the expectation is that this resolves and the price goes up so This truly is a universal pattern we see it in the markets all the time and when I see that big green candle surge up
I am looking for the pullback maybe two small red candles and then I'm looking for the first candle to make a new high so my number one pattern number one is the bull flag and I also call this trading the first pullback so I let the stock squeeze up and then I'm buying that first pullback Sometimes I will do variation to this trade where I'm buying even as it's still selling because I'm so confident that it's going to curl back up that confidence would come either from looking at the price and seeing that it's pulling
back but it's near an area of psychological support such as a whole dollar or a half dollar that degree of confidence could come from already being familiar with the stock really liking the news Catalyst thinking it's a very strong news Catalyst or because we're in a market that is incredibly strong I I also want to take a moment to say that what I'm going to share with you in this class are some of the patterns that have the highest probability of success they are not the only patterns you can trade but as a beginner or
even an intermediate to moderately experienced Trader who is not at the level of profitability they want to be at it makes sense to focus on the patterns that have the highest degree of success of res resolving in the right direction so when you start getting into somewhat more experimental patterns that are a little more obscure I might trade those on my own in my own trading but for begin beginners it's better to stick with sort of tried and true basic setups okay so the bull flag is pattern number one the second is a variation of
the bull flag and it's called an ABCD pattern so an ABCD pattern this one's the one that's dead where' my orange one go I don't know it's fine so AB c d pattern it's a variation of the bull flag number two and what happens is the price comes up but this level at the high of resistance can't break it doesn't break and so it actually pulls back a second time for usually two more candles and then on the third attempt it pushes through or maybe it's the second attempt um so you got the first push
the second push and then the third push or first pullback and then we got second pullback and then it goes through what I really like about this pattern is that we have a very clear level down here of ascending support and this ascending support line essentially what it does is almost forces the stock to experience an apex it has to come to this Apex point right here where it's either going to break to the upside or it's going to break to the downside something is going to happen now if it breaks to the downside then
the pattern's over if it breaks to the upside that's great so this is something that although on the one hand it's not ideal that it failed on the first attempt the fact that it failed but it is still holding up gives more Traders the opportunity to see the pattern and therefore take the trade and potentially buy it so ABCD patterns can be very strong this is a pattern that I really like a lot and now the third pattern that I'm going to share with you is called the micro pullback number three micro pullback all right
so this is also a really interesting pattern um the ABCD pattern is a variation of the bull flag that takes more time to resolve the micro pullback is a variation of the bull flag that's like supercharged it's even faster all right so let's go on to this side of the Whiteboard and I'll erase this section hopefully you already grabbed this in your notes okay so on a micro pullback we have the news event typically so we have news right here the price immediately starts squeezing up surging higher and the stock pulls back only for a
moment it pulls back here and then it immediately blasts higher this can be hard for beginner Traders because they're like Ross you know this is a tiny bull flag it's so small it barely pulled back but it is what I would call a micro pullback it did pull back even if only for one candle it pulled back and what this pattern ultimately communicates is that the stock is so strong that the second it pulled back buyers came in and bought up that dip immediately and it goes to the next level up so in fact my
biggest winners hands down are on micro pullbacks because my biggest winners are on stocks that are so strong they hardly want to pullback at all but the problem for me is if it didn't pull back at all right if it just went straight straight up like this well where am I going to trade that you know I can't buy it up here up here up here because my risk remember is based on the low of the previous wave and so something that I'm going to share with you as just a little bit of um wisdom
we're we're to the wise and and this is something that um you can if you read this book uh this book is called thinking in bets it's by Annie Duke it's a great book um H you can get it on audio book too but she talks about making smart decisions and when you don't have all the facts now when it comes to trading we have a degree of certainty but timately we're making a decision and we're trying to predict what's going to happen next Traders can fall into a really dangerous habit of quantifying our decisions
as being good or bad based purely on the outcome of the decision so no doubt if you took a trade you bought this stock at $10 at the very top of the move I would look at that and you lost I would look at that and I would say okay you know what was your your decision what was your risk this was a bad trade but if you bought that and it went higher and you made money does that mean it was a good trade it would be easy for a Trader to say it was
a good trade because I made money and if you had said no I'm not going to buy it there and it went higher you would say that was a bad decision because the stock went higher without me so rather than qualifying decisions as being good or bad based purely on the outcome what I try to do is I try to put the decision in a little bit of a bubble where I say at the moment that I made the decision what did I know so for instance I actually had a day just yesterday where I
traded in the morning and I made some money and then a stock made a huge move later in the day and some people were like Ross I can't believe you didn't trade that and that can lead initially to the feeling of fomo and frustration disappointment I could have would have should have and I said no no no wait a second I walked away when I did yesterday because it was at a time of day where I should have already made a lot more progress than I had I had not yet hit my daily goal I
had made some profit and I gave some back I felt like the market was choppy I didn't feel like I had a good read on it and I said you know what it's better to walk away right now with some profit in my pocket real money in my pocket rather than give it back because I know statistically if I keep trading when I don't have a cushion I'm going to make a mistake and I'm going to go red so it's always better to have a small green day than to go red so my decision in
that moment was the right decision now as it turns out had I kept trading is it possible that I could have made a lot of money trading that stock that goes up it's possible but hindsight is always going to be biased to favor that you would have done well and the reality is sometimes you would have actually kept trading and lost money anyways um quantify or qualify trades as being good or bad based on um the the decision that you made at the time not the outcome of the trade okay so with those micro pullbacks
I can do extremely well and sometimes this first candle opens and the next candle sometimes it's like it's it's almost like this it opens just a teeny bit lower and then pushes higher but I'm okay with taking this micro pullback especially when this is around a whole dollar or a half doll level of resistance because I know that these are levels where once the stock breaks over it I can use that level to base my U my support Okay so we've spent a fair amount of time talking about Candlestick patterns which is good I want
you to have a really good understanding of this because ultimately while technical indicators are valuable they cannot be a substitute for Candlestick chart patterns Candlestick patterns are where all the information comes from that gets populated into the technical indicators all right but technical indicators are worth mentioning so let's get on on the board the Whiteboard here and let's talk about some of my favorite technical indicators okay so when we're looking at a chart pattern what I've shown you so far is the pattern of this as the price moves up so long body Candlestick light light
pullback maybe here we get a dogee and then we get another move back up but there's something that I have left out that is extremely important in helping me predict whether the price is going to continue higher or it's going to decline and that is an indicator that we're going to put right down here underneath the price and it is volume so we usually have a volume bar down here at the bottom and what I like to see is increasing volume as the price is moving up lighter volume on the pullback even higher volume as
the price goes higher lighter volume on the pullback and higher volume as it continues higher I don't actually draw trend lines on the volume but I'd like to see the volume is generally increasing this tells me more and more Traders are interested in buying the stock NOW the next indicator uses volume and price together to create the volume weighted average price it's the volume weighted average price it is actually factoring in the price of the stock and the amount of shares that traded to give you an average price this is a really important gut check
the the stock should always be priced well above vwap when it's trending higher it's very common that when we see a pullback we see a sharp pullback we'll see the price bounce off the vwap vwap is almost always a significant area of support when the price is above it so we'll see a bounce and sometimes we'll end up seeing a move all the way back up but if the price goes below and breaks below vwap it usually will have a hard time getting back up above it because this is now resistance okay now the next
indicator that I'm going to draw here I'll draw it in this uh this line this color here Brown This is called a moving average so the moving averages um the thing with these indicators is that they're telling us the average price of the stock over a set period of time so I use the nine and I use the 20 let conf using a draw it that way uh it makes it look like it's divided I use the nine exponential moving average and I also use the 20 exponential moving average the 9 will always be faster
than the 20 because the average price of the last nine candlesticks 1 2 3 4 5 6 7 8 nine is going to be a higher average price than the average price of the last 20 candlesticks it's going to be a lower price however the reason I use this is because when we have a trending stock that's moving higher these moving averages they help kind of show they help us understand how extended the stock is when it starts to get really really extended the risk is higher because those moving averages are a moving level of
support and this again comes back to the fact that we know when we buy closer to support we've got a better entry that allows us to manage a risk and that can mean we're more profitable so I use moving averages as levels of support I look for the stock to return around the nine moving average and when we're looking at um we're looking at these patterns one of the things that you'll notice is you'll you'll watch these stocks and it's like you know they just sort of they move up all day long and the stock
goes up and then down up and then down up and then down up and then down up and then down and the whole time it's like just bouncing off the nine exponential moving average and when it finally pulls back a little bit more it's coming down to the 20 EMA so these are two very well-respected moving averages Traders know that when a stock is strong and it pulls back to the 9 EMA that's usually a buying opportunity that's a Buy Signal so and then if it breaks the 90 ma then that's a sell signal so
this is an indicator that is an oscillating indicator oscillating means it goes up and down on sort of a spectrum so the way this indicator works is we have like this and then it goes like this and what it's doing this is called macd macd it's a moving average convergence Divergence indicator so when the moving averages are moving when the stock is moving up quickly the moving averages are diverging they're moving apart so when they're moving apart the signal line on the macd will start moving up like this and then when the indicators when when
the moving averages start converging which they started doing in this area here in this area they're converging in this area they're pulling apart so the the more accurate depiction of this macd would be um it's moving apart and then coming back here so it's a little bit of a a little bit more like that it's not this isn't a perfect representation in the drawing form uh but one of the things that can be helpful with having macd is I have found by far that I make the most money when the macd is above the signal
line so when the average is above the signal line which means that the moving averages are pulling apart they're pulling apart they're diverging because the price is moving up so once we get the converging up here at the top the moving averages of the 9 and the 20 start moving closer together then the price is rolling over over and once they do cross over here then at that point for me I don't want to trade past that point at that point I'm done I'm done with the trade so this is another indicator that is a
bit of a gut check that helps put current price action in context when I see the macd is positive and is in favor of the trade then I'm thinking okay this is a setup that I can feel comfortable with when I see the macd has crossed over then I'm thinking nope I don't want to take any more trades from this point forward are there some people who will trade and initiate positions based simply on a macd crossover there there probably are but I think that's a very primitive way of trading ultimately the best way to
trade is to go direct to the actual candlesticks this is what's telling you what's actually happening right now in real time in fact this is what's telling you what just happened so by looking at these candlesticks this is where we're getting the real buy and sell signals are indicators here of volume when we have volume all it's doing is either confirming what we thought looks good it's like Yep this confirms everything we like no issue or it's giving the chance to say wait a second we got a red flag here this is a problem we've
got two big red candles three big red candles this is no good and then it's like well I everything looked good but I checked one of my indicators and this said no go on the trade or I saw this pattern but it's below vwap now the only way that pattern could exist below the volume weighted average price is if the stock had previously sold off a ton the vwap is like way up here and then the price started climbing back up right but there are some beginner traders who would look at this and not realize
wait a second hello we've got vwap right here this is not a place to be buying you cannot buy this right here so if you were really zoomed in you might lose fact you might sort of lose the context that you're below vwap or that you just had this big sell off because this is occurring within a context so we want to see that we're above vwap we want to see if the volume is not giving us a red flag and we want to see when it comes to the macd that the moving averages are
pulling apart if the moving averages are converging then what that tells us again is that at some point previously the stock already made a big move and now the moving average are coming back together which means ultimately if we're trading it here we're trading it kind of on the back side of the move and something that I talk about quite a bit in trading is that I want to be trading aggressively at the beginning of the move I want to buy that first pullback I want to trade that micro pullback I want to trade the
second pullback but beyond that I don't want to overstay my welcome now if I didn't make as much on the stock as I feel I could have would have should have that's neither here nor there the market doesn't care about my feelings right I have to focus on the chart pattern and the patterns resolve the best earlier in the move when it gets a little bit later often the people still started fighting it out are the people who either don't have discipline or who didn't make money earlier the people who make money early they walk
away they learn to do that because that's what makes you consistently profitable making a little bit money and walking away just like I did yesterday and I did the same thing today and I'll do the same thing tomorrow it's about being consistent success in trading it's not about hitting home runs it's about being consistent and hitting base hits and implementing a strategy that you know works because you have historical data that's what I have I have years of historical data so my $583 to $10 million small account challenge that's seven years of audited broker statements
so right down in the descri top of the description and pinned in the comments is a link to download my small account strategy PDF that's going to pair nicely with everything you're learning right now in technical analysis because my small account strategy PDF actually walks you through the setups that I trade when I'm in a small account where I'm getting in where I'm getting out the rules that I'm following now I can give you the rules I can share with you everything about my strategy but it'll be up to you to have the discipline to
follow the rules so I hope that you'll be able to do it because as you know trading this is pretty exciting stuff there's an incredible amount of potential to being a Trader but it will only come from those who are dedicated disciplined driven and are extremely patient you have to wait for these a quality setups to come to you if you found this episode interesting make sure you hit the thumbs up make sure you subscribe to the channel and if you want to learn about how to find the strongest stocks to trade each day you
can check out this episode right here and make sure you don't forget to download my small account strategy PDF I'll see you for the next episode real soon
Related Videos

47:29
Ultimate Beginners Guide to Candlestick Pa...
Ross Cameron - Warrior Trading
242,779 views

1:41:30
The ONLY Technical Analysis Guide You'll E...
Ross Cameron - Warrior Trading
229,878 views

1:06:10
TRUMP CABINET MEETING: President Trump hos...
LiveNOW from FOX
302,830 views

54:56
How to Read Candlestick Patterns (Step-by-...
Ross Cameron - Warrior Trading
598,937 views
55:21
How to Pick the BEST Stocks for Trading (w...
Ross Cameron - Warrior Trading
395,368 views

11:49
Trump Clears Up Musk's Ultimatum Email, Ma...
Jimmy Kimmel Live
1,330,370 views

9:50
ELON MUSK: 'There are dead people working ...
LiveNOW from FOX
456,616 views

55:11
Master This ONE Candlestick Pattern TODAY ...
Ross Cameron - Warrior Trading
1,317,954 views

21:52
Jon Stewart Reworks Trump & Elon’s Sweepin...
The Daily Show
4,936,770 views
1:04:29
How to WIN at Day Trading as a BEGINNER in...
Ross Cameron - Warrior Trading
655,255 views
25:54
How Traders (Legally) Pay ZERO in Taxes
Ross Cameron - Warrior Trading
724,373 views

12:51
Vulgar Replies To Musk's Email | Trump's M...
The Late Show with Stephen Colbert
1,893,171 views

22:09
All Hell Breaks Loose When Maxwell Frost I...
Forbes Breaking News
230,576 views

48:15
Reading Candlestick Charts Was HARD Until ...
Ross Cameron - Warrior Trading
1,286,628 views

57:30
Trading Was HARD Until I Learned This… 💥 ...
Ross Cameron - Warrior Trading
102,979 views

42:08
Technical Analysis For Beginners (The Ulti...
Rayner Teo
2,808,579 views
58:48
How Nick Went From 3 Years of Breakeven Tr...
Ross Cameron - Warrior Trading
50,163 views
55:18
How to Read Candlestick Charts (with ZERO ...
Ross Cameron - Warrior Trading
3,152,986 views

3:05:03
27 Years of Trading Knowledge in 3hrs and ...
Ross Cameron - Warrior Trading
391,225 views

3:06:12
The Ultimate Day Trading Guide for 2025 (F...
Ross Cameron - Warrior Trading
301,803 views