The Ultimate Bitcoin Cheatsheet For 2024 and 2025
53.64k Aufrufe2498 WörterText kopierenTeilen
Rekt Capital
🔥 GET MY FREE NEWSLETTER 👉https://newsletter.rektcapital.co/#/portal/account/plans
🎯 JOIN MY FRE...
Video-Transkript:
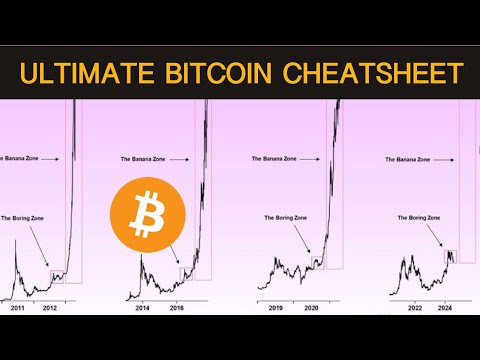
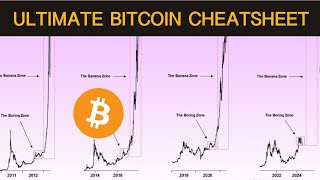
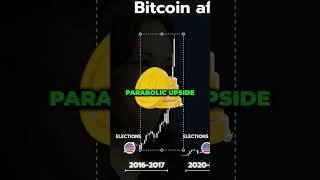
is the ultimate Bitcoin cheat sheet that you need to know going into the end of this year and 2025 as you know we're already in the banana zone so we'll be talking about this in a lot of detail in the next few charts so subscribe to the channel for more videos like this in the future like this video if you enjoy content like this going forward and let's dive right into it so we're very familiar with the boring Zone and the banana Zone the boring Zone tends to occur for quite a few months after the
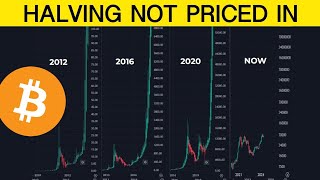
harving event but that tends to proceed parabolic price action towards the upside and we've seen this across Cycles from 2012 to 2016 and of course 2020 to then really transitioning into this cycle 2024 and now we are in the banana Zone very firmly and as you can see we've been talking about this reaccumulation phase for a long time and one of the things to really take note of is that this re accumulation phase in 2020 post Haring reaccumulation that lasted 163 days in this cycle we saw that reaccumulation phase elongate and extend by an additional
45 days or so and that's really important to take note because if we're considering a parabolic phase from 2020 which lasted 385 days can we really consider a copypaste scenario based on the fact that potentially this reaccumulation phase has potentially eaten into our parabolic phase so if we talk about 160 days and then we have those extra 145 days that otherwise could have been in the parabolic upside phase does it mean that this reaccumulation phase at into this parabolic upside phase or are we going to actually see parabolic phase extend a little bit and from
my perspective I think this would mean that the parabolic phase is a little bit shorter and it's better to talk about it in worst case scenarios because that would just mean that this parabolic phase in the cycle could be shorter by 45 days and and let's just entertain that for a second because when we're talking about this banana Zone things really do go parabolic we've seen that so many times in the past and let's just talk about some of these zones because we'd see uninterrupted upside small dips on the upside and very few Corrections in
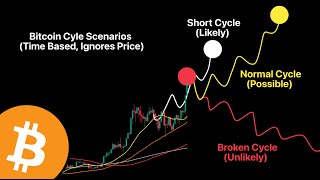
the middle so these Corrections tend to occur those tend to be fantastic bide opportunities especially if you consider the first major Corrections so we had a first major correction here in the 2016 cycle and then a second major correction but the third major correction that was already the end of the bull market so going back to 2020 here here we have a dip here we have that first major correction maybe a second major correction and then we don't get a third major correction so we do see the bare Market develop after that bull market Peak
so going back to 2012 for example we see very few moments of rest Spite and pulling back for bitcoin's Price action so once we do crash after a 300 day parabolic upside period that tends to be the end of the bull market so we're probably going to be getting a dip at some point right we're probably going to get a price Discovery correction at some point as we've seen in the past we might get a second one in the future as well as we've seen in the past but in the meantime we're going to see
price Discovery uptrend number one and so this is really that sort of ultimate cheat sheet that's going to really guide you over these next few months and 2025 we have that first parabolic uptrend and that dipping there here first parabolic uptrend before that dipping so that's the first parabolic uptrend then we get that dip which across Cycles tends to happen we then see the second parabolic upside as you can see here cross cycle and then of course that major correction which essentially you can just do this right because we see a correction here a correction
here we'll see a correction here as well at some point and then maybe one one final correction near the top and that just gives us an idea in terms of the road map of what to expect going forward but if we're talking about these reaccumulation phases this was 160 days after having this was slightly longer at 205 days after the Haring 2016 gives us a bit more clarity on the fact that this was 150 days after having 154 days after having that this reaccumulation phase took place but then you can actually see that the parabolic
phase of the cycle actually lasts 350 days so if we're comparing 2020 in that regard the 2016 phase was slightly shorter so we have 385 days parabolic upside in 2020 357 days parabolic upside in 2016 so are we seeing some sort of extension in the parabolic phase from 2016 to 2020 and so it's a little bit there are quite a few variables because we're seeing an extension in the reaccumulation phase by 45 days and if we're comparing the 385 days of 2020 and 360 days of 2016 then there there's an extension in the parabolic phase
of the cycle by some 30 days almost so if we've extended by 45 days in the reaccumulation phase and we tend to see some extension by 30 days or so in the parabolic phase of the cycle across time then does this extension then cancel out with that potential extension in the parabolic phase of the cycle that we tend to see overall I talk about this in a lot of detail in the Rex Capital newsletter in my most recent newsletter so feel free to check out the link in the description down below and feel free to
read and really find out what I talk about and how I come up with the idea that maybe we do see a slightly earlier peak in the bull market as a result of the acceleration that's still remaining in the cycle remember we broke out 2 weeks before schedule in terms of the 214 days after having where we tend to see new alltime highs we broke out 205 days after the having so a bit of a 2 we acceleration there but that's pretty phenomenal because when we peaked in the first old or new alltime high at
the time this was an acceleration of 260 days 260 days and we narrowed that down to just 14 days which is impressive dramatic but nonetheless there is a lingering rate of acceleration in this cycle that we simply cannot ignore and if we just take away 14 days from this potential period here we factor in the fact that we have 45 days right over here and maybe we do see an extension in terms of parabolic upside across phases and across Cycles then really what do we come down to we come down to a conservative estimate of
approximately 300 days and that just gives you a bit of an average it factors in the worst case scenario that we top out a little bit sooner factors in the acceleration in the cycle it factors in the extended reaccumulation phase in this cycle it factors in quite a few variables that most people aren't going to factor in because it's not really engagement worthy whereas here we're actually trying to come up with a realistic road map and plan to Financial Freedom and that's what we always do here on the channel on my Twitter on my ex
we always do that in the re Capital newsletter so if you haven't signed up to the newsletter feel free to click in the link in the description down below but I think it's really important to also talk about diminishing returns and the fact that we are exiting this reaccumulation phase of the cycle we always see reaccumulation around old alltime highs we tend to see these ranges be either very short very zigzaggy and very volatile very short again or extremely overextended in terms of time 205 days let's repeat that but then inevitably we transition out of
that phase and you can see here that of course we tend to see phenomenal upside to the next bull market Peak the final new alltime high that we get before the bare Market but of course we have to understand that there is diminishing returns involved in each of these cycles and that doesn't mean that we're going to struggle in this cycle but we have to be cognizant of some of the changes that inevit occur in the maturing asset class that Bitcoin is and what's interesting is that this chart simply can't keep up with the price
action because Bitcoin right now is at 912k and that's a little bit too quick for this price chart to keep up and the BNC the Bitcoin liquid index it's great to just showcase history dating back to even 2011 but does struggle to keep up with the price action in real time but nonetheless I do digress if we talk about diminishing returns and we think about maybe having having some of that diminishing some of those returns then that still gets us into 150 130 120 so there is still upside left to enjoy for bitcoin's Price action
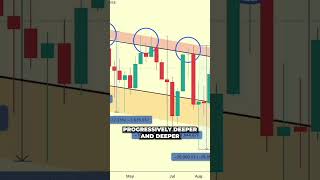
and if we talk about some of these phases in terms of length then this is something we get to enjoy in terms of a 300 day window for the parabolic phase of the cycle and the parabolic phase of the cycle isn't by by any means smooth sailing you can see that we tend to see Corrections on the way up those are your moments for dollar C averaging into the market but it's important to do so more with conviction in the very early stages of those price Discovery waves and if we talk about diminishing returns across
Cycles then we need to talk about diminishing returns across price Discovery uptrends so this is that price discovery uptrend in the very first 8 weeks of price Discovery and over here we had this for 4 weeks so this was the first price Discovery uptrend and notice how that also diminishes across time in 2017 and then you'll notice here as well in 2021 where we also diminish before we finally pull back but not that much which is quite interesting that diminishing rate of return Isn't that interesting and I'm or at least too big which I'm trying
to say and so if we do something like this then of course we need to factor that diminishing rate of return but it does give us an idea that well maybe we halfway through this price Discovery wave potentially with a little bit more so maybe 40% more in this price Discovery wave this very first one before we then see that first major price Discovery correction in the future and of course it's bound to happen and really don't ignore it because they can be that's a high probability opportunity that really lays ahead and 2013 showed us
that this can be quite a significant opportunity but this is 25% for example here that's also some 30 25% and this last 2 to 3 weeks here it lasted a little bit longer than that but it's enough to convince people that the bull market is over and that the bare Market is beginning and so people are going to think that we're already here and going to experience a year-long bare Market whereas we still have quite a bit of upside left to enjoy so price Discovery wave one is right underway it's it's already in play it's
two weeks in we saw a 4-we price Discovery wave here we saw an 8we price Discovery wave here we saw a 6 weeks price Discovery wave right over here and then we saw a several week price Discovery correction afterwards multi-week price Discovery correction afterwards and then multi-week price Discovery correction afterwards as well but then what follows is that next price Discovery wave in 2020 here again but just notice how we transition into another price Discovery correction and even in 2013 you can see that once we finally transition out from in fact if you think about
this as the price Discovery wave wave two then you see this is a 25% reaccumulation phase and pullback opportunity so that's price Discovery correction number two in 2013 and then we embark on that last price Discovery wave towards the upside in 2013 and here is the same for 2017 maybe a small dip in the meantime and of course this is that final price Discovery wave in 2021 so essentially the the real takeaways here are price Discovery wave uptrend number one is in progress still it's only week two so still a few weeks left we have
4 to8 weeks generally in this price Discovery wave then we could suffer a major price Discovery correction of approximately 25% 30% maybe 20% that's going to last 2 to 3 weeks then we're going to see that second price Discovery uptrend wave before we have that price Discovery correction that second one which could also be once again a 30% pullback and then the final price Discovery wave into new alltime highs and that's probably that's probably going to be it that's going to be the new alltime highs the final alltime highs and that's going to be it
for that sort of price appreciation so I talk about whether we're going to have a a shorter parabolic upside phase in direct capital newsletter check it out find out more click in the link in the description down below to read more about it I talk about the price Discovery waves in a lot of detail in the re Capital newsletter check out the link in the description find out more read more about it there are so many opportunities still left in the market when it comes to bitcoin's price action with these potential price Discovery Corrections still
ahead in the future but just note that altcoins haven't yet even begun their macro uptrends they're only just beginning their uptrends so still so much more to enjoy when it comes to altcoins and still so much left ahead for Bitcoin but not too much left in this video that's about it for today's video thanks so much subscribe to the channel for more videos like this in the future like this video if you enjoy content like this going forward I'm re capital and I'll speak to you in the next one speak to you soon
Ähnliche Videos
4:29
Bitcoin rally is just getting started, say...
CNBC Television
22,682 views
![[LIVE] Jerome Powell Speaking – Power Hour Market Reactions!](https://img.youtube.com/vi/oKIeFhfq4Ho/mqdefault.jpg)
[LIVE] Jerome Powell Speaking – Power Hour...
Trade Brigade

10:22
Bitcoin & The Pi Cycle Top Indicator - A C...
Rekt Capital
9,486 views
10:50
The One Bitcoin Chart That You Need For Su...
Rekt Capital
14,597 views

(LIVE NOW) Federal Reserve Chair Jerome Po...
Ricky Gutierrez

This is the most undervalued AI name in th...
Tom Nash

9:33
How Long Will The Bitcoin Bull Market Last?
Rekt Capital
38,148 views
9:54
Here’s Why the Bitcoin Halving Is NOT Pric...
Rekt Capital
31,448 views
Broad Market Review - We Did It
Josh Olszewicz

12:20
The Bitcoin Parabolic Phase Is Here - Pric...
Rekt Capital
37,725 views
12:54
Don't Make This Mistake
Crypto Currently
1,304 views

11:39
The One Bitcoin Chart That You Need For Su...
Rekt Capital
48,186 views
10:18
The Ultimate Bitcoin Cheatsheet For 2024 a...
Rekt Capital
46,961 views
1:00
Next Months Will Change Your Life #shorts ...
Rekt Capital
5,001 views

13:18
3 Reasons Why You Should NOT Buy Bitcoin R...
Rekt Capital
26,385 views

🔴 Fed Jerome Powell Live Dallas Regional ...
Tom Crown
0:59
Bitcoin & 2024 U.S. Elections: The Complet...
Rekt Capital
4,817 views

11:07
Where Is Bitcoin's Parabolic Phase of The ...
Rekt Capital
29,344 views

10:16
The Bitcoin Transitional Phase - Historic ...
Rekt Capital
16,373 views
1:00
3 Reasons Why You Should NOT Buy Bitcoin R...
Rekt Capital
4,382 views