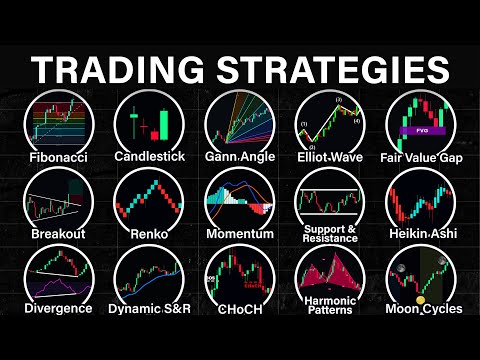
Every Trading Strategy Explained in 12 Minutes
895.84k views2076 WordsCopy TextShare
Data Trader
SimplexFX (Where I Trade): https://simplefx.unilink.io/n/DIMMP7Y
✅ Earn $40 bonus for a deposit abov...
Video Transcript:
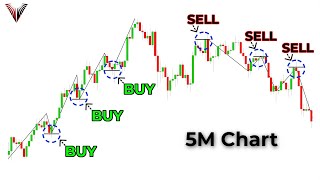
Fibonacci retracements it is a tool that displays horizontal lines based on the Fibonacci numbers these lines can then be used as key support and resistance levels to use the Fibonacci retracement tool you first start by identifying a swing low and swing high on a chart then drag the tool from the swing low to the swing High next wait for the price to make a pull back to one of these levels ideally the 0. 382 Fibonacci level because that's the most common level where price tends to reverse from so if price touches that level that could be a good buy entry keep in mind that price could also reverse from other Fibonacci levels combine it with other confirmation signals to get a better entry breakout patterns it is when price makes a sudden and significant movement towards One Direction This usually forms after the market makes a consolidation period for example here we can see that the price is consolidating then it suddenly moves sharply to the downside this is called a Breakout to take advantage of this Traders could use specific patterns as a guide to identify breakouts before they happen most notable breakout patterns includes wedges triangles and the rectangle pattern reversal patterns it is when price moves in the opposite direction of the current Trend and forms a counter Trend specific patterns could be identified in a chart which could help Traders predict reversals before they happen most notable reversal patterns are double top and bottoms triple top and bottoms Head and Shoulders cups and handles aliot wave it is a theory that suggests that market tends to move in a series of five waves before reversing and forming another set of waves in the opposite direction by understanding the Elliot wave sequence Traders could predict where the price is Heading by following the pattern in a chart we can label each point of the Waves as 1 2 3 4 5 and ABC now there are specific rules to ensure that a movement is considered as a valid Elliot wave first wave 2 cannot be longer than wave 1 and usually pulls back to the 0. 618 Fibonacci level second wave three must be the longest wave amongst Wave 1 3 and five third Wave 4 must remain above the peak of wave 1 and usually pulls back to the 0.
382 Fibonacci level so here's an example of the Elliot wave in action in this chart we can see that the price resembles a possible one 23 Elliot wave and So based on the theory of wave 4 which is that price tends to pull back to the 0. 382 Fibonacci level before continuing upwards we can use this as a potential buy entry when price makes a pullback fair value gaps a fair value Gap occurs when a candle forms a significant Gap due to an imbalance of buying or selling to find a fair value Gap you first need to find a candle with a large body then draw a rectangle at the Gap place between the previous candles swick and the next candles swick this level now acts as a potential magnet where price May revisit before continuing its movement Candlestick patterns it is a technique that Traders use to analyze future price movements by looking at specific Candlestick shapes notable Candlestick patterns include engulfing patterns which signal strong momentum towards the direction of the engulfing candle hammer and shooting star patterns which indicates rejection as shown by the long Wick on one side DOI patterns which signals neutrality in the market ha kanashi it is an indicator that fully replaces a traditional Candlestick chart to a hinachi chart when applied it tends to give less noise than a traditional Candlestick a green hinachi candle signals that the price is on an uptrend and a red HK kanashi candle signals that the price is on a downtrend the size of the candle's body also indicates how strong a trend is the larger the candle the stronger the trend keep in mind that the ha kanashi only acts as an indicator it does not display the real market price moon phases it is a concept that utilizes moon cycles to time the market moon face Traders believe that Moon cycles are correlated with human emotions and behavior which could have an influence on the market specific Moon phases are believed to be favorable towards a certain Trend a new moon means the market tends to be bullish and a full moon means the market tends to be bearish today it is used mostly As as a confirmation tool ranko it replaces a traditional Candlestick chart to a ranco chart so unlike a traditional Candlestick which forms a new candle based on a certain period of time a ranco chart forms its block based on the change of price for example every 1% change in price a wrinkle block appears this means that each wrinkle block represents a 1% change in price of course you can change the parameters of this through the indicator settings Traders could utilize ranco Tarts to filter out noise and identify Trends a Green rankle Block signals an uptrend and a red rankle block signals a downtrend and keep in mind that Rano charts only acts as an indicator it does not display the real market price harmonic patterns these are Advanced price patterns that follows a specific shape based on Fibonacci numbers Traders can then use these specific shapes to predict future price movements for example a bullish bad pattern is formed when price makes a series of four movements ments that is shaped like the letter M each point can be labeled as x a b c and d and each of these points has a specific guideline for example point x to point B needs to have a value between 0. 382 and 0.
5 point a to c needs to have a value between 0. 382 and 0.
Related Videos

13:15
TOP 4 Trading Strategies to Make $500/Day ...
Data Trader
156,627 views
25:25
How I Made Millions As The World’s Best Tr...
LADbible TV
1,755,928 views

21:58
How I Nailed Trading with the MACD Indicat...
Ross Cameron - Warrior Trading
342,352 views

30:49
Learn ICT Concepts in 30 Minutes!
Fractal Flow - Pro Trading Strategies
1,158,488 views

11:00
"People are broke." Walmart issues surpris...
Reventure Consulting
33,903 views
53:16
Ultimate Candlestick Patterns Trading Cour...
Wysetrade
4,381,141 views

32:21
15 Best Price Action Strategies After 15 Y...
Wysetrade
1,459,087 views

39:19
Support And Resistance Didn't Work Till I ...
Rayner Teo
1,675,841 views

55:11
The ONLY Candlestick Pattern You'll EVER N...
Ross Cameron - Warrior Trading
732,436 views
8:24
How to Avoid False Breakouts (My Secret Te...
TradingLab
2,752,551 views

11:21
STOP Using The MACD! Try THIS Indicator In...
Data Trader
1,480,108 views

31:16
5 Price Action Rules EVERY Trader NEEDS To...
Thomas Wade
1,743,527 views

13:39
My Incredibly Easy Scalping Strategy To Ma...
Riley Coleman
171,917 views

48:15
Reading Candlestick Charts Was HARD Until ...
Ross Cameron - Warrior Trading
488,396 views
45:00
The Only Day Trading Strategy You Will Eve...
The Trading Channel
5,065,658 views
16:17
Warren Buffett Leaves The Audience SPEECHL...
FREENVESTING
17,241,361 views
![BEST MACD Trading Strategy [86% Win Rate]](https://img.youtube.com/vi/rf_EQvubKlk/mqdefault.jpg)
7:06
BEST MACD Trading Strategy [86% Win Rate]
TradingLab
2,530,470 views

11:14
STOP Using the Heiken Ashi! This Indicator...
Data Trader
725,070 views
13:18
Support and Resistance Didn't work Till I ...
Riley Coleman
610,849 views

27:05
MACD Indicator Explained: 4 Advanced Strat...
Trade Prime
1,429,217 views