This Oscillator Tells You Exactly Where To BUY & SELL
41.67k views1549 WordsCopy TextShare

PineTrades
In this video, we break down the 2-Pole Oscillator—a powerful momentum and trend strength indicator ...
Video Transcript:
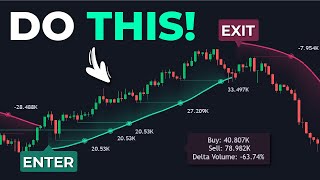
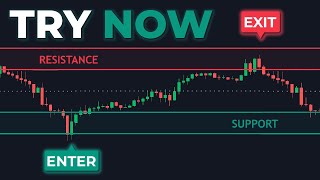
this is a Buy Signal as indicated by this indicator if we were to take a long position here well you can see that that trade would have been profitable how about this this was a sell signal if we were to take a short [Music] position the trade would have been profitable now even without any extra confirmation indicators well this tool is pretty decent in this video we're going to go over what this indicator is and how we can combine it with other indicators to craft a strategy out of it if you happen to find Value in this video remember to leave a like let's get into it now to add this indicator to your chart you want to go to trading View and then open any trading security that you like in any time frame for me I'm going to be using the one hour time frame of GBP JPY and then you want to click on indicators and type in two two pole oscillator and it's going to be this one by big Beluga now the two Poole oscillator is a refined momentum and Trend strength indicator that enhances traditional oscillators by smoothing out price deviations using a two Poole filter in simple terms it's designed to offer cleaner signals reduced noise and actionable insights that can actually be helpful in your trading this indicator is made up of the following components first of all you want to double click on it it and then on this tile tub you want to activate the last plot option as you can see that activates A Thin Blue Line known as the signal line next to the signal line we have the oscillator which changes color between purple and blue looking at the indicator closely you can see that the signal line and the oscillator crisscross each other every now and then every time the oscillator crosses above the signal line a Buy Signal is printed that same Buy Signal is reflected on the chart as a blue upward Arrow when the oscillator crosses under the signal line a cell signal is printed and on the chart you can see it's a downward Arrow so not only does it print the buy and sell signals on the oscillator window but it also prints them on the chart window now next to every signal there is a dotted line known as an invalidation level a bullish invalidation level appears near buy signals while a bearish invalidation level is going to appear near a cell signal these invalidation levels are important because they can be used as stop-loss placement levels now whenever an invalidation level is touched by the price an X label appears to show that the price went against the signal and effectively invalidated it if you had taken any positions that would also mean that any stop losses set just beyond the invalidation levels might have been triggered so here's how the indicator works the oscill later calculates price deviations from a mean value and then applies a two Poole filtering to smooth out the signal two Poole filtering is a way to reduce noise while at the same time preserving important Trends effectively applying two layers of smoothing to produce a cleaner signal once the signals are generated they are colored to show whether they're bullish or bearish bullish signals appear in blue indicating bullish momentum and purple signals appear when momentum is bearish if we go back to the settings of the indicator and then head straight to the style tub we can disable the last plot option and then on the input step we have the filter length which controls how much smoothing is applied to the oscillator a higher filter results in smoother signals reducing short-term noise but it may introduce more lag conversely a lower filter length makes the oscillator more responsive to price movements but it may also produce more false signals due to increased sensitivity adjusting this setting allows traders to customize the balance between smoothness and responsiveness depending on their trading style and market conditions and then down here we can toggle the levels on or off which will hide or show these invalidation levels for the strategy I'm going to be showcasing I need the invalidation levels for stop- loss placement so I'm going to leave them enabled now if you have any other changes that you want to make you can feel free to do so for me I'm going to use the default settings so click okay next let's explore how we can use this indicator to trade by identifying overbought and oversold conditions looking at the indicator scale we have a midpoint located at the zero point on the indicator scale additional levels at the plus 0. 5 and the minus 0. 5 levels and then we have extreme levels at the positive 1 and the minus one levels on the indicator scale a market is considered overbought if the illat goes above the 0.
5 level it can also be considered extremely overbought if the market goes above the plus one level which offers higher probability of a pullback likewise the market is oversold when the oscillator goes below the minus 0. 5 level and it's considered extremely oversold if it goes below the minus1 level for the strategy I'm going to be showcasing here we need to add the volumatic variable index Dynamic average also known as the video indicator once you've added it you want to double click on it and then change the video length to 34 go to the sty tuop and then disable the lines option and then click okay this indicator is used to identify bullish and bearish Trends in the market a bullish trend is identified by a green Trend ribbon like this conversely a bearish trend is identified by a red Trend ribbon like this it also measures the trend strength using the Delta volume where where a trend is considered strong enough if the Delta volume is at least 20% for example to take a long trade you basically want to have a Buy Signal printed within a strong bullish Trend here you can see we have this dot which represents a Buy Signal this Buy Signal is only valid if it's printed under the 0. 5 level this Gray Line if it's printed anywhere above that line the entry would become invalid condition number two at the time the signal is printed we need the video indicator to be colored green to indicate that the trend is bullish we also need to check the Delta volume which should be at least 20% to confirm a strong Trend right now we can see it's well above the 20% limit which means this trend is strong enough to push the price higher and higher also keep in mind that the long signal from the two pole oscillator is going to be delayed by two candles as you can see the signal appears on this candle but it doesn't show up until after these two candles had passed so we're not going to enter the trade on the candle where the signal appears instead we will be entering after the close of the second candle we take a long position the stop loss is going to go right under the invalidation level which is actually this dotted line right here the take profit is going to be set at 1.
5 times the risk letting the trade run and as you can see it was profitable now here was another long position as you can see we had a Buy Signal and it was valid because it was printed under the 0. 5 level the dotted grade line looking at the vi indicator it was green indicating a bullish Trend at the same time the Delta volume was above 20% confirming that the trend was strong enough to push the price higher and higher we take a long position place our stop- loss Bel below the invalidation level and you want to aim for a take profit of 1. 5 times the risk letting the trade run and it was profitable now for a short position it's going to be the opposite condition number one is to have a cell signal printed by the two pole oscillator here the cell signal was valid because it was printed above the 0.
5 level the gray horizontal line looking at the vi indicator it was actually red conf affirming that the trend was bearish the Delta volume was minus 29. 2 2% which is well below Theus 20 threshold indicating a strong enough bearish Trend we take a short position place our stop loss above the invalidation level set the take profit at 1.
Related Videos

21:01
Truly Stunning Io Images and Groundbreakin...
Astrum
2,722,774 views

18:58
#1 Best Way to Lower Blood Pressure Natura...
Dr. Ford Brewer
286,544 views
18:24
Garage Sale Bargains in Vintage Electronic...
Uncle Doug
260,133 views

31:29
Sweden's NEW 6th Generation Fighter Jet CR...
Tactic Wings
400,742 views

15:11
BREAKING: Elon Musk hit with lawsuit we’ve...
Brian Tyler Cohen
1,660,301 views

16:40
Stop Losing Money with WRONG TradingView S...
Michael Automates
67,144 views

21:32
I BOUGHT an ABANDONED HOUSE & RENOVATED IT...
Havesomevision
3,828,383 views

19:53
Wood Stove Water Heater Experiment - Surpr...
Greenhill Forge
516,791 views

18:39
Billionaire Mathematician - Numberphile
Numberphile
3,711,853 views
12:42
1 Indicator, 3 Uses! Most Powerful Trading...
PineTrades
512,753 views

14:14
How Companies Are Dodging Trump Tariffs On...
CNBC
3,867,998 views

11:59
the ONLY way to run Deepseek...
NetworkChuck
649,656 views
25:16
But how does bitcoin actually work?
3Blue1Brown
16,608,174 views

5:22
Trade PERFECT Fibonacci Setups Every Time ...
LuxAlgo
13,834 views

19:26
My Scalping Strategy is Boring, But Makes ...
Scarface Trades
7,691 views

21:58
How I Nailed Trading with the MACD Indicat...
Ross Cameron - Warrior Trading
614,055 views

7:30
The Most Accurate All-In-One Trading Toolk...
PineTrades
76,424 views

1:00:43
Jim Simons (full length interview) - Numbe...
Numberphile2
1,062,509 views
20:00
🔴 STRENGTH INDEX Trading (Say BYE-BYE to ...
Trader DNA
155,071 views
11:17
Premium Indicator, Now FREE! 99% Accurate ...
PineTrades
259,914 views