Technical Analysis - Barry Dumas
89.52k views1735 WordsCopy TextShare
FinPort
Technical Analysis Presentation delivered by Barry Dumas from GT247 at the FinPort - Financial Platf...
Video Transcript:
Thank You mr. Marconi for that wonderful overview on fundamentals basically by show of hands who uses technicals in the trade that it like three people fantastic alright so maybe guys will learn something today so in my search to find the definition on what is a technical analyst or technical analysis I came across this definition on the way basically what technical analysis means for me is just a visual representation of the fundamentals playing out in the market so like basically like Moussa state in these last two slides pretty much sums up everything that I'm gonna go
through with you guys today both are very good tools in trading and they should be used as a collaborative yeah but this grew up to the technicals first so I usually try and keep it basic as I stick to the basics don't over complicate things and surely you'll survive the volatile market currently so the basic technical tools that I look at or trend lines price patterns and indicators now trend lines are one of the most important tools that I use it's a simple tool it will obviously give you an indication if stock or an index
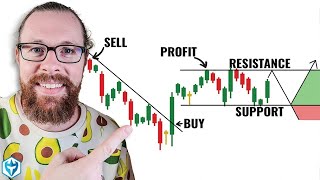
is an uptrend or in a downtrend or in a trading range so one of the basic and important things that you guys should remember is when stock or an index is in an uptrend you should always buy the dips always keep that in mind when stock or an index is in a downtrend you wanna sell the rallies or short the marketing right so don't try and pick the bottom and drag it all the way to the top because you're probably gonna get burned all right another one that I also like to use is the trading
range so a trading range is usually after the market has been in an uptrend it will go through a consolidation phase which is the training range and when that happens it will give an indication of something might happen so either fundamentals are gonna start playing out and you can go either long or short because there will be a breakout from this range in some point of time okay and obviously for new guys when you start drawing lines and getting creative and going absolutely nuts and this is what our charts usually look like so this basically
resembles something like a Jackson Pollock biting instead of a market of some sort so all I'm trying to say is guys keep it as simple as possible so what I did here was obviously a simple indication on a trend line on the Nasdaq and you guys can see the dotted red line was the original trend line and every time I came back to taste that original line and at some stage you started to consolidate obviously forming a price pattern which is a double top and after that we saw the breakdown weather alright so keep it
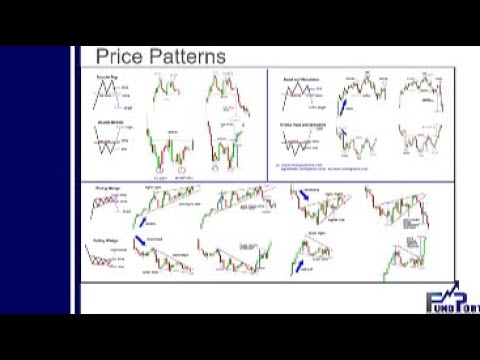
simple one or two lines give me an indication what the price action was gonna be okay these are very good indications like a new state on price patterns and the infamous head and shoulders these patterns are basically in any market from stocks to indices commodities and these are just representations of fundamentals within that market and at some stage it will start playing out and will give us as traders an opportunity to get into the market and to get out of the market all right and obviously technical indicators because they are like a string of these
things hundreds hundreds of them and usually like new guys as well is we want to have the edge we want to add as many indicators on our charts add as many technical lines on our charts and yeah and that's just probably gonna just confuse you like this and this is basically that I've got from the internet this is actually someone's layout right so they're probably just gonna confuse themselves and try and stay away from this all right okay so basically I'm going to take you through a couple of things that I use and that brought
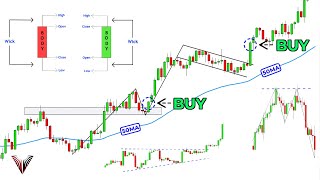
me some success last year with in equities and its basic things I use trend lines and MACD as my indicator and MACD is a very simplified but very useful tool that you guys can use in trading so I'm at D will be the literally will give you entry points when to buy the stock when those two moving averages cross and then to get out of the market simple right not over complicated very easy to use and you can build on this system within your own trading plan or whatever but this is a very good simplified
way off of getting in and out of the market also what the MACD is very useful for is to give you divergence within the market so you can see obviously stock is in a downtrend getting divergence in the MACD and that's obviously the crossover to break out any wannabe long this market very simple right not a complicated okay excellent so basically I'm gonna go through an age trading edge what is a trading edge and we obviously hear this term being thrown around quite a lot I still don't know what it is I think if you
have an age it just gives you but other differential between you and the next guy at the end of the day but that age will be the timid on your style your system will be different to everyone else's all right so in a trading age for me is definitely to combine fundamental analysis with technicals I mean at this point in time with the market things of all the towel and you would actually be doing yourself an injustice just to use technicals at the end of the day or just to use fundamentals at the end of
the day I mean we have all of these tools to our disposal use it and that will ultimately give you an edge over the next person who's just prior technical just pro so some of the strategies that I think you guys should maybe just investigate have a look at is obviously things called piece trading analysis safe item flags are very much topical at the moment or I'll take you through some of that now so basically what P trading is is you want to know what the technical outlook and the fundamental outlook is within a sector
so you can pick two stocks and within that technique in this article listen according to my from the name fundamental analysis and the technical will support argument going long vertical or short in TN on this side or vice versa more advanced way of looking at it but I'm pretty sure the guys at front port and ourselves will take you through it in the break you see if you have any questions on this all right okay so they say fight implies basically which we top the college environment so this is obviously a chart of gold so
we can see gold was in the downward trend started to consolidate and obviously this consolidation will give an indication in the market that obviously something is about to happen so this event that took place obviously the side of that we saw in the globe markets so when a setup happens in global markets clients will run to safe havens so traditional safe havens were commodities but now it's been ever split between commodities like gold cash the guys are buying dollars so that that has changed but it gives you as a trader a very good indication of
what can happen and what to look out for going forward all right baño was stuff that I was very bearish on throughout last year and this was also the new very much to do with fundamentals so the company was in corporate actions we had issues with production through issues with dates and mines so the picture wasn't very great all right and that we can obviously see with him is down the creek but eventually the stock started to consolidate forming an inverse head and shoulders pattern so this is obviously a trend reversal that's about to happen
so now he has a technical analyst you're aware of something's going to happen right where they plays out or not you don't know because we can't see into the future which is a pity but at the end of the day if we do the safe haven play like with the gold aspect we know something is about that from the machine as glides run to safety you want to start looking at gold stocks commodities because obviously the Salif will happen within the broader market and you won that obviously capitalized on it in some other space so
what happened with the pioneers excited to consolidate with this inverse head and shoulders started to consolidate they just above that tintin support line or resistance area and then when the self started to happen like that we can move the Chickasaw in gold that one was when everyone started to run to safety and this was basically a trade net that we put out on Sabina before that all consolidation and and drag out so this is as a technical analyst you when they look at something like this and we be prepared for the event that something happens
like with gold say firemen play so this was just obviously I've started to create that it might go down a little bit and then break out higher but like Murphy's Law would have it it triggered my trade and it gave me sleepless nights for a couple of days and then eventually kinda do y'all right now and play play it out fantastically he also these are like basics cuz I didn't use a lot of indicators it went a lot of large drawing basic stuff alright so we don't have to use a lot of add-ons do you
have a successful trader to getting up today this is obviously a bigger picture of that breakout and you know this is the gold play and that's that's all I have on technical analysis [Music]
Related Videos
48:12
Chart it up! | A professional’s approach t...
Robinhood
128,260 views

1:12:04
How to Achieve God Like Trader Status!
InstituteofTrading
408,579 views
![[LIVE] Day Trading | Not Smooth, but 3 trades!](https://img.youtube.com/vi/Xu4V5SjJusk/mqdefault.jpg)
12:14
[LIVE] Day Trading | Not Smooth, but 3 tra...
ClayTrader
116 views

48:15
Reading Candlestick Charts Was HARD Until ...
Ross Cameron - Warrior Trading
1,263,658 views

40:10
Trading Psychology - Dr David Paul
FinPort
4,110,482 views

12:39
ex Goldman Sachs Trader Tells Truth about ...
InstituteofTrading
5,378,937 views

47:27
Trading Psychology: How to Handle FOMO (Dr...
SMB Capital
530,163 views

23:37
The Mindset of a Trader | Hicham Benjellou...
TEDx Talks
914,300 views

55:11
Master This ONE Candlestick Pattern TODAY ...
Ross Cameron - Warrior Trading
1,305,982 views

50:41
The Psychology of Hedge Fund Traders (Insi...
SMB Capital
508,389 views
6:24
AG Bondi alarmed by state of DOJ: 'Worse t...
Fox News
1,379,089 views
18:39
Trading Psychology | Why Normal Doesn’t Ma...
OPTO
2,929,713 views

3:10
3 Primary Rules for Swing Trading
MoneyShow
398,006 views

23:42
Trading Psychology Event | Learn to Think ...
OPTO
984,151 views
55:18
How to Read Candlestick Charts (with ZERO ...
Ross Cameron - Warrior Trading
3,125,992 views

36:41
TRADING LEGENDS - Anton Kreil's Interview ...
InstituteofTrading
591,281 views
1:17:35
The Only Technical Analysis Video You Will...
The Trading Channel (The Trading Channel)
24,378,804 views

16:55
🔴 The MOTHER of All Indicators (Dangerous...
Trader DNA
314,646 views

21:25
How to Invest for Beginners in 2025
Mark Tilbury
2,105,014 views
16:47
How to Calculate the Intrinsic Value of a ...
New Money
1,287,366 views