NASA ARSET: Basics of Synthetic Aperture Radar (SAR), Session 1/4
162.59k views7780 WordsCopy TextShare
NASA Video
Session Objectives:
- interpret the information in SAR images
- recognize distortions that need to ...
Video Transcript:
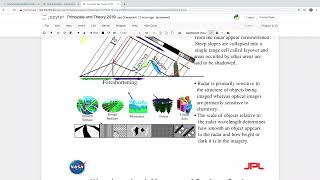
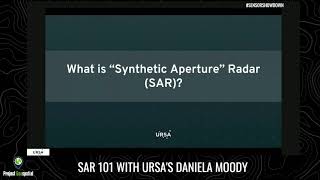
Okay. Good afternoon or good morning for some of you my name is Erika Podest and I'm a scientist in the earth science division at NASA's Jet Propulsion Laboratory as well as an instructor for the NASA our set program and this is the first of a four-part webinar series focused on synthetic aperture radar or SAR and today I will start by covering the basics of SAR so by the end of this presentation you'll be able to understand the physics of sorry much information just the basic concepts describe the interactions of SAR with the land surface describe the necessary data of pre-processing and understand the information content and saw images so let's start with the electromagnetic spectrum which is the range of electromagnetic energy that spans from very long wavelengths such as radio waves which can be the length of a football field to very short wavelengths such as gamma rays which are the length of an atomic nucleus so note that most of the energy on the spectrum is not visible to our eyes and visible light is just a sliver of energy from the total amount that surrounds us so I want you to think of this energy as waves propagating not much different that waves crossing an ocean except that electromagnetic radiation travels at the speed of light so remote sensors are designed to operate at specific regions of the electromagnetic spectrum according to their intended application microwave sensors operate within the range delineated in this figure which is at a much lower frequency range than optical and infrared sensors so to put things into context the wavelength of light is about 300 to 700 nanometers while from microwaves it is on the order of 0. 32 40 centimeters and because of this huge disparity in wavelengths the features on the Earth's surface appeared differently in the microwave range than in the optical range so there are advantages to observing the surface of the earth within the microwave range and it is primarily that microwaves are not hindered by day or night or most weather conditions as optical sensors are so there are two main types of remote sensing observations passive and active passive measures energy emitted or reflected by the Earth's atmosphere system so examples of passive sensors are off the optical and thermal they're also passive microwave sensors and there are called radiometers they measure energy emitted from a medium in the microwave range an active sensor provides its own illumination source and examples of active sensors are lidar is and radars where a radar is analogous to an ultrasound and instruments emits a burst of energy and let's call that burst a signal and that same instrument measures the portion of the signal that is reflected back active remote sensing in the microwave range is called radar remote sensing in this webinar series we will be focusing only on radar remote sensing specifically synthetic aperture radar so this slide lists in detail the advantages and disadvantages of radar remote sensing over optical remote-sensing the advantages of using radar as mentioned in the previous slide is that you can observe the surface of the earth on either day or night conditions and under almost all type of weather conditions optical images are hindered by clouds or night conditions also the radar signal can penetrate through the medium meaning vegetation canopy snowpack or soil and the extent of this penetration I will explain further along optical only sees the very top of the medium in addition with radar remote sensing there are minimal to no atmospheric effects or Corrections needed as opposed to optical where atmospheric Corrections are critical for proper image interpretation finally radar is very sensitive to the dielectric or electrical properties of the surface and to structure so that's really important radar is sensitive to two things the dielectric and structure of course there are also disadvantages with radar and that is that the information contents and radar data is different than optical and sometimes difficult to interpret also for radar images the presence of speckle which is a salt-and-pepper like a grainy type effect makes it difficult to interpret the image finally the presence of topography introduces distortions which need to be accounted for and all of this will be discussed further along so this slide shows the advantage of having a sensor like radar that has the ability to observe the surface of the earth regardless of cloud cover the figure shows total fractional annual cloud cover averaged from 1983 through to 1990 and the colors indicate the percentage of time that there is cloud coverage as you can see some areas of the world are constantly covered by clouds such as tropical regions and it is areas like these that the radar is an ideal sensor here you can see an example of an optical versus a radar image this is the chef's core volcano in Kamchatka Russia which began to erupt on September 30th 1984 so the image on the left is a photograph taken by astronauts onboard the space shuttle during the early hours of the eruption and clearly showing a thick ash plume the image on the right is a later image required during the eruption by Sir C XR which was one of the early synthetic aperture radar as well in space and it was flown on the Space Shuttle Endeavor so the red is l-band HH green is L BAM HV and see that blue is C band HV so it's a false color composite but on the radar image you can clearly see the surface of the earth despite the ash plume that was being emitted at the time so now let's talk some of the basic concepts of radar a radar is essentially arranging or distance measuring device and there are two categories of radars imaging and non imaging so non imaging is for example an altimeter this webinar series is focused on imaging radars and these radars are side-looking because if the radar would be looking straight down such as the figure on the Left he would not be able to differentiate between two points a and B the figure shows that the signal will reach point A and point B at the same time and return to the sensor at the same time which is why you wouldn't be able to differentiate them however if the radar is sight looking such as the figure on the right the time that it takes for the signal to reach point a and B is different and therefore these two points can be resolved so a radar consists fundamentally of a transmitter a receiver and antenna and an electronic system to process and record the data the transmitter generates successive short bursts or pulses of microwave at regular intervals which are focused by the antenna into a beam and the radar beam illuminates the surface obliquely at a right angle to the motion of the platform the antenna receives a portion of the transmitted energy reflected or it's also known as backscattered from various objects within the illuminated beam by measuring this time delay between the transmission of a pulse and the reception of the backscattered echo from different targets their distance from the radar and therefore their location can be determined as the sensor platform moves forward recording and processing of the backscattered signals builds up a 2-dimensional image of the surface so I'm not going to get into the details of the physics of image formation but in summary the resolution of the radar in the alarm track and which is the azimuth direction that is the direction that the sensor is moving and the across track also known as the range is defined by independent parameters the range or the across track resolution is dependent on the length of the polls the azimuth or the along track resolution is determined by the beam width which is inversely proportional to the antenna length also known as the aperture which means that a longer antenna or a longer aperture will produce a narrow beam and a finer resolution since it is difficult to have long antennas in space one can be synthesized by using the movement of the satellite or aircraft to simulate a very long antenna hence it is called synthetic aperture radar which allows for high resolution images with comparatively small physical antennas and through the use of signal processing of the Doppler shift associated with the motion of the aircraft so radar pulses travel at the speed of light and can only measure the part of the signal that is reflected back to its antenna so most radars measure amplitude and phase not although an amplitude is the strength of the reflected signal ok so this amplitude is the backscatter coefficient also known as Sigma naught which is the ratio of the or the fraction of the incident energy scattered back to the antenna per unit target area and Sigma naught is expressed in decibels by taking the log 10 of the energy ratio this usually varies from minus 25 dB which is an area where there's low back scattered dark tones because little energy is reflected back to the later to some times greater than 1/2 B that's those areas that have really high backscatter or blight tones because a great amount of energy is requested back to the raid house so a very important thing to remember about saw is that the images contain information about two things as mentioned earlier structure and the dielectric properties of the land surface there are later parameters and surface parameters that influence the characteristics of this signal and the next couple of charts will talk about three radar instrument parameters that influence the transmission characteristics of the signal these are wavelength polarization and incidence angle so wavelength is the length of the peak of one wave to the peak of the next wave and in radar remote sensing we often talk about wavelength rather than frequency this is because the length of the wave defines the interaction of the signal with the surface or the meeting wavelength is inversely related to frequency it is the speed of light divided by frequency the higher the frequency the shorter the wavelength and vice versa the table on the right lists the common wavelength bands in radar the letter codes as you can see on the far left and the table ka for example L or P bands were originally selected averaged arbitrarily to ensure military security during the early stages of radar development which is why these letters denominations are not in alphabetical order and as you can see each band has a wavelength and frequency range so for example when someone talks about a specific l-band radar and I will give the example of one called SMAP the soil moisture active passive satellite snap has a radar that operates at a specific frequency which within the l-band range and in this case it's 1.
26 gigahertz so something to note here is the variation in wavelength in ka-band for example which is on the order of 0. 8 - 1 centimeters and in peeve and which is on the order of 30 to 100 centimeters so it's quite a large range in wavelengths and the tone on the sorry images are determined in part by whether there is signal interaction with the surface which is determined by the wave look so there are two important things to remember about wavelength the first is that the longer the wavelength the greater the penetration through the meeting and the second is that the length of the wave will determine the interaction with surface objects if an object or surface roughness is the approximate size of a wave then there will be interaction but the surface will appear rough and there will be energy scattered back if the wavelength is much smaller than an object then there will be no or minimal interaction between the wavelength and the object and the surface will appear smooth there will be minimal to no energy scattered back so for example little radiation is back scattered from a surface with a high fluctuation on the order of 5 centimeters if l-band SAR is used and the surface will appear dark however the same surface will appear bright due to increased back scattering if expanse R is used which expands on the order 2. 4 to 3 point 8 centimeter wavelength while l-band is on the order of 15 to 30 centimeter wave 1 so this table shows examples of applications most relevant to specific bands if you're interested in forest type studies what you want be penetration through the canopy and information about forest structure then you would go with something like L or P that if you're looking at agricultural type studies where the biomass is not as large as that of a forest and you want penetration through the vegetation layer and information about crop structures such as leaves or stuns then you would go with C or X bats for studies of ocean surface roughness you will go with something like X okay you bad okay so this graph shows the extensive penetration through different mediums with different bands in vegetated areas x-band will penetrate through the will partly penetrate through the canopy very little in fact while c-band can penetrate further about halfway through the canopy and Elbon can in most cases penetrate all the way and reach the soil if you have a dry bare soil expand only sees the very top surface with minimal penetration while L Bank can penetrate much deeper into the soil in fact there have been studies showing that in dry soils L Bank can penetrate up to a meter or sometimes even more in the case of dry snow expand fees only at the top layer it does have some level of penetration while for L band a dry snowpack will be just a transparent layer okay so this is an example showing a comparison of optical and spaceborne images acquired in April 1994 for a region in southwest Libya where the soils are very dry the image on the far left is a Landsat image which is optical and the images in the middle and right are from one of the early spaceborne SARs called SIR-C and X-SAR.
Which, I showed you earlier examples of such and they were flown onboard the Space Shuttle Endeavor and this was a demonstration mission to acquire sorry images and demonstrate their capabilities over given areas around the world one of these early demonstration studies one is was in evaluating radar images for your morphological studies and this is an example of such so Circe XR could operate in different bands and here we have an example of an acquisition sea band which is the image in the middle and an acquisition in El band which is the image on the right and in this area there ancient drainage patterns cut in the bedrock that are not visible in the optical images because of sound cul de but most of the time they appear as dark lines in the radar images so the red arrows point to these floovio systems and since El band has greater penetration in these dry soils sometimes on the order of as I mentioned one to even two meters more of these drainage patterns or floovio systems are discernible in el band then and see them and from these early studies the term grade our rivers was coined for buried floovio systems or paleo channels so this is another example of Raider penetration into soils this area is part of the Nile River near the fourth cataract in Sudan each image is about 50 to 19 kilometers and the top image is a photograph taken with color infrared film from the space shuttle Columbia in November 1995 and the radar image at the bottom was acquired again with cersei XR in April 1994 it's a false color image using a combination of L and C band at different polarizations the thick black band in the top right of the radar image is an ancient channel of the Nile that is now buried under layers of sand and this channel cannot be seen in the photograph and its existence was not known before this radar image was processed so the area to the left in both images shows how the Nile is forced to flow through a set of fractures that crosses the river to break up into smaller channels suggesting that the Nile has only recently established this course so this radar image have has provided or allowed scientists to develop new theories to explain the origin of this Great Bend of the Nile and Sudan where the river takes a broad turn to the southwest before resuming its northward Horse to the Mediterranean Sea so this example is of penetration depth through vegetation and the image on the top is the C band image again C band has a wavelength of about 570 and the image on the bottom is a P band radar image and P band has a wavelength of about 40 centimeters so note the difference the greater details in the p-value image the purple area color area in the C band image is likely an area of low vegetation however the P Venom it shows a lot more complexity in this area also south of the low vegetated area is a forested area with lower biomass than the area immediately west of it and also note there are purplish areas north of the river in the p-value which which are areas having different forest structure or biomass so you can see a lot more detail about the forest which the P band rather than see them this example shows radar signal penetration through vegetation to detect in the native areas and this is an El band a snap radar mosaic of the Amazon basin acquired in April of 2015 in the middle of the image you can see the Amazon River and the further west you go you can see vast bright areas and these bright areas is inundated vegetation and Elbe and is ideal to detect in native vegetation in the tropics because a signal can penetrate through the most high biomass vegetation and when I mentioned when I say inundated vegetation that means there's vegetation and there's standing water underneath the vegetation so another layed out parameter we talked about wavelength the other one is polarization which refers to the plane of propagation of the electric field of the signal irrespective of wavelength radar signals can be transmitted or received in different loads of polarization so most radars are designed to transmit microwave radiation Eirik either horizontally polarized or vertically polarized and this figure illustrates these planes of propagation if you had a long string tied to an object and if you stand at the very end of the string and move it up and down in a vertical manner such as the figure in the very top then the signal is vertically polarized if you move the string horizontally from side to side then the signal is horizontally polarized and similarly the antenna can be seen either the horizontally or vertically polarized back scatter energy by applying specific filters and some antennas can receive both so there are there can be full combinations of both transmit and receive polarizations which are as follows h h4 horizontally transmitted and horizontally receipt vv4 vertically transmitted and vertically received hv4 horizontally transmitted and vertically deceased and then vh4 vertically transmitted and horizontally received the first two polarization combinations are referred to as like polarized because the transmit and receive polarizations are the same so HH and VD are like polarized the last two combinations are referred to as cross polarized because the transmit and receive polarizations are opposite of one another systems that collect data and all four combinations are called quad pol and they can more fully characterize structure on the surface so in summary polarization provides information on the horizontal and vertical components of the target as part of this webinar series there will be one webinar focused on polarimetric SAR and that will be the third lecture on june 5th by dr.
Related Videos
42:00
NASA ARSET: SAR Processing and Data Analys...
NASA Video
44,867 views
2:18:52
NASA ARSET: An Introduction to Synthetic A...
NASA Video
1,978 views
46:03
Origin vs. Seestar vs. 10" Newton - EINE N...
Daniel Nimmervoll
3,989 views
16:26
Satellites Use 'This Weird Trick' To See M...
Scott Manley
1,101,659 views
1:10:34
SAR Theory
UNAVCO, Inc.
20,212 views
55:12
SAR 101 with URSA's Daniela Moody
Project Geospatial
2,146 views
16:51
Basics of Synthetic Apeture Radar (SAR) Pa...
GeoTown
27,904 views

57:35
The Origin of the Elements
Jefferson Lab
2,729,085 views
23:15
How Radar Satellites See through Clouds (S...
Max Lenormand
12,591 views

1:54:15
Understanding Radar Satellite Images: Iain...
Minds Behind Maps
7,151 views
1:42:25
NASA ARSET: Introduction to Change Detecti...
NASA Video
20,569 views
1:29:37
Part 1/4: Introduction to Radar Interferom...
EO Open Science
12,343 views

27:00
The Value Of SAR | Join The SAR Journey | ...
ICEYE
18,671 views
2:31:10
NASA ARSET: Time Series Analysis of Forest...
NASA Video
11,706 views
58:22
Synthetic Aperture Radars (SAR) Technology...
IEEE Microwave Theory and Technology Society
10,501 views

44:43
NASA ARSET: Introduction to Polarimetric S...
NASA Video
23,009 views

1:07:25
NASA ARSET: Introduction to SAR Interferom...
NASA Video
23,437 views

58:05
A Hitchhiker’s Guide to Hyperspectral Data...
NV5 Geospatial Software
7,819 views
2:07:57
NASA ARSET: SAR for Flood Mapping Using G...
NASA Video
24,670 views

43:22
Lecture 1: Introduction to Power Electronics
MIT OpenCourseWare
933,899 views