This Zero-Lag BUY SELL Indicator Makes All The Others OBSOLETE
220.55k views1781 WordsCopy TextShare
PineTrades
📉 Discover how the Zero Lag Trend Signals Indicator by AlgoAlpha is revolutionizing trend analysis ...
Video Transcript:
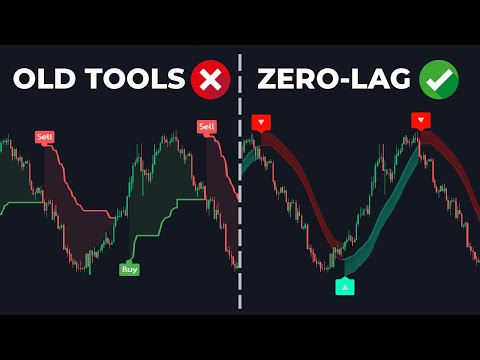
so this is the zero lag Trend signals indicator by algo Alpha looking at it you can see it's doing a pretty good job of living up to its name that is it's producing zero lag Trend signals in the market as you can see we have a series of bearish Trends followed by a series of bullish Trends now during transitions between bullish and bearish Trends the indicator instantly prints buy and sell signals helping you to spot exactly where the market is reversing Direction in this video we're going to go over what this indicator is and I'm
also going to give you a simple yet powerful strategy that you can use with this indicator stick around because this is one video you wouldn't want to miss let's get into it now to get started with this indicator you want to go to trading View and then open any trading security that you like in any time frame for me I'm going to be using the 15minute time frame of your USD next click on indicators and type in zero L Trend signals and you want to s this one created by algo Alpha so what exactly is
this indicator well the zero L Trend signals is a tool designed to enhance Trend following strategies it does this by minimizing lag and providing rapid Trend insights across multiple time frames it utilizes a zero lag exponential moving average also known as ZL EMA to smooth out the price data while at the same time minimizing delay offering a more responsive method of of trend analysis now looking at this indicator you can see it's super straightforward it's made up of the following components per usual we have the trend ribbon which changes color between red for bearish Trends
and green for bullish Trends this trend ribbon is based on the average true range or the ATR indicator which helps reduce false signals we also have red and green arrows to indicate transitions between bullish and bearish Trends a red arrow is going to be printed whenever the market shifts from bullish to bearish conversely a green arrow is going to be printed whenever the market shifts from bearish to bullish but now I know you may be thinking but what about these tiny arrows along the trend ribbon well these are called mini arrows and they're going to
be printed during retracements in the market for example if the trend is bullish and then the price retraces all the way back into the trend ribbon as soon as a candle closes back above the ribbon a green upward mini arrow is going to be printed this acts as a signal for a potential long entry conversely for a bearish trend a red downward arrow is going to be printed during these pullbacks which is a signal for you to take a short position this indicator also displays Trends not just on the time frame of your chart but
also across these five extra time frames as well currently I'm using the 15-minute time frame which is also included on the table but we also have the 5 minute we have the 60-minute time frame which is just the 1 hour time frame the 240 minute which is 4 hours and the daily time frame now if you want to change any of these time frames to something you prefer you just double click on the table and then here you get to change the time frames you can also change the length of this indicator you can also
change the band multiplier which is just the ATR factor for these green and red bands if you want to reduce noise you can make the Bands a bit larger by increasing this number but if you want to have more signals maybe for scalping you can reduce this number to make the bands narrower and narrower and then down here you can change the bullish and bearish colors to your preferences this tille tub has several visual options that you can toggle on or off but for the strategy I'm going to be showcasing in this video I'm going
to leave all the settings at the default values after you've made your changes click okay now there are two methods of trading with this indicator number one Trend reversals number two pullbacks for Trend reversals we're going to be using the main buy and sell signals we're going to use the larger labels that are printed between trends for example if we wanted to take a bullish Trend reversal we basically would identify a green outward Arrow like this one and then before you take the trade you want to look at this table it should indicate bullish Trends
across Ross the five time frames so it should basically say bullish for all these time frames if any of these time frames happens to be bearish the entry would become invalid however for us all the entry conditions were met so we're going to take this trade we want to put the stop- loss under the trend ribbon which is usually just above this Buy Signal and then set the take profit at 1.5 times the risk letting the trade run and as you can see it was profitable and of course you want to do the opposite of
this for a short position now the second strategy of trading with this indicator would be to trade pullbacks but how would we do that you may be thinking well you see this mini Arrow this is a pullback signal and that is what we're going to be using first of all you want to confirm that the trend is bullish by having the trend ribbon colored green with a price heading upwards condition number two you want to have a bullish pullback signal printed this is going to happen as soon as the price comes all the way back
touching the trend ribbon and then goes up to close above it once that happens the pullback signal is going to be printed the last condition is to ensure that the trend is bullish not only on the time frame of our chart which is the 15-minute time frame by the way but also across the 1 Hour 4 hour and the daily time frame the 5 minute time frame for this specific strategy can be excused because it's affected by this tiny pullback here so it's impossible to have the 5 minute time frame also be bullish so you
basically want this table to say bearish on the 5 minute time frame but bullish on all the rest of the time frames if you can find a trade that is bullish on the 5 minute time frame as well well that would be also okay although it's highly unlikely you'll find it once all the conditions are met we take a long trade you want to put the stop loss just under the most recent swing low Target a risk reward ratio of 1 to 1.5 let the trade run [Music] and the trade was profitable of course you
would do the opposite of this for a short position now those are just two methods of trading with this indicator but there is another way in order to bring this third strategy to life we have to add an indicator called momentum bias Index this one by algo Alpha once you've added it we're not going to change anything so let's go over the conditions for a long trade condition number one we want a bullish reversal signal to be printed by the zero lag signals indicator once we have it you want to look down here at the
momentum bias index two conditions need to be met number one we need to have a bright green histogram bar corresponding to the Buy Signal and remember it should be bright green like this if it's dark green like this one the entry would become invalid number two we want this green histogram to close Above This dotted threshold that would indicate that the bullish momentum of the market is super strong which increases the probability of this trade becoming profitable we enter a long trade stop loss should be leveled exactly at the top of the Buy Signal for
the take profit we're not going to set it at the usual 1.5 times the risk no instead we're going to set it at two times the risk for my back testing this strategy is super profitable most of the time it actually goes past the two times the risk if we let this trade r you can see it was profitable here's another long position we had a bullish reversal signal and then on that signal candle if we look at the momentum buyers index we can see that the corresponding histogram bar was bright green and it also
closed above the minimum threshold for bullish bias which indicated that the bullish momentum in the market was super strong increasing the probability of this trade becoming profitable we take a long trade here stop loss at the bottom of the trend ribbon targeting a 1:2 risk reward ratio and as you can see the trade was profitable the opposite of this is true for a short position you basically want to have a bearish reversal signal like this and then corresponding to this signal we want to have a bright red histogram bar on the momentum bias index that
histogram bar should also close above the minimum threshold for bearish momentum to indicate that the momentum is strong enough to push the price down we enter a short position here put the stop loss at the very top of the red Trend ribbon targeting two times the risk for your takeprofit and as you can see the trade was profitable ladies and gentlemen there you have it three super powerful strategies within one indicator the third strategy was definitely my favorite so go ahead and back test it if you're interested in using it alongside your strategy let us
know what results you find out also if you have any conditions that would make the third strategy or any of the three strategies even better let us know in the comment section below your feedback is going to be super helpful in improving these strategies well that's been it for this video I really hope you found some value if you did hit the like button below and consider subscribing to stay tuned thanks for watching see you next time
Related Videos

8:16
This Trend Indicator Also Filters Out Rang...
PineTrades
111,082 views

13:41
Liquidity Sweep Filter: The Most Powerful ...
PineTrades
1,563 views

21:58
How I Nailed Trading with the MACD Indicat...
Ross Cameron - Warrior Trading
658,089 views

21:49
Convert TradingView Indicators into Strate...
Michael Automates
1,023,003 views

7:30
The Most Accurate All-In-One Trading Toolk...
PineTrades
95,744 views

6:40
BEST Trading Indicator For Zero-Lag BUY & ...
PineTrades
92,636 views
12:42
1 Indicator, 3 Uses! Most Powerful Trading...
PineTrades
557,021 views

19:26
My Scalping Strategy is Boring, But Makes ...
Scarface Trades
178,529 views

5:50
The Most Accurate Buy Sell Signals from Mi...
Soheil PKO
95,480 views

9:28
This Oscillator Tells You Exactly Where To...
PineTrades
147,258 views

16:55
🔴 The MOTHER of All Indicators (Dangerous...
Trader DNA
322,816 views
9:57
This Oscillator Shows Up To 99% Trend Reve...
PineTrades
105,539 views

11:14
STOP Using the Heiken Ashi! This Indicator...
Data Trader
901,551 views
12:21
This 1 Indicator Identifies Both Momentum,...
PineTrades
82,018 views
20:00
🔴 STRENGTH INDEX Trading (Say BYE-BYE to ...
Trader DNA
231,824 views
27:37
Ultimate Fibonacci Trading Course (Retrace...
Wysetrade
884,916 views

8:19
Buy Low, Sell High! This Indicator Shows M...
PineTrades
79,237 views

10:32
This Indicator PREDICTS Market Bottoms wit...
Data Trader
139,731 views

9:47
This Oscillator Shows EXACTLY Where The Tr...
PineTrades
98,471 views
11:17
Premium Indicator, Now FREE! 99% Accurate ...
PineTrades
284,271 views