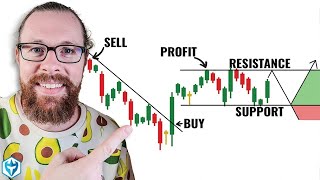
Manipulation Candlestick Patterns Banks Use Against You | #1 Price Action Trading Strategy
167.87k views4177 WordsCopy TextShare

The Secret Mindset
Discover the truth behind candlestick patterns and how to spot manipulation candlesticks that can ca...
Video Transcript:
Let me tell you a secret: the charts look different to professional traders! That’s because they see the “manipulation” candles that you don't! These candles are the key to understanding true market intent!
Stay till the end and I'll show you what you've been missing! When you place a trade, you're full of hope and expectations. Every time you enter, you're very confident the market will move in your favor.
But often, almost as soon as you enter a trade, the price starts moving in the opposite direction. And in most cases, it all starts with a manipulation candle. A manipulation candle is a price action pattern used by market makers, to trick novice traders into taking losing positions.
These candles are designed to create false signals, that often lead to poor trading decisions. Market makers, who have significant capital, can move prices in ways that trigger stop losses and create false breakouts. They do this to collect liquidity from other traders who often enter and place their stop losses in predictable locations.
And it's not just a single candle, but a whole sequence of price moves designed to trick traders. So let’s talk about it, these are the most common manipulation candles. Candles with Big Wicks Candles with big wicks are some of the most deceptive and manipulative tools used in the market.
At the core, big wicks represent areas where the price moved significantly in one direction, but failed to hold. The long wick shows price rejection, meaning it reached a point where the market didn’t want to stay. This happens because large players are moving the price, to trigger certain actions from retail traders.
Big players know where most retail traders place their stop-losses, or where breakout traders are waiting to enter. And by pushing the price to these levels, they can activate these orders, only to reverse the price and trap those traders. The wick is the aftermath of this manipulation.
The manipulation works because most novice traders react to price movements, without considering the intention behind them. The big players push the price up or down aggressively, creating a sense of urgency. Traders see this sudden move and think they’re missing out on a potential breakout or trend continuation.
The wick itself is the result of this push. Breakout traders also enter the market, thinking the move is real. At the same time, traders who had their stop losses set just beyond key levels, get forced out of their trades.
These traders think the market is breaking out of a range, or continuing in a strong direction. And once the big players have triggered enough orders and collected liquidity, they reverse the price. The candle closes far from the extreme point of the wick, showing a large rejection of that price level.
Retail traders who entered the market on the breakout are now trapped in losing positions, while those who got stopped out are left frustrated. This manipulation relies on the fact that traders tend to follow price blindly, without understanding that the price move was intentionally created to trap them. Once you understand how this manipulation works, you can use it to your advantage.
First, don’t jump into trades just because the price moves past a key level. Instead, wait to see how the candle closes. If the candle has a big wick and closes near its opening price (indicating rejection), this is a sign that the previous breakout might be false.
You can then consider entering a trade in the opposite direction. Second, big wicks often occur around major levels. These are areas where big players know that traders have placed their stop losses or breakout orders.
If you see a long wick forming at a key level, it’s a sign that the big players are hunting for liquidity. You can use this as a signal to enter a trade in the opposite direction of the wick. Also, wicks are more common during certain phases of the market.
In consolidation phases, big players are accumulating positions, and they use wicks to mislead traders into thinking the market is breaking out. Once they’ve accumulated enough positions, they’ll move the market in the real direction, often leaving a series of wicks behind as a trail of manipulation. The longer the wick, the stronger the manipulation.
A very long wick shows that big players pushed the price far in one direction, only to reverse it quickly. This is a sign that they’re actively trying to trap traders. Shorter wicks, on the other hand, might just be a sign of indecision or weak momentum.
If you see multiple long wicks forming at the same level, it’s a strong sign. The big players are repeatedly pushing the price to that level to trigger orders, but the price keeps getting rejected. This is a sign that the market is about to move in the opposite direction.
If you see this setup, it’s a good opportunity to enter a trade against the direction of the wicks. Large Candles in Sideways Markets Large candles in sideways markets are another classic manipulation tactic. These candles may even break out of a range, causing traders to believe a strong movement has begun, only for the price to reverse shortly afterward.
When the market is moving sideways, it means there’s a period of accumulation or indecision. Prices are stuck within a range, bouncing between support and resistance levels. And big players use these periods to build their positions.
But they also need liquidity to execute large trades, without moving the market too much. This is where large candles come into play. What happens is that these big players push the price suddenly in one direction, to create FOMO.
Reactive traders see the large candle and enter the market, expecting the price to continue in the direction of the candle. This adds more liquidity for the big players, to take the opposite side of the trade. The large candle is essentially a trap.
It gives the illusion of a strong directional move, but in reality, it’s a manipulation tactic to create liquidity. The candle may even break outside the previous range. This is a classic liquidity grab, where big players need stop-loss orders to fill their own positions.
These candles create emotional reactions in traders. A sudden big move can make traders think they’re missing out on an opportunity, causing them to enter trades without proper confirmation. This is a classic case of “Fear of Missing Out”.
I’ve personally done it dozens of times, rushing into the market, thinking a large candle signals the start of a new trend. To avoid getting trapped, volume is my go-to indicator when I’m facing a large candle. If the candle forms on high volume but the price quickly reverses, it’s a strong sign that the move was actually a trap.
Big players were likely using the volume spike to create liquidity for their own trades. On the other hand, if a large candle forms on low volume, it might be a sign of weak conviction, and the breakout might not be sustainable. Sometimes, you’ll see multiple large candles forming in quick succession.
This is another manipulation tactic. Big players will push the price in one direction, then reverse it, then push it again, creating a series of large candles. This confuses traders, making them unsure of whether the move is real or false.
If you see multiple large candles forming in a sideways market, it’s a sign that manipulation is at play, and you should be cautious about entering a trade. Inside Bars Followed by Weak Breakouts Inside bars followed by weak breakouts are one of the classic setups that can often lead to losing trades. An inside bar is a candle that forms completely within the range of the previous candle.
Think of it as a sign of indecision or consolidation in the market. The price isn’t moving much, and traders are waiting for something to happen. Because the price is “stuck” within the range of the previous candle, traders know a breakout could be coming, and they start preparing to enter trades, based on whether the breakout is bullish or bearish.
And when a series of inside bars form, it amplifies the anticipation even more. Traders are waiting for the market to break out of this chop. They know that once the price breaks out of the range, it could lead to a strong move.
This is where the manipulation starts to take root. Well, during this time, big players are building their positions. They don’t want to reveal their hand, so they keep the market within a tight range.
Novice traders, on the other hand, are getting ready for a breakout. A lot of retail traders start placing orders just outside the range of the inside bars. Buyers will place buy orders just above the high of the inside bar, while sellers will place sell orders just below the low.
This is exactly what big players want. They are setting a trap by making the market look like it’s ready to explode in one direction. Then, the breakout happens.
A candle breaks out of the range of the inside bars. This breakout candle may look extremely convincing. It’s big, fast, and it creates a sense of urgency.
Many traders enter the market at this point. They believe the breakout is real, and they don’t want to miss out on the potential profits. And this is exactly what the big players want.
They’ve lured the traders into the market at the worst possible moment. Then the price reverses sharply. The breakout candle that looked so convincing is suddenly followed by a reversal candle, and the price moves in the other direction.
Traders who entered on the breakout are now trapped in losing positions. This manipulation works because it preys on the natural instincts of traders. Inside bars create a sense of anticipation, and breakout candles create a sense of urgency.
When we see a large candle breaking out of a consolidation zone, we assume it’s the start of a new trend. We don’t want to miss out on the move, so we enter the market without waiting for confirmation. This is exactly the reaction that big players are counting on.
The key to avoiding this type of setup is confirmation. After the breakout candle forms, wait to see the price reaction when it retests the breakout level. If the breakout is real, the price will often pull back to the breakout level, and then continue in the direction of the breakout.
If the price breaks out and then quickly reverses, it’s a sign that the breakout was false. And second, a real breakout is often accompanied by a significant increase in volume. If the breakout candle forms but there’s no increase in volume, it could be a sign that the breakout is weak and likely to reverse.
Bullish/Bearish Kicker Bullish and Bearish Kicker patterns are also common manipulate on patterns. These often involve a gap, followed by a strong move in the opposite direction of the previous trend, catching many traders by surprise. A Bullish Kicker happens after a downtrend, right at the New York open.
The market gaps down at the open, but instead of continuing in the direction of the downtrend, it reverses sharply and moves upward, forming a strong bullish candle. A Bearish Kicker happens after an uptrend. The market gaps up at the open, but instead of continuing higher, it reverses sharply and moves downward, forming a strong bearish candle.
Kicker patterns primarily occur because of a sudden shift in sentiment in the market. But this shift isn’t always organic. Often, it’s manufactured by bigger players.
Just like with many other manipulative tactics, the main goal of a Kicker pattern is to create liquidity. For instance, in a Bearish Kicker, traders who are long will typically have their stop-loss orders placed just below key support levels. By pushing the price up and then sharply reversing, big players can trigger those stop-losses, creating the liquidity they need to enter their own short positions.
Kicker patterns prey on traders’ emotions. In a Bullish Kicker, the market may gap down, and traders will assume that the downtrend will continue. But when the price suddenly reverses and moves upward, traders get confused and start to panic.
This panic leads many traders to exit their positions at a loss or reverse their trades, which plays into the hands of big players. The manipulation process in Kicker patterns works because of a combination of psychological and technical traps. The first part of the manipulation involves the gap.
This gap is designed to make traders think the trend is going to continue. For example, when the market gaps down in a Bullish Kicker, traders believe that the downtrend is still intact and that the price will continue to fall. So, at the market open, many traders enter short positions.
But after the gap, the price suddenly reverses and moves strongly in the opposite direction. This is where the manipulation becomes obvious. Traders who entered short positions after the gap are now trapped.
as the price moves against them. As the price moves in the opposite direction, it triggers stop-losses that were placed by sellers on the wrong side of the market. This creates liquidity for big players to enter their positions.
This allows them to buy at lower prices before the price continues higher. Big players create the Kicker pattern to induce fear and confusion, causing reactive traders to make emotional decisions. Many of them will exit their positions in a panic, while others will reverse their trades, trying to catch the new move.
Volume can provide clues about whether the Kicker pattern is real or manipulated. If the gap and the strong move in the opposite direction are accompanied by high volume, it’s more likely that the move is legitimate. One of the best ways to capitalize on Kicker patterns is to trade the reversal.
Once you see that the initial breakout was false and the price is reversing, you can enter a trade in the opposite direction. For example, if you see a Bullish Kicker and the price quickly reverses after the gap, you can enter a short position, expecting the price to continue downwards Spinning Top Spinning top candles are fascinating because they represent indecision in the market. These candles have small real bodies, regardless of whether they are bullish or bearish, and they come with long wicks on both sides.
The small body shows that there wasn’t much movement between the opening and closing prices. The long wicks indicate that both buyers and sellers had their moments of control during the period. The result is a candle that tells us the market isn’t sure where it wants to go next.
This candle traps both buyers and sellers, having large wicks on both sides. But spinning tops aren’t just about indecision. They also present opportunities for manipulation, especially when they appear at key levels in the market.
So here, the market is in an uptrend, and then a spinning top appears. It implies that neither the buyers nor the sellers had enough momentum to push the price decisively in one direction. The market is essentially “taking a break,” reassessing its next move.
These candles often appear at the end of a big move, signaling that the trend might be losing steam. This spinning top might indicate that the buyers are getting tired, and the sellers might soon take control, potentially leading to a reversal. However, spinning tops are often used as tools for market manipulation because they play on traders’ emotions.
When traders see a spinning top, they know it represents indecision in the market. Many traders interpret this as a sign that a big move is coming, especially if the spinning top forms at the end of a trend. They believe that the market is “pausing” before making its next big move, and they start positioning themselves for that move.
Beginners are taught to place buy orders above the high of the spinning top, or sell orders below the low. This is where the manipulation comes in. Big players know that novice traders are waiting for a breakout.
They use this anticipation to their advantage. They’ll push the price just high enough to trigger the buy orders placed by bullish traders, or just low enough to trigger the sell orders placed by bearish traders. And once the big players have triggered these orders, they reverse the price.
For example, let’s say a spinning top forms after a momentum up move. Traders place buy orders above the high of the spinning top, thinking the market will continue higher. The big players push the price just above the high to trigger those buy orders, then quickly reverse the price, causing the market to drop.
The traders who entered long positions are now trapped in losing trades. And they rush to close their positions, adding even more momentum to the reversal. This is exactly what the big players want.
They’ve engineered the move to create panic and force traders to exit their positions at a loss, all while profiting from the liquidity created by those exits. Volume can confirm whether a spinning top is likely to lead to a real move or if it’s just a trap. If the spinning top forms on low volume, it could be a sign that the market is indecisive and that the breakout will be weak.
On the other hand, if the spinning top forms on high volume, it could indicate that there’s real buying or selling pressure behind the move. One of the best ways to avoid getting trapped is to wait for a retest of the breakout level. For instance, if a spinning top forms at the end of an uptrend and the price breaks below the low of the spinning top, wait to see if the price retests that level before entering a short position.
If the price bounces off the retest and continues lower, it’s a sign that the breakdown is real. If the price moves back above the level, it’s a sign that the breakdown was false, and you should avoid entering a short position. And be aware of key levels.
Spinning tops are most effective when they form at key support or resistance levels. Sometimes, you’ll see multiple spinning tops forming in a row. This is a sign that the market is in a prolonged state of indecision.
While this might seem like a strong signal that a big move is coming, be careful. Big players know that traders are watching these patterns, and they’ll often use the series of spinning tops to set up a bigger trap. If you see multiple spinning tops forming, it’s a sign that you should be extra cautious about entering a trade.
Weekly Candle Manipulation On higher timeframes like the weekly chart, manipulation tends to follow a pattern. For example, the price opens at the start of the week and trades near the opening level for a few days. Then, the price moves sharply in one direction.
Traders think this is a real move and enter their trades. Finally, the price reverses, trapping those traders and completing the manipulation phase. This type of manipulation is powerful because it plays out over several days, making it harder for traders to spot.
Big players use this strategy to build their positions slowly before making the real move. So on higher timeframes like the weekly chart, manipulation plays out in a more deliberate and extended manner, making it harder for retail traders to detect. This manipulation process occurs in distinct phases, allowing big players to build and distribute their positions, while misleading retail traders along the way.
The weekly chart, in particular, is an ideal playground for large institutions, because the moves are more spread out, giving the illusion of a natural price progression over several days. At the start of the week, the price often opens and trades near the opening level for a few days. This is the accumulation phase.
During this time, the big players are quietly building their positions. The price moves within a narrow range, often showing little volatility. To the untrained eye, this sideways movement may seem uneventful, but this is where the groundwork for the upcoming manipulation is laid.
Accumulation can be deceptive because it often looks like a period of indecision in the market. Retail traders might interpret this as a lack of opportunity, but in reality, the big players are positioning themselves for the move that’s about to come. During this phase, large players are collecting liquidity, by filling their orders without causing much movement in price, which could otherwise draw attention from other traders.
The price may oscillate slightly, but it remains close to the weekly open, keeping traders guessing about the next big move. After 1 or 2 days of trading near the open, the next phase of manipulation begins. The price suddenly moves sharply in one direction.
This move is quick and decisive, designed to lure traders into thinking that a breakout is underway. For example, if the weekly candle opens and trades near the opening level for a few days, and suddenly the price shoots down, most retail traders will interpret this as a strong bearish signal. They believe that the market is about to go down, and rush to place sell orders.
This is exactly what the big players want. By creating this sharp move, they trigger sell orders from traders and, more importantly, stop-loss orders placed by traders who were long. This sharp move creates a liquidity pool.
The traders who enter the market after seeing the sharp move, are providing liquidity for the big players to execute their trades. At this point, the big players have not yet fully entered their desired positions. They are using this move to mislead the market, making other traders believe that the price will continue, in the direction of the sharp move.
The sharp move creates a sense of urgency, and traders often forget to wait for confirmation before entering trades. They see the price moving quickly and assume that they are missing out on an opportunity. This emotional reaction is precisely what the big players are counting on.
Unlike shorter timeframes, where manipulation might happen in minutes or hours, the weekly chart stretches the process over one or even several days. This makes it harder for retail traders to spot the manipulation, because the price action seems more legitimate when viewed over a longer timeframe. After trapping retail traders with the sharp move, the big players are ready for the final phase: distribution.
This is where the real trickery happens. The price, now reverses. The long wick that formed on the weekly candle is a classic sign of this reversal.
Traders who entered positions based on the sharp move are now trapped, as the price moves against them. For example, as the price shot down earlier in the week, it now creates a long wick to the downside, and reverses, moving upward. Retail traders who sold into the sharp downward move are stuck in losing positions, as the market turns against them.
Their stop-losses get triggered, or they panic and close their positions at a loss. The distribution phase allows the big players to exit their positions profitably. They had built their positions during the accumulation phase and used the sharp move to trigger liquidity.
Now, as the price reverses, they begin to unwind their positions, selling to traders who are desperately trying to exit their losing trades. Again, if you trade on lower time frames, you will get trapped. One of the reasons why this type of manipulation is so effective on higher timeframes, is that it plays out over several days.
Traders are more likely to believe that a move is genuine, as it unfolds slowly over time, especially when compared to the rapid manipulation that occurs on lower timeframes. On a weekly chart, the manipulation doesn’t happen in a single candle or a quick spike. Instead, it stretches across multiple days, making it harder to detect.
Traders might see the price moving sharply in one direction and assume that the momentum will continue, not realizing that they are being led into a trap. The longer timeframe also gives big players more room to build, and distribute their positions without drawing too much attention. Additionally, the longer timeframe allows the big players to manipulate the market in a way that makes the move seem more believable.
A sharp move on a lower timeframe might be dismissed as a “fakeout” by experienced traders, but on a weekly chart, the same move can look like the start of a legitimate trend. This makes it easier for the big players to mislead traders and trap them in losing positions. Now, if you want to learn other smart money tactics, you need to watch one of these videos next.
Related Videos

29:54
Brokers Will Hate You For Using This Liqui...
The Secret Mindset
461,241 views

26:51
Grow a Small Account Day Trading Faster Th...
The Secret Mindset
135,931 views

29:19
Price Action Trading Strategies To Make 10...
The Secret Mindset
61,741 views

55:11
Master This ONE Candlestick Pattern TODAY ...
Ross Cameron - Warrior Trading
1,299,823 views

39:19
Support And Resistance Didn't Work Till I ...
Rayner Teo
2,072,756 views

21:49
Convert TradingView Indicators into Strate...
Michael Automates
992,569 views

48:15
Reading Candlestick Charts Was HARD Until ...
Ross Cameron - Warrior Trading
1,249,154 views

30:08
Fibonacci Trading Strategy Course Makes 1K...
The Secret Mindset
42,003 views

24:05
My Incredibly Easy 1 Minute Scalping Strat...
Riley Coleman
322,986 views

30:09
I Wasted $5,000 on Trading Education, Only...
The Secret Mindset
425,464 views

30:04
How To Day Trade Using Smart Money Concept...
The Secret Mindset
78,283 views

13:36
Do This Daily! Simple Market Structure Day...
Mindfully Trading
48,556 views

30:21
How SMC and ICT Secretly Copied the Wyckof...
The Secret Mindset
168,514 views
55:18
How to Read Candlestick Charts (with ZERO ...
Ross Cameron - Warrior Trading
3,110,666 views

22:39
🔴 The Mother of All Price Actions... Brea...
Trader DNA
118,114 views

3:26:20
Become a PRICE ACTION 'Beast'🔥 | 3+ Hours...
Fortune Talks
2,924,636 views

1:05:24
The Trading Industry Will Hate Me For Uplo...
The Secret Mindset
743,729 views

29:58
NEW Deepseek AI Good For Creating Trading ...
Michael Automates
876,669 views

19:26
My Scalping Strategy is Boring, But Makes ...
Scarface Trades
132,435 views
20:00
🔴 STRENGTH INDEX Trading (Say BYE-BYE to ...
Trader DNA
216,122 views