The Only Day Trading Strategy I Would Use If I Could Start Over...
742.77k views3889 WordsCopy TextShare

The Trading Channel (The Trading Channel)
vv
TTC Forex University - https://www.thetradingchannel.com/500off
I am looking for 500 new or stru...
Video Transcript:
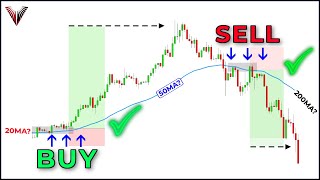
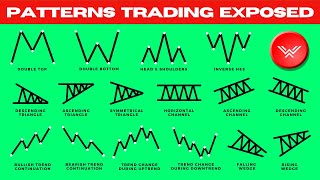
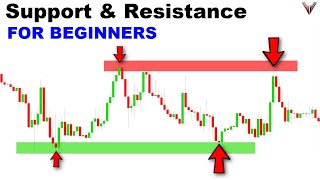
the internet is littered with a ton of different day trading strategy setups and systems and I'm not saying that some of them aren't profitable but if I had to start over from scratch if I was a beginner or someone struggling to make money from day trading then the strategy I'm gonna be sharing with you today is exactly where I would start so in this video I'm going to be breaking this entire strategy Down based on a set of rules you can use like a checklist to check off every time you're about to place a trade in your own day trading and this strategy is the exact strategy I used to get involved here on the Canada Yen the trade you see on the screen down here on the 15 minute chart so I'm going to talk you through this trade teach you the strategy and by the end of this video you're going to have a full rules-based day trading strategy that is perfect for beginner or struggling Traders so if that sounds good go ahead and click that like button for me go and subscribe if you're new to the channel hit that notification Bell and I'll be right back after the intro and disclaimer foreign [Music] I'm glad you stuck around through the intro and disclaimer you're gonna be happy that you did if you're brand new to the channel my name is Steven I've been trading for over a decade and on this channel I try my best to give you every trick tip and strategy that I've learned through the past decade of my own trading experience in order to help you speed up your journey to profitable trading so with that said let's take a look at this strategy in this Canada Yen trade this specific strategy uses two different time frames and one of these time frames is going to be used for something very specific it's going to be used to tell me if I'm going to be buying or selling it's also going to be used to tell me where I'm going to be buying and selling let me explain more about that by taking a look at the charts as you can see here on the Canada Yen I have plotted this blue line this blue line is the 50 EMA so the first thing I want to see with this strategy is that price is trending above the 50 EMA what that means is that price is consistently making higher highs higher lows higher highs higher lows and higher highs here on the Canada Yen and anytime I'm using this strategy this has to be happening above the 50 EMA and a lot of people get confused by markets that start to do something like this if prices instead of making higher highs and higher lows in a very clear way like they are here on the Canada Yen if they were doing something like this I would just not trade so to keep this really simple and to keep you from having to deal with do I need to trade or not based on if the market is trending or consolidating if it's not an extremely clear Trend meaning if you can't clearly see prices making higher highs and higher lows then I just simply don't trade at that time and I'll wait for Trend to become clear in this case it was a bad trade I was looking for an uptrend looking for prices to be making higher highs and higher lows at the point that I see that prices are in fact making higher highs and higher lows than I know I'm going to be looking for buy trades after I know I'm looking for bad trades that's step one which direction do I want to trade the next step is where where am I looking for those buy trades and for this specific strategy it's only one place that's why this strategy is so good if you're a beginner or a struggling Trader with your day trading is because we're looking for one place to place a buy or sell trade saying place that many times felt awkward but right here at the previous high that was just broken is the area I'm looking for price to pull back to in order to place possible by trades so we have the direction which is up I want to be buying this Market because why because we are in an uptrend prices are making higher odds and higher lows and we now have the where which is what or where the where is the previous level of resistance that's likely to become support in an uptrend so now that I've broken that down kind of on a whiteboard let's go to the actual trade itself here on the Canada Yen so right here in Market replay mode based on the drawing I just did what can you see happening do we have a valid uptrend well our prices consistently making higher highs and higher lows yes they are is it clear high or high high or low now we just made a higher high after I see this higher hot made my next step is going to be to point out the previous level of resistance in a zone that looks something like that once I have this level pointed out I know I'm in buy mode because we're in an uptrend and now I know where I want to be a buyer it is in this Zone we just pointed out in Gray so the next step here is to wait for price to pull back to this gray Zone and then I'm going to be dropping down to a day trading time frame in order to place my entry so earlier I said I used two different time frames for this strategy when I'm day trading I'm always looking for Trend meaning what direction do I want to go do I want to be a buyer or a seller so I look for Trend on the four hour chart and I also look for the structure level or the where do I want to buy on the four hour chart after I have these two things pointed out I wait on this time frame for prices to get into that zone then I drop down to my day trading time frame which is the 15 minute chart so if we push the candles forward here just a bit you can see that we now have gotten into our buy zone so at the moment I get into that buy zone I'm dropping down to a 15 minute chart this is the 15 minute chart I forgot to mention this during the recording and here we are a day later I'm editing this video but I wanted to let you know you can also use this on even lower time frames by looking for Trend and structure on the one hour and looking for your trades on a five minute chart so keep that in mind moving forward now on the 15 minute chart I'm looking for two very specific chart patterns using this strategy I am either looking for a double bottom in this zone or I'm looking for a head and shoulders pattern in this Zone shoulder neckline head second shoulder push higher those are the only two ways I'm going to be entering a trade with this strategy once the other conditions I just said are met so here on the 15 minute chart let's push price forward and see what we get right here we get a double bottom but what I'm going to be waiting on is not just the double bottom not just the head and shoulders pattern I want to see a break of the neckline I want to see a breakout showing me that buying pressure is going to continue past the double bottom so with that being the case and that being my actual entry I have no reason to enter yet as we push forward I still do not have a reason to enter the trade because we have no close above the neckline of this double bottom so we continue waiting to see what price does we continue waiting for a close above our actual neckline on this double bottom which eventually turns into a triple bottom and eventually does in fact break above the neckline of our double bottom so with this being the case we finally get a close above the neckline of this double bottom that is my actual entry so after all the other things are met that I'm looking for on the four hour chart we have price in an uptrend making new higher lows and higher highs we have the previous level of resistance that should turn into support that price has now pulled back to I've now dropped down to the 15 minute chart and I'm looking for what I'm looking for a double bottom or a head and shoulders pattern with the break of a neckline for confirmation once I get that that is when I'm actually going to be pressing the buy button so that's when I decided to actually place this specific trade and we'll jump out to the four hour for now hit the play button as you can see since doing so prices have in fact pushed higher and the specific trade is currently at about a 2. 1 to 1 reward to risk ratio just using this very simple strategy now you can say I wait for trend for structure and for chart patterns to trade but if you do that you're probably going to be very inconsistent in your trading which is why it's important to create a framework that is rules for the specific strategy which is what I'm going to show you now I do this through a process I call c-e-s-t it's an acronym that if you've been a part of the channel for a while you know all too well c-e-s-t stands for conditions entries stops and targets so for this strategy what would the conditions be the conditions would be four hour chart it's in an uptrend and is pulled back to the previous resistance that was broken in this uptrend those are the only conditions I'm looking for for this strategy what would be the entry the entry for this strategy would be we're in our Zone and price either makes a double bottom and breaks above the neckline or makes a head and shoulders pattern and breaks above the neckline of that head and shoulders pattern the next thing we have to do is establish rules for our stops and Targets in order to be consistent for me the stop loss goes below the zone that I created and I personally just manage my position on a lower time frame which is exactly what I'm doing now and those are the rules for a bullish version of this strategy just so you can see that I not only trade this way myself I also sent this trade out to all the members of the TTC 4X University you can see that on the left side of your screen and again that's something included in the TDC Forex University if you're interested in learning more about that it'll be the top Link in the description or you can go to www. thetradingchannel.
com otherwise what I want to do now is move on and show you a bearish version of this strategy the bearish version of this strategy is the same exact thing just flipped upside down let's take a look right now on the Whiteboard so instead of being in an uptrend let's say this is our 50 EMA we want to see prices making new lower lows and lower highs now below the 50 EMA when that starts to happen instead of looking at a previous resistance we're actually going to be looking at the previous support level that price has just broken we're gonna be waiting for price to get back up to that level we're gonna be dropping down then to lower time frames to look for either double tops or a head and shoulders pattern and the entry will be the break of the neckline of the double top or the head and shoulders pattern let's take a look at an example of this on the charts here we have the pound Yen prices are pushing below the 50 EMA are they also creating new lower highs and lower lows well it's pretty clear to see that we have a high here pushing to a low a lower high a lower low an equal high and now a lower low this would be a good trending Market to the downside meaning I'm looking for sell trades that's the direction I want to look for trading opportunities in now because of the fact that we're below the 50 EMA creating lower highs and lower lows in a downtrend the next step is to point out the area that I see for a possible trade that area is always going to be the recent level of support that was broken in this case we have this move here back up back down previous level of support that was broken is right here already have that zone drawn in for you what's the next steps well now we have the conditions met right the conditions were four hours shows me Trend in this case it's a downtrend and four hour shows me an area of structure like we have here that I'm going to be trading in the next thing we wait for is to pull back up to this area then we take a look at entries let's hit play and see when we actually get into our Zone we are now in our zone so let's take a look now on a lower time frame so as you can see here we've come into our Zone starting all the way back here but have we had a double top or a head and shoulder pattern that broke below the neckline of that double top or head and shoulder pattern well no we have not we get this like double top right here but the neckline would be way down here we get another double top here here almost like a triple top but in that case we would need this level to be broken we have not gotten any type of double top yet that's broken the neckline or a head and shoulders pattern that has broken a neckline so let's keep pushing price forward and see if we actually get one here we have another double top okay so now we're looking right here this is our double top we have one top here followed by our second top all we need is a break below this neckline and we have a valid trade so let's push the market forward one more time and there we go this would be a valid trade and the way I would be looking to trade this is by placing a stop loss depending on if the price the top of the double top is close to or far away from the top of my zone if it's super far away let's say we get a double top way down here I'll do it over here way down here I wouldn't be putting my stop balls all the way above my zone I would just go one ATR or 10 20 Pips five Pips whatever you want to do I would just go above that double top if it happened super low in the zone like this but for this case this double top happened very high in the zone so with that being the case I'm just going to put my stop loss right above the zone I'm gonna aim for something like a two to one and be wary of my levels of structure I see this level here as a pretty major little zone so what I'm going to do is go in between that zone and that's going to be my target so there you go the trade is set up we have all of our conditions met let's hit play and see how it worked out oh no we had a losing trade which is a great segue into the next part of the video I wish that I could tell you that this strategy would win a hundred percent of the time trust me if it would win 100 of the time I would have way more money in my trading account right now and I wish I could tell you that there was any strategy out there that could win 100 of the time but that's just not the case winning 100 of the time while trading is not possible what that means is that you will have losses no matter what strategy you're trading no matter how good you get a trading you're never gonna know exactly what the Market's going to do back whenever I first started trading for some reason I truly believed that the reason professional traders made money is because they knew exactly what price was going to do and every trade they place they just won those trades but throughout my trading career I learned that that's not the case at all the truth is that we are trading as professional Traders whenever you be become a professional Trader you will be trading based on a statistic advantage that plays out over a large sample size of Trades so it's not about knowing exactly what the Market's going to do it's about trading a proven rules-based system that's proven to be profitable over a large sample size of Trades and that you know will create profits if you do it over and over again even though it will have some losses in between so now that you know that losses are a part of trading and I'm sure that if you've ever experienced a loss you know that it can be somewhat emotional it can make you want to switch strategies it can make you want to shrink your target up on the next trade or push your stop loss higher and higher or lower lower to keep from losing money you get really emotional during losses and that's completely normal but what we have to do as Traders is find a way to mitigate those emotions during losses so since you know that losses are a part of trading what are some ways we can mitigate those emotions well the first one is really simple the first one this is what I do all the students in the university is risk management the more money you are risking on each trade the more emotional you're going to be and look you may have a day in the future once you're already a professional Trader you understand everything there is to know about trading you have your whole trading plan set up you may choose to risk a pretty high amount because you're good at that point and you'll know when that's the case you'll know when you're good at trading but until that gets here until you become good at trading your point in trading is not to try to gain as much money as you can by risking 10 percent or more of your account if you do that you will blow your account and the reason this doesn't work when you're a beginner or a struggling Trader is because you're not good at trading yet so while you're in the beginner slash struggling Trader phase of your trading career your risk management needs to be much much lower so that you mitigate the emotions you have when you have losses and you lose money slower risk management the amount we risk on each trade can help us to gain more over a certain period of time but it can also cause us to lose more over a certain period of time so if you're a beginner or someone just starting out or even someone who has just become profitable then risking a ton of your account on every trade is more than likely going to end and you blowing that account or pushing that account to such a negative balance that you can't control your emotions any longer so the way we handle those emotions that we have whenever we're losing trades is by having a good risk management plan the second way we do this is to have more confidence more faith in the system strategy or strategies that we are trading in the way we gain more faith in those systems is through the process of back testing back testing is nothing more than taking the rules like you just learned in this video the CEST rules you take those rules you look back in historic data throughout the past 100 trades or more and you ask yourself how many times did It win versus lose when it won what was my reward to risk ratio and with these two numbers you can figure out if a strategy is likely to be profitable in the future the only strategies you should be trading are strategies likely to be profitable in the future and the way that we determine if something's likely to be profitable in the future is through back testing and this back testing process also gives us an incredible amount of confidence that helps us deal with drawdowns losing trades and helps us handle our emotions and have a better trading mindset now mastering a strategy or strategies that makes money over time mastering your risk management and mastering your trading mindset or trading psychology is something that can be really difficult on your own and for that reason I'm looking for 500 new or struggling traders to Mentor throughout the rest of this year on their journey to profitable trading inside of the TDC Forex University if you want to learn more details about that University all you have to do is click the top Link in the description or go to www. thetradingchannel. com it obviously comes with a full University style course it comes with the pro trade report every Monday talking about the zones I'm actually looking to trade in it comes with three to five Trading alerts per week of Trades I'm actually taking based on the strategies you're learning in the course and it comes with priority email meaning that you will have contact with me directly for any trading related questions that you may have on top of all that it also has a 30-day money-back guarantee so if you'd like to check out the details of that again top Link in the description or go to www dot the trade example.
Related Videos

17:48
Technical AnalysisTrading Was Hard, Until ...
The Trading Channel (The Trading Channel)
259,438 views
47:17
The Only Price Action Trading Video You Wi...
The Trading Channel (The Trading Channel)
461,275 views

1:48:28
Chris Eubank Jr: I Was Paid $***** For The...
The Diary Of A CEO
1,018,615 views

31:32
The Man Who Makes Beginner Traders into Gr...
B The Trader
133,117 views

16:45
Raskin drops BAD NEWS on Trump over $400 m...
Brian Tyler Cohen
373,428 views
45:00
The Only Day Trading Strategy You Will Eve...
The Trading Channel (The Trading Channel)
5,419,451 views
19:04
3 Candlestick Pattern Secrets That Can Mak...
The Trading Channel (The Trading Channel)
181,395 views

42:24
I WENT SHOPPING AT MIAMI'S SUPERCAR GRAVEYARD
Mat Armstrong MK2
1,124,524 views
38:24
ULTIMATE Candlestick Patterns Trading Guid...
The Trading Geek
2,543,531 views

20:38
If I Was New To Trading, This Is The Only ...
The Trading Channel (The Trading Channel)
116,531 views
35:32
Swing Trading Crash Course 2025 (For Begin...
Humbled Trader
255,354 views

59:03
"My STRATEGY is 100% only when I trade on ...
Top Trader South Africa
87,243 views
21:29
The 1HR Price Action Trading Strategy That...
The Trading Channel (The Trading Channel)
720,787 views

16:58
Gary Neville reacts to Liverpool vs Arsena...
Sky Sports Premier League
141,558 views
11:45
The ONLY Candlestick Pattern Guide You'll ...
TradingLab
4,460,786 views

1:15:58
Trading Simple TREND LINE Strategy Made He...
Humbled Trader
336,176 views
38:51
The Only Moving Average Trading Video You ...
The Trading Channel (The Trading Channel)
2,377,744 views

24:16
Price Action Entries For Beginner and Stru...
The Trading Channel (The Trading Channel)
244,848 views
38:15
Ultimate Chart Patterns Trading Course (EX...
Wysetrade
6,043,312 views
1:17:20
Support & Resistance Trading Was Hard, Unt...
The Trading Channel (The Trading Channel)
1,138,203 views