Next Generation Sequencing 4: Checking Nucleic Acids with an Agilent BioAnalyzer - Eric Chow (UCSF)
65.63k views3490 WordsCopy TextShare

iBiology Techniques
https://www.ibiology.org/techniques/next-generation-sequencing
Next generation sequencing allows DN...
Video Transcript:
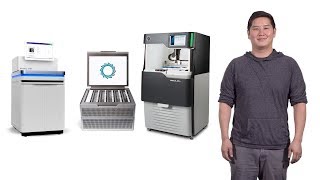
hello my name is Eric Chow and I direct the UCSF centered for viens technology today I'm gonna give you a training video on how to ask operate the Agilent file analyzer this is the system used to QC nucleic acids see it go into next-generation sequencing library preps as well as checking the quality of your final libraries for sequencing this is the bio analyzer essentially the system works by a capillary electrophoresis but instead of running samples through a long thin capillary all the separation occurs on these microfluidic chips over here so I'm going to open up
this chip and show you some more details of this chip the chip is actually made out of glass and there are several wells on the chip and this glass chip is embedded into a plastic frame and on the back of this chip you'll be able to see a whole bunch of different channels and this is where all the different samples will run and get separated and then get detected this chip once it's prepared will go into this bioanalyzer instruments and this instrument has a location to hold the chip as well as an optical detector at
the bottom to detect the passing declic acids and an electrode array on top and this electrode array on top is what causes the different samples that pass through the chip and migrate towards actor and protector so we haven't done anything prepare the chip yet and we'll go through that next so with all the different kits for the bioanalyzer you can analyze both RNA and DNA they come with a handy user guide that will essentially be following today and in this user guide there are sections where it tells you to prepare a gel dye mixture this
is something you have to do ahead of time and it takes about 30 minutes so this is something we've done before before we shot this video but all the reasons for the kits come in a small box like this that's kept in the cold room and they all come with a pack of chips that are at room temperature and so once you open up this box and today we're gonna be going over the DNA height sensitivity kits you'll see a set of reagents in here and the reagents that you'll need to prepare the gel dye
mixture ahead of time our a dye the gel and a spin filter and what you'll do a head of time is take a certain amount of the dye added through the gel and vortex it and then you'll place this gel dye mixture into this Eppendorf tube that has a spin filter in there and you'll centrifuge this for about 30 minutes this will cause that gel dye to form a nice even suspension and when you're done you'll throw away the filter it and keep the gel dye in this Eppendorf tube at 4 degrees and you'll be
able to use this gel die mixture several times for for several runs across many chips so what I have here is the tube of gel dye that we've already prepared and this is what we'll be using today but before we start preparing the chip I'm gonna demonstrate to you how to run the software the software that runs the bio analyzer is the 20100 expert software when you open up the software it will automatically connect to the biome analyzer instruments and on the left are a set of tabs that icons that you can use to navigate
to different areas of the software to set up the run you want to make sure you click on the instrument icon and on the instrument icon again you'll see a picture of the bio analyzer and the first thing you want to do is select the assay that you're running again the violent eliezer you can analyze both DNA and RNA and if you're selecting DNA you want to select the proper chip and today we're running the high sensitivity chip for RNA there are two different types of kits there are these nano and pico kits as well
as a small RNA kit if you want to run small RNA essays but what's important about the Nano and Pico kids to be analyzing RNA and one that gets a Rin number this is an RNA integrity number you have to make sure that you select the total RNA options and this will cause the software to calculate a Rin number if you select the mrna options you won't get a Rin number for your RNA so against running DNA high sensitivity will go to double standard DNA and select high sensitivity next you have an option to select
where your data get saved - you can save into a default folder or a custom folder that you select after that let the system know how many samples you'll be running on the high-sensitivity DNA chip you can run up to 11 samples today will only be running two samples and at the bottom you can give names of your different samples and you can label them down here and so we'll just use sample a and sample B so now we're going to setup the instrument and the chips to run your samples again this is the biome
analyzer and this head opens up and down to get the electrodes into a chip if you need to remove your electrode simply flip down a tab sits over here all the way to the bottom this will push out the electrode array by a little bit and once it's out you can slide it back and if you need to store this electrode array store it upside down so that these electrodes don't get damaged by bumping up against surfaces to put the electrode back into the system simply slide it back down and allow to go down on
its own don't force it in once it's dropped to the lowest position lift the lever up and this will pull the electrode array in the next thing we're going to do is wash the system to wash the system you want to use 350 microliters of nucleus free water and place it into a wash chip you can use any well of the wash ship because all the wells are connected by a reservoir to wash simply place the wash ship on the chip holder and close the system and let it sit for about thirty seconds to one
minute all this does is wash off any salts and debris that might be on the surface of those electrodes once the wash is done go ahead and remove the chip and you can just dump out the water into the trash and save the chip for future runs now we'll prepare our chip I've already opened this up from the plastic packaging and we'll place this into the priming station the chip sits down in here and doesn't really move and on the priming station and supporting the note that this is made of a plunger and there is
a holder to hold the plunger at different positions and depending on which chip and si you use you'll need to make sure that you set the plunger to the proper setting so there's a top middle and bottom setting for the high sensitivity DNA chips we'll have to use this lower setting and so you just move the silver handle down until you get it to this lower location and make sure it catches into the hold so now this is set at the load position and we're ready to start adding our reagents the first reagent we'll be
using is the gel dye mix that we prepared ahead of time this has had the dye added to the gel and spun through a filter already what we'll do first is add nine microliters of the gel dye mixture to the gel position that's marked with a dark circle on your chip and this is going to be the second from the bottom when you add reagents to these chips you want to make sure that you touch the bottom of the chip you don't have to worry about marring them because they're made out of glass so they're
much harder than your pipette chips the other thing you want to make sure that you don't do is expel a bubble at the bottom of the chip because that's where those capillaries and channels are if you have an air bubble down there it's gonna disrupt the flow of currents the next step is to bring the syringe up to the 1 mil mark and then snap the lid shut until you hear a click next gently in steadily push the plunger all the way down until it touches the hold and you want to set a timer for
1 minutes what's happening right now is the pressure in the syringe is forcing that gel dye mixture through a capillary inside of the chip and this is forming that separation channel that all the samples will go through so both the pressure and timing are important for the different chips so make sure you consult your user guide if you're running something else besides the high sensitivity DNA chip so while this is running we have about another 30 seconds one thing you can use to check your chips afterwards is you want to make sure that you don't
see any of the channels after pressurization because now they've all been filled with liquids before we do this step if you take a look at your chip on the back you can actually see all the channels if you hold it up to the light because of the glass air interfaces that are present but after priming you shouldn't see those anymore because they should all be fluid build a minute is up and we'll just release the plunger what you want to see is the plunger going up past the half mil mark within a couple of seconds
and this is in case that no pressure has leaked out of the system and so now you just slowly bring the plunger back up to the 1 mil mark and then release the plunger from the chip next we'll add another 9 microliters of the gel dye mixture to the other 3 gel positions on the chip these are the other three wells on the right side of the chip you can use the same pipette tip for all of these and again just remember not to expel any air bubbles towards the bottom of the the bottom of
the wells next we're gonna add 5 microliters of a marker solution to each of the sample wells and the latter Wells these are the twelve wells to the left of the chip so we don't add these to the gel wells that we've added material to already and you can use the same pipette for all of these as well and this just contains an upper and lower marker that can be used as reference standards to compare your sample to the latter so even if you're only running one or two samples or not a full 11 samples
you still have to add marker to all of the lanes or to all of the wells and the next step will add one microliter of the ladder to the ladder well and this is marked on the chip now we can add your samples and again there are references to the well number that correspond to the sample numbers on the chip I only have two samples so I'm now done but you can proceed with up to 11 samples on this chip the next step is to mix the contents of the of the marker and the the
samples or the ladder in the chip and to do this we use a special for texture that comes with every bioanalyzer so just make sure it's set to the proper set point and then allow to mix and make sure you set a timer so that you have you know when to stop and again to get the time for the different assays just consult your user guide alright times up now the chip is prepared and ready to run what we want to do is go ahead and place this into the bio analyzer system close the lid
and then once the system detects a chip you'll be able to click on the start button to begin the run a run of a full chip will generally take about 45 minutes and it's good idea to stick around for a few minutes till you see the the latter run just to make sure the run has started okay before you take off now our second and last sample is running what you see here is a rock trait from the bio analyzer and this is analyzing fluorescence that's being detected as sample passes through the capillary on the
low end we have the lower marker and over here we have the upper marker these are used as internal references and paired the sample to the ladder that was run first and in the middle here is our library this is a high concentration sample is roughly at around 25 nano molar and so this is why this smear is so large you'll notice that the marker Peaks are pretty sharp because they're a defined size and libraries tend to have a spread to them because they come in a variety of sizes they're not one specific base pair
length and so now the run is finishing and I'll show you how to analyze and export the data so now that screen is disappeared the run is done to access our data we come back over to the left-hand side and click on the data icon if you have several runs from beforehand you'll see the other chips here the newest one will be at the bottom which is our sample and if we click on that chip we'll get some details about the the chip the assay properties and then if you want to take a look the
raw traces you click on the electropherogram and this will show you the trace for either at one sample at a time so this is our first sample and this was our second sample or you can look at all samples at once and here sample a and sample B and down here is the ladder and so if we click on the ladder it has a series of Peaks that are present in that ladder sample and the ladder also contained the marker that we added the 5 microliters agents and those are this 35 base pair and roughly
10 KB base pair fragments that are present in all samples and so the ladder is used as a reference because we know the sizes and we correlate it with the time that it takes for those samples to come through the chip and we have these internal references that we'll use compared each of the samples so now if you click on sample a it'll also have that 35 and 10 KB marker that are used to generate the the sizing of these samples so down here on the electropherogram there are a couple of things you can do
you can set something called a reagent table and for next-gen sequencing libraries you typically set these around 200 base pairs up to 1 KB and that's displayed here and what this will do is it will analyze only the material that shows up within this range and this will give you a rough concentration in pika moles so this is a little over 4000 pika mobile molar concentration or roughly 4 nano molars it'll also give you an average size which is useful for some downstream queue seeing steps and so this library has an average size of 320
base pairs our other high concentration sample again is also being analyzed in the Spear region and what you can see is that this is a much higher concentration library this is measuring it at roughly 17 animal ur and the average size is 490 base-pairs sometimes the bioanalyzer won't detect your marker Peaks correctly and you'll see a red flag or red mark down here in the simulated gel image this is something that's easy to correct by going to the peak table tab over here so for instance on this sample B we have this minor peak that
showed up sometimes this minor peak might get misidentified as a marker and on this peak table what you can do is you can highlight over these Peaks and once see a bull's-eye up here you can right-click and manually set them as the lower or upper marker and so for instance if I wanted to call this 29 base pair peak by 35 base pair standard or internal reference I can right click on it and manually set the lower marker and this will recalculate the size of everything so now you can see that the software is now
call this my 35 base pair peak and it's calling this marker of 46 base pair peak so this isn't what I actually want so I'll go ahead and change it back and hover over my actual lower marker see the bullseye right click and set lower marker so once your data looks like it's all been set and is all the peaks have been properly called you can export this as a PDF by clicking the printer buttons on the toolbar and so sometimes they'll ask you if you want to save any changes and so I said yes
I want to save those changes that I made a window will show up and it'll give you options of what type of items to select we just leave this as the default you can tell it to print all wells or just the wells that you have samples and for us you only had two samples and then you have options to export this as a PDF or an HTML HTML file and to select the directory that you want to export this to so I'm just going to save it to the desktop to make it easier to
find and you have options to put four sheets per page or one sheet per page so I'll go ahead and save this and if we go to the desktop we should be able to see our PDF file and that should be here so if you double-click on this you'll see a summary report on the first page and as you scroll down you'll see the latter over here and you want to see nice tight sharp bands or Peaks on the ladder and then you'll see the samples and these will include some extra information down at the
bottom and so most people will want to save the PDF because this is file they can open on their own computers you can't open the actual bioanalyzer RAW files these xad files because it requires the proprietary software so you definitely want to export and save that PDF and generally this PDF is what you would send off to your sequencing facility if you're getting sample sequences so now that the run is completed the last thing we have to do is wash the system so first thing you want to do is pull out the old chip set
it aside you can throw it away it's unusable right now and then take another wash chip and fill it again with 350 microliters of nucleus free water and then place a chip in the system and close a lid and let it sit for about thirty seconds to one minute and it's really important that you this afterwards because we want to clean the electrodes in any gel and salts that are gonna be on the electrodes from running the chip it's not good to leave a chip in there long-term because those things can dry on those electrodes
and cause problems for the next user the other point is that it's really important that you remove the wash chip if you leave it in there the water will start to evaporate and cost condensation inside an electrode array so there are a lot of electronics up above that we don't want to get moisture on so now that 36 is up we remove the wash ship we can get rid of the water set it aside and then just close the system and you're done thanks for watching
Related Videos

25:05
Next Generation Sequencing 2: Illumina NGS...
iBiology Techniques
168,302 views

35:53
Imaging Flow Cytometry: A Brief Overview -...
iBiology Techniques
46,996 views
31:26
Next Generation Sequencing 1: Overview - E...
iBiology Techniques
475,388 views

25:09
How Tech Is Breaking the Rules of Biology ...
Bloomberg Originals
231,641 views

24:37
Single Cell Sequencing - Eric Chow (UCSF)
iBiology Techniques
251,085 views

7:20
DNA animation (2002-2014) by Drew Berry an...
WEHImovies
5,869,241 views

23:59
The ASML of DNA Sequencing
Asianometry
101,212 views

38:46
1. Introduction, Course Organization of MI...
MIT OpenCourseWare
482,809 views
7:34
Next Generation Sequencing 3: Purifying DN...
iBiology Techniques
51,531 views
31:57
How to use the Horiba LabRAM Aramis Raman ...
Emory Chan, Molecular Foundry
1,551 views

22:54
Metadata in BioImaging - Jason Swedlow (U....
iBiology Techniques
3,802 views

48:08
The Right Microfluidic Mixing Platform Pla...
Phosphorex
9,802 views

51:48
Illumina Sequencing Overview: Library Prep...
Ambry Genetics
181,855 views

2:02:11
2024 Nobel Prize lectures in physiology or...
Nobel Prize
9,500 views
41:35
Learn about Illumina's Next-Generation Seq...
Illumina
82,540 views

17:47
Agarose Gel Electrophoresis, DNA Sequencin...
MIT OpenCourseWare
325,452 views

28:53
The principle of Real Time PCR, Reverse Tr...
Biomedical and Biological Sciences
670,393 views

1:37:34
The Groundbreaking Cancer Expert: (New Res...
The Diary Of A CEO
5,668,546 views

16:36
How Jaguar Plans To Save Itself
CNBC
383,677 views

23:52
ABPDU VideoSOP: High-Performance Liquid Ch...
ABPDU
10,271 views