5 Price Action Rules EVERY Trader NEEDS To Know
2.03M views6220 WordsCopy TextShare

Thomas Wade
Price action describes the characteristics of a security’s price movements. This movement is quite o...
Video Transcript:
in this video we're going to talk about price action rules and why it is so important to have understanding of these rules why price action rules work it's simple it's because markets reflect human behavior human greed and fear and since the core human behavior hasn't change and most likely will not change Market will continue to move in the same way and will continue to form the same patterns again and again most retail Traders are unaware of the fact how price actually moves on the chart and why is that it's because average Trader gets first introduced
to information that will do the complete opposite of what he should do to educate him most Traders at First Look for system that will do the work for them and they will look for indicator based strategies but as most Traders already know this is a FSE errand and indicators don't work they only show past performance all these fancy indicators look great at first but the only thing these indicators do is they clutter your chart having all these indicators is on a chart will stop you from learning about the true movement of price and it's going
to be next to impossible to get the proper understanding about the price movement only when you start to focus on Raw naked price action you will understand how price actually moves since markets are not random and there is a reason to how price action moves There are rules that will help us to stay on the right side of the market and the first rule is the trend line rule which says after break of a trend line which means that the candles will close outside of the trend line new extreme is going to be formed and
after new extreme is formed we expect correction phase or possibly straight up reversal now we have a downtrend looking structure on the chart so as price action Traders we want to find a pattern because price action is never alone and naked on the chart and is always contained by some form of a pattern you guys can see we have a nice bearish downtrend working lower and we have a triple confirmation of this downtrend so at this point on the structure is bearish and Trader is only looking for short opportunities notice what price created there was
a break of this channel there were candles that Clos outside of this channel most Traders will take this information and they will think that the trend is over and they will start current Trend trading they will start looking for buying opportunities but at this point on according to trend line rules we know that we cannot go long just yet this downtrend needs to get new low it needs to get a retest of this previous and notice what price created it created move to New extreme and after new extreme was formed then we expect correction or
possibly straight up reversal and price in this instance straight up revers and this is the uptrend now when you're safe to be looking for buying opportunities so this is the rule number one when you're following the trend line you're only looking for Longs after you get a proven Trend in opposite direction and after you have a break of a channel you expect new stream to be formed same thing will apply for the shorten channels as well notice as there's a downtrend working lower there are shortterm uptrends in between and these uptrends at the same time
have a break and retest of a new extreme or at least attempt to create new extreme break new high only in this instance there's a break no new extreme form but it's because the downtrend is just too strong but you expect the same thing to happen even on a micro level even for these corrections after break of uptrend you expect new extreme to be form and then you know that this uptrend is over so this is the trend line rule bullish uptrend working higher break off the channel and the trend line rule says that after
break new extreme is most likely going to be formed and price created new high and this high is higher than the high inside of this channel so the trend line rule was fulfilled after that price created a shorten downtrend which also had a break move to New extreme and then price indicated a correction phase so after you have a break in new extreme and you have a reversal pattern you can start looking for shorts but once this downtrend played out because this was just a shorten pattern the correction phase for this overall initial uptrend came
into play so this is how you follow the trend line rule when price breaks the trend line don't start counter Trend trading just yet expect continuation of the previous Trend counter Trend trading while trend line is in play is against the price action rules and most of the time you will get burned after correction Trend can resume or reverse meaning after there's a break of a channel new ex form and there's a correction phase if the bias is strong enough there can be a larger pattern and Trend May resume or after that correction the new
trend may start in the opposite direction the trend May reverse we have a nicely fitting uptrend working higher multiple confirmation indicating to me that this channel is valid so I'm following the trend line rule I'm only focusing on Long opportunities I'm not looking for shorts even when I have a break of this channel just because we have a break of this channel that doesn't indicate reversal that's against the trend line Rule and that's against the price action rule I expect for price to create new high price created new high formed a double top which is
close enough to be considered as new high and after that price slowly Consolidated and there was eventually downtrend after that but only after you get a breaking new high the trend line rule is fulfilled and then you can start acting accordingly beish down working lower beautifully fitting Channel this is why Market geometry is a real thing and this is how you can understand that the structure is bearish you don't need any indicator all you can need is the simple naked chart naked candlesticks and you can get the understanding what the price is going to do
price close outside of this channel indicated break this is not the time to buy the market just yet price created big move to New Low to new extreme and from this point on Traders are safe to at least play with the idea of possibly buying the market and eventually going long with with Trend around rule correlates the second price action rule that says Don't counter Trend trade a lot of beginner Traders when they're watching the strong Trend go they feel that the trend cannot go any further and they will start to pick tops and bottoms
and this lot of times lead to never-ending frustration and to a lot of multiple losing streaks doesn't matter how good the signal bar looks how good the setup looks if the trend is in play under any circumstances you cannot counter Trend trade just yet you will use the trend line rule to identify the trend to follow the trend and if you cannot find the perfect trend line you will still follow the overall bias only when you get a trend improving opposite direction that's when you can start looking for entries in that Trend but under any
circumstances you cannot pick tops cannot pick bottoms and you cannot counter Trend Trend probabilities are just not in your favor and most Traders are losing their money trying to pick tops and bottoms markets are designed to make counter Trend entries look favorable and there are designed to make with Trend pullbacks to look sketchy for that reason a lot of Traders are attempting to buy the bottom in strong downtrends but most reversal attempts in Trends will fail these rallies to the upside are just reversal attempts and most of them will fail there against the overall trend
when you are not sure if the trend ended or not you follow the overall bias and even if you are struggling to find the proper trend line you are sticking with to over buyas and you are not cend trading don't sell the uptrend even if long traps occur sometimes there can be a good long setup good buying opportunity in a bullish structure in a bullish Trend Behavior may be wrong the trade may be a little bit of a congested which is another rule we're going to talk about there may be a shortterm trend line that
is in play that needs to play out remember the trend line rule it goes even for the shter term Trends as well you cannot sell the long trap even if you are confident that the buyers are trapped because the trend is still in play and you're still going against the trend and arts are not in your side you just let these long traps play out and you're still sticking with the trend you're still following the trend trend is your friend the saying has been around for a long time there's a reason why and this rule
goes for shorten channels as well even if there's a small Channel and the structure is not this big because right now I have an example of a quite a strong bullish uptrend even if the uptrend is minimal you still don't want to current Trend trade unless you have a break of a trend line and you extreme formed this one is a big one the trading range rule the most important thing to understand about trading range rule is that most breakouts of trading ranges will fail but we see it all on the internet beginner Traders are
trading breakouts majority of Traders are trying to trade breakouts and they keep losing money because most breakouts of trading ranges will fail at least temporarily there can be a pullback and the breakout May succeed eventually but if you are trading the breakout you want to take it on the breakout pullback setup you don't want to trade the breakout in its breakout phase because most breakouts of trading ranges will pull back into to trading range and the breakout will fail these breakouts are working just enough to keep the majority Traders trying but in the long term
this is not the proven strategy to approach the market and it's against price action Rule now when we are watching trading range we're observing the health of a trading range we want to see if there is a bullish imbalance or bearish imbalance now trading range rule also says not only most breakouts will fell but we want to buy low and we want to sell High you want to do the opposite but the common sense is telling you congestion is just a small pattern of a trading range and you want to avoid trading these congestions that's
a price action rule trading range rule because congestion is just a micro trading range and the price gets too indecisive there and you want to stay away from these trades price is swinging up and down up and down we as price action Traders need to identify the support identify the resistance ours are never alone on the chart there's always some form of a pattern remember price action reflects human behavor behavior and this Behavior always result into price action patterns price formed double top and we have a break below support but notice the breakout ended up
failing why because most breakouts of trading ranges will fail price broke above the resistance and what ended up happening breakout fell again and price pulled back into a trading range this is how you approach trading ranges and this is the train range rule that you want to follow you're looking for opportunities off the bottom off top and you're trying to fade the breakout you're trading them against the direction of a breakout if breakout breaks to the downside you want to look for buy and if breakout breaks to the upside you want to look for sell
another trading range structure huge breakout to the upside that is looking very bullish a lot of Traders rely on momentum but the breakout snap back into trading range another breakout right here price pull back into range another breakout and price pull back into range again most breakouts of trading ranges will fail most beginner Traders trade breakout they like the momentum they see so many bullish bars breaking up because a lot of times trading ranges are boring markets they're slow and Traders just cannot deal with this they're too anxious to take the trade once they see
price breaking out they will start buying but what they're don't realizing they're just taking other side of the professional orders which they're trying to sell because if I want to sell I want to sell as high as I can so I want to sell I need somebody to take the other side of my order people are buying I'm selling it will result into Market pulling back into training range like this another beautiful fail breakout scenario because price will just pull back into training range after breakout 90% of these breakouts will fail some will eventually work
there's no denying that but you cannot try to look for the one that will eventually work and there are instances includes in price session that will help you understand which breakout is going to work and which fail such as bullish or bearish imbalance most breakouts will fail even in small TR trading ranges this right here this small little consolidation is a trading range structure just like we saw in the examples earlier just on a small micr frame there's a support there is a resistance there's just indecision there's no clear Direction price broke to the downside
strongly this is a fell breakout and price pull back into trading range notice we traded up into this trading range so you expect for price to eventually break to the upside and even when there was a breakout to the upside notice price pulled back first because the first breakout will fail at least temporarily and this is the breakout pullback when now you know that you want to go long after price pullback and now you're safe to look for Longs but most breakouts will fail even from these tiny consolidations and you want to stay away from
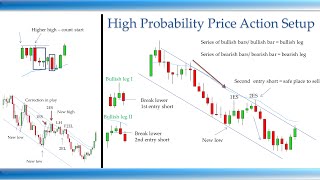
trading in the middle of these tiny little consolidations that's against the rule we just talked about three price action rules that mainly has to do with the structure and the bias of the market but is there a rule that will help us identify proper place to enter yes there is and it's called the high probability setup rule when you train your eyes to see the price movement you will realize that market moves in pairs of twos Market is not just pointing straight up or straight down no these would be w-shaped reversals and they are not
common there are small pullbacks in between and these are two Lega pullbacks remember price reflects human behavior what hity setup rule does it will tell us when to enter and when we put odds on our side that the the trade has high likelihood of succeeding so what is a high prity setup High prity setup is a second entry at key entry point with the direction of a trend it is a failed second entry that goes against the current Trend fail breakouts or higher lows lower high confirmation setups now these setups don't mean anything on their
own if we want to take a high prity setup we need to combine it with the key entry point this is the place on the chart where High probity setup can appear now key entry is a trend line support or resistance line and exponential moving average now I'm aware the exponential moving average is a indicator but we use this indicator only as a supportive tool we are not relying on this blindly this is very useful tool that can help you identify the proper key entry point and can tell you information about the structure this is
what the high prob setups look like notice we have a beish structure so what we have to do we have to draw the channel we have a trend line working lower notice we have a break and a new extreme perfectly following the trend line rule I mentioned that price likes to move in pairs of twos and this is what it looks like we have a first leg correction second leg and this is the key entry point you guys can see the trend line support or resistance line or this blue line 21 bar exponential moving average
this is the twole pullback so we have a downtrend working lower price is working to the upside we have a short uptrend that had a break a new extreme remember the TR L you keep drawing it even for the shortterm corrections so you know that the uptrend played out and price created first attempt to sell second bullish leg up and the second attempt to sell it is off the two key entry points not only the trend line but the 21 bar exponential moving as well and this is the place where the odds of this trade
succeeding are highly in your favor so as you guys can see two Lea pullback second entry short at the key entry point uption working higher break and new extreme first trend line break you're following the trend line rule you expect to get new extreme so you're still thinking about selling you're not cont trading at this point on this a twole pullback second entry short and resulted in a big move to New extreme this time you're below EMA you're at the exponential moving average even though you're not coming off the trend line you're still following the
rule because you're combining the trend line rule with the high prity setup rule I also talked about a fail second entry that goes against the trend but it's fairly simple when we we have a bullish structure working to the upside we're not concentrating we're following the trend line rule we're looking for second entry Longs two leg a pullbacks at the key entry points but we can also take a felt to like a pullback to the downside felt second entry short because the trend is to the upside it's not to the downside so any second entry
short means nothing and it means that it's going to most likely fail and we have a second entry short right here new low first entry short second entry short and we have a second entry short failure this is the fail second short against to overall trend your stop loss goes Swan below this signal bar and would have resulted in winning trade same scenario right here price created a new low first entry short pull back second entry short so this is a felt second entry short also at the same time it is a second entry long
first lag pullback second leg first entry long second entry long so the high prity setup rule says that you're only taking these setups that have higher chance of succeeding you're not interested in taking setups they are not confirming the key entry points they're are far away from EMA from the trend line and there are not variations over two Lega pullbacks we have bunch of entries right here but you're not interested in taking these entries chasing the market you're not interested in selling the market High probity setup is when price pulls back to key entry points
this is where a lot of smallart Traders are starting to buy on high probability set up the fifth price action rule that you need to follow is the signal bar rule which means you only want to take Longs above bullish bars and you only want to take shorts below bearish bars you only want to enter with the proper signal bar signal bar must confirm the direction and the momentum of the market these are few examples of good bullish bars that you want to go long above and these are just few examples of good bearish bars
that you want to sell below you never want to sell below These Bars and you never want to buy Above These Bars you need to combine the high probity setup rule with the signal bar rule so you can maximize the probabilities of trade succeeding of course stronger the context the signal bar is less important sometimes the context may be just so strong where you can afford to take a slightly less ideal signal bar and you're still following the rules but for the most part you want to stick to this rule you want to follow a
good signal bar let's now take a look how to use these rules in markets let's talk about a price action rules in trading range structures when I'm trading trading ranges there are a couple key points that I have to go through in my mind when I'm trying to identify a high prity setups and these are just the few points that quickly flash through my mind number one I try to identify the structure it is a uptrend or is a downtrend or is a trading range I want to locate key levels if I know that is
a trading range I want to find a support and resistance line because Market likes to oscillate in between these lines and if I want to follow the train range rule which means I want to buy low sell high and fade the breakouts I need to identify my support and resistance correctly I also want to locate trend lines I want to locate the shorten trend lines because there are Trends working even inside of a trading range trend line rules still apply even inside of the trading range for the most part I'm careful trading in a low
trading range I want to stay away from congestion that's very important rule I want to look for setups to fade the breakout following the trading range rule Buy Low sell High I want to be patient don't want to chase entries in case I miss the trade if I miss the trade I need to wait for another high prity setup to appear I cannot just jump the gun and risk taking entry there is not a high probability I cannot trade a breakout I cannot take first entries I cannot C and trade that will not result in
long-term consistent success I'm looking for entries at exponential moving average I'm looking for good signal bars if I'm about to enter and I'm looking for second entries with the trend and F second entries against the trend because like I said there are Trends working even inside of trading ranges so when I'm looking at the trading range like this what I have to do I need to identify my key levels and I need to identify my short and trend lines because you guys can see there's uptrend break two legs to new extreme downtrend break new low
and you guys can see the trend line will playing out perfectly after each new break there's a new extreme and then reversal up working High a little break new extreme so at this point on I expect for price to go down but at this point on we are in the middle of trading range so I'm just sitting patiently I'm not doing anything notice price created last leg to new extreme and eventually traded down so I keep drawing my short and channels I keep following the trend line rule we have a break new stream form which
tells me that the downtrend played out and notice we broke below the training range and most breakouts of training ranges will fail so I'm looking for opportunity to trade back into train range I'm following the trend line rule I'm following the training range rule I'm following the high bity setup rule but I don't have a great signal bar so I'm just waiting patiently price indeed pull back into training range I need to draw the shorten channels at this point on I have a strong bullish uptrend and I'm waiting if I get a good setup at
the exponential moving average at the key entry point because I'm most likely not going to get good entries off of this channel because it is too tight and it will be too far away from the exponential moving average notice price is strongly continuing to the upside we bounce off the resistance but I'm not selling just yet that would be against the trend I don't want to content Trend just yet we have a 20 bullish bars consecutive working higher only bearish bar was this one right here but you can classify this as a bullish bar as
well because it has gigantic bullish steem at the bottom so I expect according to trend line rule to get new extreme I notice price gr new high first entry long pullback second entry long is about to form where at the important key entry point even though the signal bar is not the greatest the context is so strong that after 20 consecutive bullish bars I'm going to get new extreme and this is a second entry long and then price created new low first entry short F second entry short this is a f second entry short that
goes against the overall trend it is once again off the key entry point signal bar is great and I still need to get new extreme I'm not concentrating just yet and if I miss the second entry long I cannot go long all the way up to here now my scalp was already made and I need to wait for proper pullback again F second entry short worked new high was formed and according to trend line rule we now expect correction or straight up reversal but I'm going to combine the trend line rule with the trading range
Rule and most breakouts will fail so I can take this fail breakout as a high probability setup and I can expect for price to pull back into training range at the same time still following the shortterm trend line rule so these are the rules that are going through my mind when I'm trading in a trading range identifying key levels sticking to shorten channels for the most part avoiding trading in the middle avoiding congestions I'm still following trend line rule with the key entry point setups with the high probability setups and I'm trying to fade the
breakouts price action rules for the uptrend I still need to identify what is the structure I'm still trying to follow the trend I'm not looking into counter Trend Trend just yet following the trend line rule identifying the key entry points identifying the High BR the setups not trying to jump the gun in case I miss a trade I'm not entering at the very highs of the move I want to take the pullbacks I'm trying to stay away from congestions I'm drawing my short and trend lines for bearish Corrections because I want to see the bearish
corrections play out so I can take long opportunities I try to identify good signal bar after new high is reached buying is on hold for short period of time until we get more confirmation and if price keeps creating multiple new extremes that's the indic indiction that there is a probably new bigger channel in play which is typical for strong uptrends so when I'm looking at the structure like this I have a break but I see price created new extreme another new extreme and another new extreme we just keep pushing higher price is failing to close
below EMA this is indicating to me that we are still in a bullish bias structure so I'm still looking for long opportunities I cannot sell just yet I would need to see a reversal pattern below EMA or proven downtrend for me to just sell I'm stay away from these congestions so at this point on I'm still thinking long but I cannot just buy at the top of the move like that it's far away from EMA and price can pull back I want to see price pulling back this is where smart Traders are buying this is
time for me to capitalize on a discount in the market and price created a new high first entry long I'm not interested in taking a long entry here because just a first entry and price created we tickle over here and created a second entry long we have a little inside bar here but this is the the proper second entry long right here so this is a twole pullback at the key entry point under bullish structure great signal bar this is a high probity setup and this is the entry that I want to take after I
take this entry I can hold the runner but I cannot take entries at these highs we're now far away from key entry point and at this point on since price ke is pushing higher there's a probably a different pattern there's a spike in a channel pattern which is typical when the first leg is steep and then the channel flattens the second leg flattens now we have a b Channel pattern and notice price created newow formed first entry short second entry short but I'm not taking this trade because it is far away from EMA and it's
far away from the trend line I'm still patient here and I'm just watching Market go without me preferably I'm still holding the runner and letting this portion of the market run so I can capitalize and locking profits without me getting anxy that I am missing a big move price is finally pulling back to my key entry point to the EMA in the form of a new high first in Long second in long with twole pullback big bullish Bar following the signal bar rule second in Long in a strong bullish structure all rules apply you the
short and down TR had to break a new extreme so this is a high prity setup followed by a high low confirmation of a twole pullback a new low form first entry short second entry short that goes against the trend failure off two key entry points great signal bar still sticking with the trend and at this point on once again I'm not chasing entries up here I'm only interested in high prity setups no this this is the point where price is creating these big moves up and without the knowledge of price session you're wondering why
price is turning up from these points what's so magical about these points the price will always bounce here well it's because there's a key entry point it's because there's a twole pullback and it's because all other price action rules are being met price action rules for downtrend are the same as for uptrend just vice versa I'm still following the same rule but I'm looking for short opportunities I see a somewhat range like structure but with a bearish bias Highs are still lower than the previous highs and the lows are still also lower and lower so
we have a range structure right here but with bearish bias so at this point on I'm not particularly looking for Longs I'm just waiting patiently for a good opportunity to appear notice what is happening next price is continuing working sideways price forming new low and created a twole pullback first entry short pullback second entry short can I take this entry well I don't really want to take this entry why because it's getting a little bit stacked we have multiple bars just working next to each other showing indecision this is not showing me any momentum and
we close above EMA if I want to go short I preferably want to sell below EMA and we are in the middle of this train range as well so this is not particularly the perfect area I want to sell however I can still see the low being lower than this and than this there's a possible down TR working lower notice what for next there was a lower high confir setup of this second entry short not only that price now confirmed momentum and pushed below EMA so now this is better entry lower high after second entry
short below EMA confirmation setup and it's according to rules price is failing to reach the resistance is staying below and the possible downtrend is now coming into duration it can also be treated as a small breakout pullback of the micro congestion right here because these bars are just small little congestion working next to each other at this point on structure is clear bearish downtrend I can identify the stronger downtrend it fits nicely off the lows and as the price is pushing lower we have multiple setups either first entries or whatever setups they're just far away
from exponential moving average I'm not interested I'm not interested in buying the market it seems the price moved too far down we're way over done it's time to pick a nice signal bar to pull back that is not how you're going to maximize the probabilities on your side you only want to stick with the direction of a trend and this trend line is still in play there was a newow form first entry short second entry short to like a pullback but signal bar is dogey horrible I'm waiting patiently price created another second entry short why
am I calling this another second entry short because we have here what looks like almost to be a micro double bottom and micro double bottoms reset the count so technically I can treat it as a first lack second lack first entry short second entry short this right here right now now has a much better signal bar it is at the key entry point and this is the proper entry price for a lower high confirmed the to leg a pullback but the signal bar is horrible so even though context is perfect here and I can take
signal bar is not great lower Highs are supposed to have good signal bars they're confirmation setups so this is how you're using price action rules you're still sticking with the trend and you want to see price pull back to key entry point another new low form another twole pullback where I trim play with a breaking new high EMA keeps holding price key entry point second entry short great signal bar high probability setup the sculp was made price pushed higher confirmed the key entry point so you're still inside this channel price form a lower high of
this key entry point you can actually consider taking this entry off the trend line but if you want to wait for sure entry to get the confirmation you can wait for lower high that will confirm this bounce off the key entry point and it's actually first entry short second entry short so this is a great entry as well and price not only formed a lower high it Formed even felt second entry long below EMA in a strong downtrend you're coming off the trend line and a second entry long that goes against the trend is a
still high prity setup after that notice price is losing momentum first break of a channel you expect new extreme and these are the rules for a high probability setup if the signal bar is bad like on this entry right here I'm not interested this is a horrible dogee I really want to see a great signal bar if context is good I can have signal bar that is not perfect but the signal bar still has to be somewhat decent and this p dogee is not what I want to sell below these are the price action rules
that you need to know and these rules will keep you on the right side of the market good luck
Related Videos
12:45
The ONLY Price Action Setup Traders NEED T...
Thomas Wade
288,496 views

40:18
The Consistently Winning Trader - Dr. Davi...
FinPort
157,514 views

36:28
Step-by-Step Tutorial to Make Consistent D...
SMB Capital
197,282 views

29:22
5 Steps to Finding Today's Trades
Brooks Trading Course
1,001,439 views

25:24
I Make 6 FIGURES A Trade Using ONLY This P...
Ezekiel Chew
167,556 views

27:58
Every Candlestick Tells a Story... Here's ...
JeaFx
541,250 views

28:51
🔴 The ONLY 8 Trading Signals You’ll Ever ...
Trader DNA
174,599 views

28:55
Best Trend Lines Trading Strategy (Advanced)
Wysetrade
4,891,924 views

39:19
Support And Resistance Didn't Work Till I ...
Rayner Teo
2,140,887 views

46:30
The ULTIMATE Guide to CANDLESTICK Pattern ...
Thomas Wade
8,554 views

13:19
Warren Buffett Just Sent a Powerful Message
Fin Tek
476,925 views

1:16:58
How to Read Market Structure | Basic and A...
Iliya Sivkov - Trading Fanatic
1,143,728 views

1:39:31
How I Made $1,000,000 in 51 Days of Day Tr...
Ross Cameron - Warrior Trading
117,205 views

28:16
I Made My First $100k Using THIS ONE Price...
The Rumers
37,533 views

27:40
The ONLY Beginner's Guide To Trading Trade...
Thomas Wade
147,021 views

1:16:49
Lance Breitstein: Verified 8-Figure Trader...
Abdullah Rasheed
954,629 views

15:50
How To Trade TRENDLINES In UNDER 17 Minutes
Tori Trades
401,736 views

45:59
The 3 Scalping Setups That Make Me A Livin...
Etienne Crete - Desire To TRADE
752,661 views

23:08
Price Action Trading Was Hard, Until I Dis...
The Trading Channel (The Trading Channel)
2,181,963 views

46:36
He Made Millions Breaking a Major Trading ...
B The Trader
217,362 views