Sampling Methods and Bias with Surveys: Crash Course Statistics #10
357.08k views2066 WordsCopy TextShare
CrashCourse
Today we’re going to talk about good and bad surveys. Surveys are everywhere, from user feedback sur...
Video Transcript:
Hi, I’m Adriene Hill and welcome back to Crash Course Statistics. In our last episode we talked about how we use experiments to imitate having two parallel universes to test things. But sometimes you can’t do certain experiments without becoming an all-powerful and evil dictator, and since it’s statistically unlikely that any of you are evil dictators, today, we’ll explore those methods.
Like we mentioned at the beginning of the series, you’re not always able to answer the questions you really want to answer using statistics. For example, it would be great to experimentally test whether getting married increases your lifespan, but you can’t randomly assign some people to be married and force another group to be single. Not only would that be difficult to enforce, it would also be pretty unethical, though I suppose you being evil takes care of that particular concern.
Similarly we can’t assign someone to be a twin, or a Democrat, or a smoker. But that doesn’t mean we should just give up and stop trying to find out more about these topics. Not at all.
Instead we just need a different method to collect data. Enter Non-Experimental methods. INTRO One of the most common non-experimental method is the survey.
From user experience surveys on websites, to political polls, to health questionnaires at the doctor’s office, you’ve probably taken hundreds of surveys in your lifetime. There are two things that can make or break a survey: the questions, and who the researcher gives the questions to. The goal of a survey is to get specific information.
Say you’re walking your dog in a local park, and someone approaches you and asks you to take a survey on local businesses in your town. When you look at the questions you notice that none of them are about local businesses, instead you find yourself answering questions about your politics and religious beliefs. Unless the surveyor was lying to you about their purposes, this is not a very good survey….
It’s also not a very good lie A survey should measure what it claims to measure. It might seem obvious that having only unrelated questions on your survey is problematic, and there are even more subtle ways a question can be biased. Let’s take a look at a few questions from a health survey you might take at a doctor’s office.
The first question asks you how often you exercise: never, less than 30 minutes a week or 30 minutes a day. So what do you answer if you exercise for half an hour twice a week? Or if you’re on swim team and exercise for at least an hour a day?
And does walking count as exercise? Multiple choice questions that don’t offer all possible options and/or an “Other” option can cause respondents to either skip the question, or feel forced to choose an answer that isn’t accurate. Claims made using these questions aren’t as strong as they could be if people were offered a full range of choices.
The next question asks you “Answer yes or no: I don’t smoke because I know it’s damaging to my health” this is a leading question since the wording leads to towards the quote “desired” answer. This is especially effective when a question deals with sensitive issues like smoking, politics, or religion. People answering the questions want to be seen in a positive light, and so they tend to give the answer they think is “appropriate”.
While having people fill surveys out anonymously by themselves can help, it can sometimes be the case that respondents don’t want to admit things--even to themselves--that are socially undesirable. In general terms, good survey questions are worded in a neutral way such as asking “how often do you exercise” or “describe your smoking habits” instead of using wording or options that push survey takers in a certain direction. And while your doctor wouldn’t.
. . or shouldn’t.
. . do this.
. . sometimes groups purposely use biased questions in their surveys to get the results that they want.
Apparently, back in 1972, Virginia Slims conducted a poll asking respondents if they would agree with the statement: “There won’t be a woman President of the United States for a long time and that’s probably just as well. ” Not a well-written question. Biased questions can be more subtle.
. . and can lead to skewed reports of very serious things like sexual assault, or mental health conditions.
It’s important to always look for biased questions in surveys, especially when the people giving the survey stand to benefit from a certain response. Even when researchers have created a non-biased survey, they still need to get it into the right hands. Ideally, a survey should go to a random sample of the population that they’re interested in.
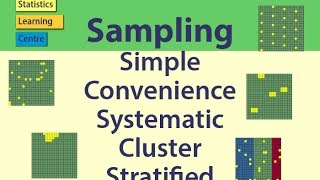
Usually this means using a random number generator to pick who gets the survey. We do Simple Random Sampling so that there’s no pattern or system for selecting respondents and each respondent has an equal chance of being selected. For example, telephone surveys often use Random Digit Dialing which selects 7 random digits and dials them.
When someone picks up, they’re asked to take a survey. But here’s where we hit our first issue. If people aren’t forced to respond to the survey, we might experience something called Non-Response Bias in which the people who are most likely to complete a survey are systematically different from those who don’t.
For example, people with non-traditional working schedules like retirees, stay at home parents, or people who work from home might be more likely to answer a middle-of-the-day phone survey. This is a huge problem if those groups are different than the population as a whole. If your survey was on health insurance plans, or political opinions, it’s likely that these three groups would have different opinions than the population, but they represent the majority of survey responses, which means your data won’t represent the total population very well.
This is also related to Voluntary Response Bias in which people who choose to respond to voluntary surveys they see on Facebook. . .
or Twitter. . .
are people who again, are different than the broad population. This is especially true with things like customer service surveys. People who respond tend to have either very positive or very negative opinions.
See the comment section below. The majority of customers with an average experience tend not to respond because service wasn’t noteworthy. Wait.
Does that mean I’m not noteworthy? Another source of bias is just plain underrepresentation. If a group of interest is a minority in the population, random sampling paired with response biases might mean that that minority isn’t represented at all in the sample.
Let's say there is a city where 5% of the population is single mothers, it’s entirely possible that the sample will contain no single moms. To overcome these issues, we have a couple options. We could weight people’s responses so that they match the population (like, counting the few single mothers who do respond multiple times so that they count for 5% of the total sample).
But, this can be problematic for the same reasons that response bias is problematic. If the few single mothers who respond don’t represent all single mothers, our data is still biased. In a 2016 LA Times/USC political tracking poll, a 19-year-old black man was one of 3,000 panelists who was interviewed week after week about the upcoming presidential election.
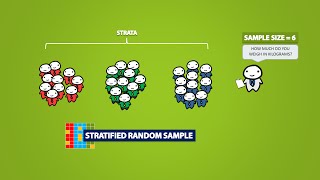
Because he was a member of more than one group that was underrepresented in this poll, his response was weighted 30x more than the average respondent. According to the New York Times, his survey boost his candidate’s margins by an entire percentage point. Stratified Random Sampling is another option.
It splits the population into groups of interest and randomly selects people from each of the “stratas” so that each group in the overall sample is represented appropriately. Researchers have used stratified sampling to study differences in the way same-sex and different-sex couples parent their kids. They randomly select people from the same-sex parenting group and.
. . randomly select people from a different-sex group of parents to make sure that they’re well represented in the sample.
Another issue is that getting surveys to people can be expensive. If a cereal company wants to see how families react to their new cereal, it would be costly to send some cereal to a random sample of all families in the country. Instead they use Cluster Sampling which create clusters (not Honey Nut Clusters) that are naturally occuring (like schools, or cities) and randomly select a few clusters to survey instead of randomly selecting individuals.
For this to work, clusters cannot be systematically different than the population as a whole and and they should about equally represent all groups. Issues can also arise when the population being surveyed is very small or difficult to reach, like children with rare genetic disorders, or people addicted to certain drugs. In this case, surveyors may choose to not use randomness at all, and instead use Snowball Sampling.
That’s when current respondents are asked to help recruit people they know from the population of interest. . .
since people tend to know others in their communities and can help researchers get more responses. And note that these sampling techniques can and are used in experiments as well as surveys. There are also non-experimental data collection methods like a Census.
A Census is a survey that samples an ENTIRE population. The United States conducts a Census every 10 years, with the next one scheduled to be done in 2020. It attempts to collect data from every.
single. resident of the United States (even undocumented residents, and homeless residents). As you can imagine, this is hard, and it is not without error.
In Medieval Europe, William the I of England conducted a census in order to properly tax the people he had conquered. In fact a lot of rulers tended to use censuses to know just how much money they should be demanding. Until the widespread availability of computers, the US census data took almost 10 years to collect and analyze.
Meaning that the data from the last census wasn’t even available until right before the next census. The length of time it took to complete the census is part of the reason we even have computers. .
. check out our CompSci series for more on that. So why collect census data--instead of just sampling the population?
In the US--the Census could cost more than 15 Billion dollars in 2020. There are a lot of reasons. The constitution says we have to, but also the census provides the truest measure of the population we can get.
It minimizes sampling error. It also functions as a benchmark for future studies. And a census can give researchers really specific information about small groups of the population--information that might be hard to gather with regular sampling methods.
Doing statistics on Census data is different, because most statistical inference aims to take a small sample and use it to make guesses about that population. But with a census we already have data from the entire population, we don’t need to guess if there are differences, we can just see them. Analysis on Census data is usually more concerned with whether differences we see are large enough to make a difference in everyday life, rather than guessing IF there is a relationship.
The census as we said can take years. And entire countries to fund. That doesn’t discount the value of sampling.
But we should be cautious. . .
Badly worded polls, fake polls, and biased polls are common. So are the results of those polls. The statistics-friendly website FiveThirtyEight put together a great list of advice on how not-to-fall for a fake poll.
Among its advice--Ask yourself if it seems professional. Check to see who conducted the poll--and if you trust them. See how the poll was conducted.
Check out the questions they asked. . .
and who they asked. If it seems fishy. It probably is fishy.
That said, well done surveys are essential. They allow us to get information without all the trouble of doing an experiment, and since they’re comparatively easy, they’re popular ways for businesses, countries, and even Youtube channels to collect information. In fact Crash Course Statistics has its own survey!
The Link is in the description. And it takes way less time than the Nerdfighteria one. I promise.
Thanks for watching. I'll see you next time.
Related Videos

10:42
Science Journalism: Crash Course Statistic...
CrashCourse
165,789 views

12:27
Controlled Experiments: Crash Course Stati...
CrashCourse
276,154 views
12:18
Correlation Doesn't Equal Causation: Crash...
CrashCourse
472,832 views

12:01
Probability Part 1: Rules and Patterns: Cr...
CrashCourse
507,630 views

43:15
Countdown to the 2024 election: Day 12 | M...
MSNBC
16,820 views
4:50
Types of Sampling Methods (4.1)
Simple Learning Pro
1,348,507 views

10:03
Maggie Haberman says she is ‘struck’ by th...
CNN
132,513 views

13:00
What Is Statistics: Crash Course Statistic...
CrashCourse
1,915,483 views

18:28
How to use Mendeley Desktop, Web Importer ...
Grad Coach
165,901 views

11:23
The Shape of Data: Distributions: Crash Co...
CrashCourse
571,370 views
4:54
Sampling: Simple Random, Convenience, syst...
Dr Nic's Maths and Stats
1,653,656 views

10:55
Z-Scores and Percentiles: Crash Course Sta...
CrashCourse
541,830 views
11:04
Chi-Square Tests: Crash Course Statistics #29
CrashCourse
596,994 views

11:27
The Normal Distribution: Crash Course Stat...
CrashCourse
357,330 views

11:47
Measures of Spread: Crash Course Statistic...
CrashCourse
631,536 views
12:05
You Know I'm All About that Bayes: Crash C...
CrashCourse
338,361 views
9:12
Techniques for random sampling and avoidin...
Khan Academy
310,984 views
13:02
Confidence Intervals: Crash Course Statist...
CrashCourse
434,475 views