LLM Course – Build a Semantic Book Recommender (Python, OpenAI, LangChain, Gradio)
100.59k views24427 WordsCopy TextShare

freeCodeCamp.org
Discover how to build an intelligent book recommendation system using the power of large language mo...
Video Transcript:
discover how to build an intelligent book recommendation system using the power of large language models and python learn to transform book descriptions into mathematical representations that enable precise content-based matching by the end of this course you'll have built a recommendation engine that helps readers discover their next favorite book Dr jod Bell from jetbrains developed this course jet brains provided a grant to make this course possible would you like to get started using large language models for your own project but you don't know where to start the technical sounding terms like semantic similarity Vector search and
zero shot classification the area can feel very unapproachable from the outside however in this tutorial I'm going to show you how working with llms is a lot more straightforward than you might think in this tutorial I'm going to show you how to build a book recommender using some of the most Cutting Edge techniques in natural language processing using llms at almost every stage I'm going to show you how to clean and prepare text Data how to use Vector search to find the most similar books to a query how to use large language models to find
the topic of a book and also how to find the emotional tone of a book using llms then finally we're going to bundle all of this up into a dashboard so people can actually get their book recommendations before introducing any new Concepts I will take you through a little bit of theory so you can understand what's happening under the hood but otherwise this is going to be a very Hands-On code driven tutorial which is going to allow you to develop your very own semantic book recommender so in order to get the most out of this
course I would recommend it for people who have some experience with python and know the basics of machine learning but you don't really need to know anything about deep learning or natural language processing in order to follow the materials finally I hope you'll be able to see that what we cover in this Tut tutorial has a lot of applications for working with text more broadly of course you can take what we learn about building a book recommender and build a recommender for anything that involves text things like movies or products but you'll also be able
to take the individual components things like text cut ification and Vector search and apply them to a wide variety of natural language processing projects before we get started I'd also like to briefly introduce myself my name is Jody Burell and I've been working as a data scientist particularly in the area of natural language processing for almost 10 years now I'm currently working at jetbrains a company well known for creating development tools and we're going to be seeing one of those tools today pycharm which is an IDE which has some really great features for working with
data science projects and also working with large language models if you'd like to reach out with some questions or comments about this tutorial my social media links are in the description of this video and I'm also going to share some other content you might find interesting in the area of natural language process processing that I've also created with all of that covered let's get started so we're going to start this project in the exact same place that we start any data science project and that is of course by getting some data so we're going to
be getting data today from one of my favorite sources and this is kaggle data sets so kle has this fantastic subsection which posts a whole bunch of really interesting data sets we can get to that by going to kaggle.com datasets as you can see here now the really interesting thing about this is a lot of these data sets were created by members of the community and they've generously uploaded those for all of us to use in our projects and something else you can see is that NLP is one of the specific tags so there are
a whole bunch of really interesting NLP data sets you can see these here we of course want to do something very specific today we want to have a look at data sets that have to do with books so we're just going to click out of that tag and we're going to specifically search for books data sets and what we found here is the data set that I have already looked for that I want to work with for this project and that's the 7K books data set so if we go to the page of this data
set and we scroll down to where the data set is described we can see that there are a whole bunch of really interesting columns that we can use for our recommender so we have of course the ISBN the book identifier we've got the title and subtitle of each book and and who wrote it the authors we've got the categories of the book we've got a thumbnail of the front cover that we might be able to use later a description of the book and then additional Fields like when it was published and what the rating is
so now that we have this lovely data set let's talk about how we're going to work with it and the tool we're going to be using to work with this data is py charm so pycharm is an all-in-one python IDE and it gives you a huge range of functionality for working with python including in data science and as we'll see later specifically for working with large language models so if you want to follow along with me and have all of the same functionality that I do you can of course download a copy of pycharm if
you don't have it already so just pop over to the pycharm landing page at Jet brains.com slpy charmd datascience and you'll see we have the button here to download it now for viewers of this video we're actually offering an extended 3-month trial of pycharm professional so if you pop down to the description section you'll see that promo code there and then if you pop over to Jet brains.com st/ redeem you'll see you have the option to redeem it there so if you don't already have py charm and you want to follow along just pause this
video go do that and then we'll get started in the next section so once we've installed pie charm we can of course open it just by clicking on the icon in the dock here on Mac and what you can see is this then lands us on the welcoming screen so py ch's welcome screen shows you the most recent projects that you've worked on and it also gives you a quick way of either starting a new project or even just quickly starting a new notebook or a new script you want to get started a little bit
faster so we're going to start a new project because we know that we're going to be doing quite a lot of work so we click on new project and what this then takes us to is a loading screen in order to create this new project and we have a few different options for project types as you can see over in the left hand side so because we're working on a Scientific Python project a Jupiter based project we do have the option of creating a Jupiter based project and what this does is default to an anaconda
interpreter and it also gives us you know a bunch of other things that are sort of set up in the project structure like assuming that we have and gives us folders for that but I have a preference for using virtual environments so I'm actually just going to stick with a pure python project and what you can see is that gives us the option of a few different interpreter types so virtual environments anaconda and we can also create other types of interpreters so just leaving it as the default for uh virtual environment and now I'm going
to name that project and we're going to call it book recommender big surprise and then once I've given it a name we can just click create and it will go ahead and make that project for us so pycharm has now gone ahead and created that new project for us and if we go down to the right hand corner we can see that it has set up that new interpreter for us as requested set up a 311 interpreter for me because that's my system default but you have the option to play around with different interpreters uh
if you would like when you set up your project and you can also see if we go across to this python packages tool window that it's set up a fresh virtual environment as requested so we just have the basic packages installed and it's ready for us to install our packages so we're now going to use this python packages tool window in order to install all of dependencies we need for our project so the first library that we're going to install is called kaggle Hub this gives us a really convenient way of interfacing with data that
we might want to use from kaggle so rather than having to manually download it this gives us a really nice way of managing downloading that data the next we're going to install is pandas pandas I think needs no introduction but basically it's going to giv us a really convenient way of working with that tabular data that we're going to be downloading from kaggle and then for visualization we're going to be using map plot lib and we're also going to be using Seaborn so you can use whatever graphing package you like I just have my preferences
Seaborn is my favorite and Matt plot lib is a dependency for that but you know whatever graphing packages you want to use you can of course use then we're going to also be working with some credentials um we're going to be working with some models from open Ai and that's going to require an API key so a nice package that I found for working with this is called python. so that's the next thing we're going to install and then we need some packages for working with large language models so the first of these is a
framework called Lang chain and we're going to go into this a bit more in the next section but Lang chain is essentially a collection of packages which is designed for doing all sorts of stuff for working with large language models so Lang chain is going to be really useful for when we need to create the recommender we're going to see how to use that again as I said more in the next section the Lang chain is basically broken down into a number of different packages we're going to be installing three we're going to be installing
one called Lang chain Community we're also going to be installing one called Lang chain open AI for working with open AI model as I said and then we're also going to be installing one called Lang chain chroma and this is for working with a V database so having installed all of these we can move on to our last few packages the next important package for working with large language models is Transformers and Transformers is a really powerful package from hugging face which is designed for working with open source large language models and again later in
this video we're going to see more of how you can work with Transformers but this is a very powerful package as well and gives you a lot of options working with llms we are also going to be presenting our results or um allowing people to interact with our recommender through a dashboard so we're going to be using a framework called gradio for that and we're just going to install this here and then finally of course we're working with a jupyter notebook so we're going to go ahead and install Jupiter and also iPie widgets so that's
everything we've set up all of our dependencies for this project if you're following along you can also install these here at this stage and you know that means that the Project's going to run smoothly for you as we work through the tutorial so with all of that set up we are finally ready to start working with our data so first things first we're going to create a fresh duper notebook so we do this by right clicking on the project name going to new and going to Jupiter notebook and this is going to open up a
new Jupiter notebook for us and remember I mentioned that we were downloading the kaggle Hub library and you may be wondering what we were going to use that for well if we go back to the page where our data set is on kagle and we go to this download button in the right top Corner what we can see is that it actually gives us this ability to download using this kaggle Hub package and it gives us some template python code that we can use so we copy that code go back over to our jupyter notebook
and paste that in what we can see is that it's given us a path where it's automatically in the background downloaded that data for us so let's now explore this directory that kaggle Hub has created for us so let's copy this path and we're going to open a new terminal window and within that terminal we're going to navigate to that directory and if we use LS to have a look at what's in that directory we can see that what kle Hub has downloaded for us is one file books. CSV and this is our entire data
set so this actually makes life easier for us because we don't need to merge or combine anything so now that we have the location of the data we can read it into pandas so of course we import pandas as PD and then what we do is we use the pandas read CS B uh method we're going to change that into an F string and then what we're going to do is insert that path and combine that with the book CSV file so once we do that we can have a look at our file and voila
we can see that exact data that we saw on kaggle read into a panda's data frame and ready for us to work with so I think all of the hype around large language models has sort of given the impression that working with Text data or or these NLP projects are really distinct from other types of data science or machine learning work but they're really not they're actually you know they have all of the same problems as other type of data science projects and of course what that means is the first step is inspecting the data
so let's have a look firstly at the data frame that we've just read in and we had a quick look at this when we had a look at the kagle page but let's just have a look through it again so what we can see is we've got a number of really useful columns we've got our identifiers our ISBN we've got the title and subtitle of the book we've got who wrote it and we've got the category of the book and we've got that description field which we've already pegged is likely to be pretty much the
most useful information we have about the book you know telling us why people might like it why we can recommend it then we can see we've got a number of other really interesting Fields we've got the year that the book was published we've got the average rating we've got the number of pages and we've got the number of ratings so we've got a lot of really good information here to start on our project so let's now have a closer look at the data and this is usually the stage in any data science project where we'd
be writing a bunch of boilerplate code in order to get the relevant descriptive statistics but luckily pycharm gives us a way to shortcut this because it is quite boring and what we can do is we can use a feature in the interactive data frames called show column statistics so if we click on this button what we can see is we have a couple of different options I'm going to pick detailed and what you can see is the detailed gives us the relevant statistics for each data type above each column so whether it's categorical or continuous
so let's have a look at the information that this has given us so the first piece of information that jumps out is that we have 6,810 books and if we have a look at the ISBN 10 column we can actually see that these are distinct so we have all of these entries are unique and it means we're not going to need to do any duplication the second thing that jumps out is if we go over to the subtitle column we can see that it has a lot of missing observations so probably 2/3 of the observations
are missing and this really makes this column useless in and of itself we can't really use it by itself so we're going to have to get creative and think about how we might be able to use it if we want to keep hold of that information the next thing that we can notice is with the categories column if we have a look at the number of distinct observations there are a lot of different categories and we've already kind of seen that you know if you actually look at the column you can see that it has
really useless looking categories like hland horn these are not really useful categories so we're probably going to need to C clean this and standardize it in some way in order to make it useful because you know we potentially want to use it as part of our recommender and we don't want to have hundreds of different categories for people to pick from and then finally let's have a look at our most important column the description column and we can see that we only have description missing for around 4% of books so this is pretty good but
we should do some deeper investigation just to check whether you know this missingness is not biased in some way so it's really important to check whether missing values have a pattern because this can imply some sort of bias if you find that the missing values are linked to particular characteristics about say the books that we have in our data set so my favorite way of doing this is by creating a missingness heat map using cabor this is pretty easy to create so of course first thing we need to do is import our dependency so we
import caborn and we import map plot lab pip plot and then once we've done that we instantiate our map plot lib plot and then what we do is we tell map plot lib that that is going to be a Seaborn heat map and we're going to change this so it is a heat map which documents all of the different missing values the is na values and we're going to transpose that just to make it a bit nicer for the display now now that we've done that we are going to add some labels so we're going
to add the X label columns so that's all of our fields or our variables in our data set and we are also going to add a y label for the missing values and then we just need to display that plot so this gives us a really interesting picture what you can see is that you know as we saw in the descriptive statistics subtitle is mostly missing so we can kind of write that variable off thought you already knew that we can see that for the middle variables so categories thumbnails and description it's mostly looking random
but if we look at the three bottom variables average rating number of pages and rating count we can see that there's actually a clear pattern here that observations that have one of them missing have all of them missing so what we can kind of conclude from this is that these are probably from another data set and that data set didn't contain all of the books in the bigger books data set so this may potentially be a source of bias because maybe the books that are missing are you know missing because they're newer or because they
have other characteristics maybe they are better rated or Worse rated so this is something that we're going to check out next so the final thing we're going to do with missingness is we're going to take a closer look at those books where the description is missing and this is really important because this is really the core field that we're going to be using for all the natural language processing work going forward so it's important to know whether there's any bias in the type of descriptions that we have missing because we're going to be getting rid
of these books and we need to know whether our recommender will then skew towards certain types of books so we have these really nice descriptive fields we have the year that the book was published we have the number of pages that the book has and we have the average rate of the book so we can use this to deduce things like you know our books that have missing descriptions more likely to be older or more likely to be shorter so in order to do this the first thing we're going to do is create a numeric
representation of which books are missing so we're going to use nump wear method and what we're doing is basically saying books where the description is missing put a one in that column if but it's not missing put a zero then what I'm going to do is convert the year of the book into the age of the book so we're going to take the year 2024 and subtract that book year and let's run that now we can see that we've made a mistake with the name of the variable so let's just correct that and run it
again and that's worked now what we do is we create a list with just the subset of columns that we want from our book's data set so we want the number of pages we want the age of the book we want the missing description and we want the average rating then what we do do is we basically create a correlation Matrix directly off the Panda's data frame using just those columns and you can see I've changed it to Method equals Spearman rather than Pearson just as an aside if you're interested in the statistics behind this
peeron correlations are more appropriate when you're dealing with completely continuous variables but as you can see the missing description field is binary so Spearman is just a more appropriate correlation coefficient when you're dealing with non-continuous values okay so we have our correlation Matrix now what we're going to do is convert that into a caborn heat map so basically we set up the theme and the figure and then what we do is we create the heat map pass over the correlation Matrix put in some you know formatting things such as you know the number of decimal
places the color scheme and also the labeling we set the title of that heat map and then we show it so let's now have a closer look at this heat map and really what we're interested in as I said is this missing description correlation with the other variables we want to know whether any of these variables have a high correlation with missing description and the reason we want to know this is say number of pages was correlated with missing description it would indicate that either longer books or shorter books had a missing description and as
you'll see we're not going to use the books that have a missing description so it means that our recommender may be biased towards shorter or longer books same as with the age of the book and with the average rating but if we have a look at these values you can see that they're really not very strong and just to kind of give some context for those of you who are not used to interpreting correlation coefficients anything that's close to one or minus one is a really strong correlation anything that's closer to zero is a very
weak correlation indicates there's not really a relationship so you can see there's nothing really there and what this gives us is a bit of confidence that at least in terms of these Dimensions our book descriptions are pretty representative so we're going to have a pretty good range of older books of books with a good range of ratings and good range of lengths in terms of what we can give our um users of our recommender so because we have a small number of observations with missing values because you know there doesn't really seem to be a
pattern in terms of the missingness and because replacing these descriptions is going to be a pain in the butt it's probably going to involve a lot of web scraping to retrieve the actual description I think it's safe for us to just delete those observations with missing values so first things first let's do our due diligence and find out how many books that's going to cost us so what we can do is do a bit of conditional logic using pandas and what we want to know is those books that are going to have a missing description
that are going to have missing number of pages a missing average rating and also a missing published year so you can see this conditional logic is basically saying if it is missing in description or it's missing in number of pages etc etc please fetch me all of those observations so we look at the resulting data frame what we can see is this consists of 303 rows which given the size of our data set this is well under 5% so we can definitely go ahead and get rid of these observations and not stress too much so
let's now create a new data frame which is going to remove these missing observations so we're going to call it book missing and we're just going to modify this conditional logic so that it is the opposite of what we created we want to keep all of these observations that don't have these fields missing so what we'll do is add a negation to the front of each of the conditions and we'll just change those oros to ANS and voila we have our new data frame which has only those books that have all of those fields with
complete values so the next thing we're going to do is revisit that categories field and just to remind you the problem we had with the categories Feld field is it just had way too many distinct values so it's kind of unusable in its current form so first things first let's enable the column statistics again and check what it looks like after we deleted the missing observations and we can see that well it's still a mess we still have over 500 different categories but it probably wasn't going to solve the problem because we only deleted 300
or so observations so let's just have a look at the type of categories that we have and we can see you know there are some that are very very specific like Highland mour I'm guessing that this is probably one of the characters in the book and this is just so specific no one's going to use this as a category so let's have a closer look at the distribution of categories and so the way we can do this is by taking the value counts of each of the categories and I'm just going to add a bit
more code just to make this a bit easier for us to visual ual so I'm going to reset the index so that all of the categories are put back into a column and I'm going to sort the values by count and I'm going to sort it by descending so what we have is basically the categories that are most popular at the top and those that are the least popular at the bottom so we look at the resulting table you can already see we really have a very uneven distribution of categories so fiction is the most
popular juvenile fiction is next and then it just sort of keeps going down into more and more specific Fields but to really get a handle on how uneven this distribution is let's visualize it so we visualize it as essentially a bar chart showing the counts of each of these and so we can use this really handy function that belongs to data frames inside pie charm so we go up to this button and click chart view what we then switch over is to a no code panel that allow us to do visualizations directly off the data
frame without having to write any code so if we go over to the settings what we can do is change the Y AIS to count and then we can change the type of chart to bar and this gives us a really good indication of just how uneven that distribution is so we can see that if we hover over it it really doesn't take very long until we start getting to categories that only have one or two actual books contained within them so this shows us really we have a longtail problem with book category and we
really really need to focus on how we're going to normalize that so that's actually going to be one of the sections of this video I'm going to show you how to do this using large language models and this will be a way of introducing you to text classification and how you can do this using very modern tools so the final thing that we're going to do in terms of cleaning and screening this data is just having a closer look at that descriptions category and seeing whether there's a way to potentially refine it a bit more
so the really important thing about the descriptions category is that it needs to be meaningful it needs to contain enough information about what the book is about so that we can recommend it because if it's not in the description it's not going to be anywhere so let's have a look at our new data frame the book missing one and if we scroll over to the description column what we can see immediately in the top 10 is a completely useless description we can see this on the seventh row where it says donation so this is obviously
not going to be a helpful description and we want to get rid of ones like this so the easiest way to actually identify these is by checking how long they are you know this has one word so it's probably not going to be a useful description so what we're going to do is create a bit of code and the first thing that we're going to do is oh we can see that py charm has already completed that for me but basically what we're going to do is create a new variable called words in description and
what we're going to do is take the description split it based on space this is the default for string split and then what we're going to do is ask for the length of that list that results from splitting that string and what that would give us is a count of the number of words so we've assign this to a new variable so again let's look at the data frame and you can see that we have you know a pretty good distribution of the words in the description and you can see there again on row seven
our donation one the one with one word so again let's visualize this we're going to use the chart view functionality again and what we're going to do is assign we're going to switch over to histogram and then we're going to assign the words in description variable to both the X and the Y AIS and we'll just change this to count on the Y AIS so what you can see is we have actually a pretty you know even distribution of the number of words in the description between you know probably about 10 or maybe a little
bit higher up to around 2 or 300 so what this means is it's not really a natural break point where there are a clear group of descriptions that are really short and a maybe you know donation or something like that and those that are a bit longer and more meaningful so what this means is we're going to need to create an arbitrary cut Point ourselves so a relatively straightforward way of working out where this cut off will be you know how many words a description needs to have in order to be meaningful is just come
up with some cut offs come up with some bins for how many words the description needs to have inspect the descriptions that have those number of words and then you know it's really just a gut feeling for whether you think that this gives you enough information to know what the book is about so what we're going to do is create some pandas code and we're going to filter the pandas data frame so that we have all of those books where the words in description are between 1 and four to start so there's going to be
our smallest group and we really just want to return the descriptions so that's what we're going to put in the second part of the conditional and when we run that what we find is yes indeed these are all completely useless you know first published in 1813 edited by morrice hendle no marketing blur fantasy hman like these are not very helpful so basically we can I think skip this and decide that this is definitely too small no big surprise so let's move up to the next bin and I've decided on between 5 and 14 words and
again this is really just a bit too short a matter of life and death and the Throne of England a title story in this collection of shorts and now film from Angley this is really not giving us particularly good information so let's now move up to the next bin and this one will be between 15 and 24 and you can see we're actually starting to get to a point where these are becoming meaningful like a boy imagines what it would be like if he had things such as duck feet or you know a magical and
Fantastical collection of early stories still probably not enough though so let's go up to the next bin this is actually spoiler alert going to be the final bin that we look at and what you see is well and truly now we're at a point where we have enough information it would be the most natural thing in the world but in Tony Parson's latest bestseller three couples discover that mother nature blah blah blah so this is really where we're starting to get to the point where it seems like there's enough information so I think it's reasonable
to use 25 words and up in the description as a cut off and now we need to really see what the impact of that is going to be so let's now create some filtering code to clean up the data set again and remove all of those that have less than 25 words in the description so again we are going to create a new data frame called book missing 25 words and we're going to filter obviously book missing and this will be all of those rows where words in description are more than or equal to 25
so we're going to keep those and then when we create that let's go ahead and see how many rows that actually contains and we can see that it contains around 5,200 so we have lost quite a lot of books as part of this filtering but essentially we wouldn't have been able to use them anyway unless we replace those descriptions so 5,000 is still a pretty good number and I think we can be happy with that as the basis of our recommender okay so there are a couple of final variables that we want to create before
we declare that cleaning and screening is completely done so the first thing is we need to decide what we're going to do with the subtitle field so as we've already established it's unusable on its own because there are so many missing values but it's quite common to have a Convention of books paired with their title and subtitle so say spiders web colon a novel would be you know a pretty normal convention or empires of the monsoon colon a history of the Indian Ocean and its Invaders so what we can do is create a new field
called title and subtitle and what we can do is we can actually pair the two if it exists so again we're going to use NP Weare so first we start typing in for those where the subtitle is missing we add the npw clause and what we do is we specify that when books missing uh when subtitle is missing um please just use the title but when it is present when there is a subtitle what we want you to do is to aggregate the title and subtitle and we need to convert that explicitly to a string
because there are a lot of missing values and they're considered as a float in pandas we can join them using a colon and voila this has done the job so let's go and have a look and what we can see is we have this lovely new column which contains the title and subtitle and it looks very good now the last thing we want to do is we want to create a new description column which tags each description with a unique identifier and I'm going to explain why we need to do this in the next section
you'll see why it'll be important for building the vector database but for now just trust me on it and I'll explain soon so we can use either of the ISBN fields for this because we know that they're unique identifiers I'm going to use the ISBN 13 and essentially we're going to do a very similar thing that we did to create the title and subtitle we're going to create a new variable called tag description and what we're going to do is take the ISBN 13 and the description again we're going to explicitly convert them both to
string and then what we're going to do is join them so that the ISBN is just attached as the first word of the description so now that we've done that again let's have a look and what we can see is that we have successfully created that column so that's it we have completely cleaned up the data set it is now ready for all of the NLP work we want to do with it so we're now ready to save it to file and use it for the rest of our project so what we're going to do
is drop some of those columns that we created that we don't need we're going to drop the subtitle column the missing description column the age of book column and the words and description column because we don't need them anymore we just use them for cleaning or for uh filtering and then what we're going to do is just save that to CSV we're going to call it books cleaned CSV and we're not going to save the index cuz we don't need it and that's it now we have prepared everything we've gotten all the boring stuff out
of the way we've eaten our vegetables and now we're ready to get into the fun NLP stuff so now we've gotten the hard bit out of the way we have a lovely clean data set and we are ready to start building our book recommender and to do this I'm going to show you how we can take raw text and turn it into a vector something that captures the meaning of the text and allows us to compare how similar or different pieces of text are we're then going to bundle those vectors up into a database allowing
us to efficiently find the most similar books to a query we'll start with some theory that will help us understand why and how llms create vectors and then I'll show you how you can easily create your own Vector database in this section we're going to learn how to transform text into a form that allows us to compare how similar documents are to each other mathematically this has many useful applications and in this section we'll see how we can use it to find the most similar books to a query that we have to start explaining how
to do this we need to understand a basic building block called word embeddings now to understand what these are let's take seven words queen king girl boy woman man and tree now let's say we try to manually grw them in a three-dimensional space based on their similarity so we put woman and man together we put queen and king together we put girl and boy together and off in the corner we put tree now if we take the coordinates of each of these words we can see that along this First Dimension girl and boy are similar
but the rest are quite different so perhaps this represents something to do with age on this second dimension Queen and King are similar and different from the rest so maybe this Dimension represents something to do with class or nobility and finally in the third dimension all of the people are similar but tree is different so this Dimension maybe represents something to do with personhood these values for each word are word embeddings and they represent the meaning of a word by grouping words that are similar and creating distance between words that are dissimilar of course we're
not going to create these Word embeddings manually that would be a nightmare especially for large vocabularies instead we rely on word embedding models to do so which learn these relationships by seeing how words are used in context so to demonstrate this I'm going to show you how a model called word to VEC works specifically the skip gram architecture the way this model learns the word embeddings is by taking all usages of each word in your training data and trying to predict which words are likely to surround it so let's take the case of the word
best we're going to ask the model to predict which word immediately preds and follows best so initially its guesses are going to be pretty inaccurate but as it sees more and more examples of sentence fragments containing this word it will adjust its internal waiting and these guesses will get closer and closer so let's get to training this model in our first sentence fragment the word in front of best is the and the word after it is the things in our second example it's also the and things however in our third example it's the and Halloween
the model is therefore going to predict that the most likely word to proceed best is the and with a little less confidence the word that follows best is things the weights that it uses to make these predictions end up being the word embedding for best we repeat this exercise for for every word in the vocabulary meaning we have a word embedding for each word in our Corpus do you know the way that this model is trained it means that words that are used in similar context end up with similar weights in their embeddings so you
can see that best worst and funniest are all used in similar contexts when we look at the resulting embeddings we can see that these three words therefore have similar embeddings in contrast words like war attack and blast are all used in very different contexts so they have very different embedding weights on each Dimension now in practice word embedding models don't have three or five Dimensions like I've been showing you so far but they usually have hundreds or even thousands in addition we also don't care in principle what these Dimensions mean we only want them to
separate out words that are different and group words that are similar so word embeddings were the hottest thing ever for a while when they first came out I remember I actually used them at my first data science job and I was completely fascinated by them however one of the biggest limitations of word embedding models is that all meanings of a word are collapsed under the same token regardless of whether it means different things in different contexts an example of this is the word bank which has very different meanings depending on the context we can see
that in two different sentences he checked his bank account describes Bank in the sense of a financial institution whereas the river bank was peaceful refers to bank as a natural feature this is where the latest generation of models come in which are designed to understand the meaning of a word in context broadly they're based on a type of neural network called a Transformer model and all of The Cutting Edge llms like the chat GPT models Claude Gemini minstral 7B and falcon are all variations of this type of model so I'm going to give you a
very high level explanation of how these models work so let's start with our example sentence he checked his bank account so we start by transforming each of the words into word embeddings just like we did with the word to back model but we then add positional vectors to each of these embeddings to indicate their position in the sentence so the embedding for he would be waited to indicate that it's the first word in the sentence would be waited to indicate it's the second word and so on and so forth these weighted word embeddings are then
fed into a mechanism called self attention self attention basically uses the information from the weighted word embeddings to understand how much attention it needs to pay to the other words in the sentence in order to get the meaning of that word so let's break down these self attention vectors each word has its own vector and if we have a closer look at the vector Vector for the word bank we can see that each of the vector elements corresponds to a word in the sentence so the first element corresponds to he the second to check and
so on as you can see the highest values in this Vector are for the words check bank and account indicating that the model has worked out that in order to make sense of the meaning of the word Bank in this context it needs to take these words into account so you can see that accounting for the words checked and account allow the financial meaning of the word bang to be discovered by the model as you can also see the self attention mechanism tends to focus on the word it's finding context for most strongly as such
the model creates these self attention vectors for each word multiple times and then averages over them finally the model does some normalization which makes it easier to work with these attention vectors and this process of generating self attention vectors and then normalizing them is called an encoder block the attention mechanism allows Transformer models to do all sorts of interesting things with text we can see this with the original architecture of the Transformer model which was designed to translate sentences from one language to another so in order to do translation between two languages a Transformer based
model needs two components an encoder and a decod as you can see in both the encoder and the decoder they both use attention blocks to process the text Data coming in however their goals are a bit different the role of the encoder is to learn everything it can about how words in the source language relate to one another and send that information over to the decoder the decoder has a slightly more complex job it need toos learn everything it can about how words in the target language relate to one another it then uses that knowledge
as well as what the encoder has sent over about the source sentence to predict word by word the most likely sequence in the target language so you can see that in this example here let's say we have the sentence in English I have visited Italy we want to translate it into German our encoder will have learned a whole bunch about how English functions and our decoder will have learned about how German Works our sentence is then processed by the encoder and word by word the aoto will generate the closest matching sentence in German over the
past 6 years the Transformer architecture has been so successful that it's led to the development of larger and larger models which are of course called large language models or llms the basic Transformer architecture has spun off many different types of models some like the original model use both encoda and dcota blocks we're going to see such a model in the next section of the tutorial however many only use dakoda blocks most of the generative text models you'll be used to using are decoder only models and then there there are the encoder only models which tend
to be good for tasks that require a full understanding of the sentence llms are now so big that they're generally too expensive for most people to train from scratch however the brilliant thing about llms is that due to how they learn during training they are natural language generalists they have a deep knowledge of how their training language work they've been used in such a way that they can be adapted to many tasks and this has led to a proliferation of what are called pre-trained models these are large language models that someone else has trained and
they've made available to the public for use for a downstream task here are some examples of pre-trained models you can see open source models here on a hugging face which I'm going to be explaining in more detail in the next section then here are proprietary models offered by open AI there are many many different models which have been made available by either large tech companies or research institutes and the explosion and models can sometimes make it feel overwhelming to get started working with llms however I hope by the end of this video you'll feel more
confident about these models and how to apply them in this section we're going to be using encoder models so let's have a closer look at these now as encoder models are designed to understand the meaning of full sequences such as how all the words in a sentence relate to one another they're trained with a goal that forces the model to understand this so let's take the case of a model called Roberta which is trained by getting it to predict a masked word in a sentence that is a word that is missing so let's see how
this training Works let's say we have our training sentence I grew up in Paris so I speak mask and English mask of course representing the missing word what Roberta first does is to tokenize this sentence and add these special CLS and sep tokens to indicate the beginning and the end of the sentence these tokens are then passed into the model and the model retrieves word embeddings for each word weighted by their position in the sentences these are then passed through a bunch of encoder blocks to get all of those self attention vectors the final part
of the model uses everything that it's learned about the representation of these words in a sentence to make its prediction about what the missing word is at the beginning these guesses are going to be quite bad again just like with the word Toc model however after seeing many many many different examples of such sentences the model builds up an internal representation of how the language works and becomes very accurate the original Roberta model was trained on 160 GB of text so you can imagine that the models have a chance to build up a really rich
representation of the meanings of the words in in different contexts now as we've discussed language models work by transforming raw text into Vector representations so really interesting thing we can do within Coda models is to pass in a sentence or a document and extract the internal Vector representation that the model has made of that sequence this is called a document embedding and just like with word embeddings is a way for us to be able to mathematically determine how similar or dissimilar documents are to each other so let's return to the example of our books let's
say we have four book descriptions a heartwarming journey of love and friendship an ambitious attorney gets entangled in a case which may prove to be more dangerous than anticipated one of the most meticulous accounts of the decline and fall of the Roman Empire and a provocative and well researched take on human relationships so we pass each of these through an encoder model we can convert them into their document embeddings as each of these descriptions are quite different the values in each of the dimensions are also quite different meaning each of these descriptions should be in
distinct parts of their embedding Vector space so how can we find a specific book well the first thing we can do is to store each of these vectors in a vector database with some sort of ID perhaps some sort of other metadata you can see that our vectors now have unique IDs assigned to them so let's say we want to find a book about the Roman Empire because yes I do think about that every day we would first convert this query into a document embedding using the same encoder model we used to create the embeddings
in the database we would then compare this Vector with those in the database calculating a similarity score between the vector and the query I'm using a distance metric called the cosine similarity here but there are quite a few different options you can use and what you have available will depend on the vector database that you choose so you can see from this comparison our third book Vector 103 ended up being the most similar to our query Vector however we don't want to just retrieve a vector that's not really that useful to us so this is
where the ID comes back in the ID can be used as a link to the original text of the query as well as other potential metad data so in the case of this example we can use the ID to retrieve the description and also the title and the author of the book which turns out to be Edward Gibbon's legendary history of the decline and fall of the Roman Empire so that turns out to be a very relevant recommendation indeed we might have spotted a problem right now we're doing linear search our search time is going
to increase linearly with the size of our database CU right now we're comparing our query with every single Vector so it's not terribly efficient so to to solve this there are many different algorithms you can use to reduce the search space and these all roughly work by grouping similar vectors in the database index meaning that at search time you're only going to be comparing your query Vector to the most similar vectors however this grouping is not always precise meaning that most of these algorithms are a trade-off between speed and accuracy seeking an idea about how
this works from this page from web8 which is a popular Vector database company or there are many such pages that you can read about online and of course you don't need to implement these algorithms yourself the advantage of using a vector database is that they build these into the indexing and with that big chunk of theory out of the way we are finally ready to get started building our semantic recommender so in order to build our Vector search we're going to be working with a framework called Lang chain and we briefly mentioned Lang chain when
we were installing our dependencies but I'm just going to dive a little bit more into what it is now so Lang chain is this super powerful framework that's available in Python and it allows you to do a whole bunch of stuff with large language models so we're going to be using it for Vector search you can of course extend that to make rag pipelines you can also do things like creating chatbots or creating agents so it's very powerful and it's very sort of state-ofthe-art so another thing that makes Lang chain really nice to work with
is you're not bound to a single large language model provider so as I mentioned when we were talking about installing the dependencies we're going to be working with an open AI model in this section but you can work with any of the proprietary vendors or almost any of them and you can also importantly work with open source models from hugging face so there's a lot of flexibility there and it allows you to do a lot of different experimentation and work with a whole range of different models so jumping back over to pie charm you can
see see from the dependencies that we're importing the methods we're importing kind of how the workflow is going to go with creating this Vector database so the first method that we're importing is the text loader and basically that's going to take the raw text the text of the book descriptions and kind of convert it into a format that Lang chain can work with then the character text splitter method is going to split that whole document containing all of the descriptions into meaningful chunks so in our case those chunks are just going to be individual descriptions
of each book but in other context you might be splitting a really long document and you might just arbitrarily split it off at say a th characters there are many many different ways of splitting documents and if you're interested in this topic definitely a rabbit hole you can go down the next step is converting those chunks into document embeddings and we're going to be using the open AI embeddings method to do that and do API calls to open AI to use their models to do that and then finally we need to store those in a
vector database and we're going to be using chroma for this this is a very popular open-source Vector database but there are a range of other databases you can use with Lang chain some of them proprietary so the next thing we need to do is set up our environment so that we can use that open AI model so we're basically going to be calling that model using API calls so what this means is that we need an API key so that we can connect to our own open AI account and be a able to charge to
our account to use that model and we're going to get into how to get the API keys and how to basically put credits on your open AI account so you can use those models in a little bit but for now let's talk about the nice clean way of passing that API key to your environment and my favorite way of doing that is using a package called M so what M requires you to do is first create a m file and you can see that here I just have it sitting in my room directory and all
I need to do is pass in my API Keys into this file then what I do is I import M and I import the load m method and then I just need to call that load m method and what it's going to do is look in the M file see those two keys that I have and it's going to write them to the environment that I'm using for this particular project so it's very clean and it's very simple now that we've done that let's go ahead and read in our nice cleaned books data set so
again we're going to be using pandas to do that so we import pandas and we're going to call it books again and we're going to import that books cleaned data set so we can see here it is just as we saw it at the end of the last section okay so now that we've loaded in our data and we've set up our environment we are ready to start building our Vector search so this is where we revisit that tag description that I created at the end of the last section and I promised you that I
was going to explain why I did this so when we create the vector search and when we query the database what we're going to get in return are the descriptions of the books because this is what's in the vector database but we don't want to give descriptions to the users of our recommender it doesn't really make sense what we want to give them are the titles and the authors of the books so so what we essentially want to be able to do is filter down the data frame that contains all the books to those that
were recommended based on our query to the vector database but doing this based on string match is really messy it's it's not a nice way of doing this filtering it's quite slow and it can be imprecise so instead what I've done is I've appended the ISBN as an identifier and what we can do is when we get back the recommend ations we can split off that ISBN from the front of the description and use that as the thing to filter so I'm going to talk you through how we do that but you're going to see
that it's quite clean and it's a much nicer way of doing this filtering than trying to do it on a full text match which is messy and slow okay so the text loader method in Lang chain it doesn't work with Pan's data frames so the first thing we need to do is save these tag descript and only the tag descriptions in a text file so we're going to create some code to do that we're going to use the 2 CSV method in pandas going to change that to a text file and we're going to make
sure that it's separated by new lines and we're also going to make sure that it doesn't have an index and it doesn't have a header so it's just going to be a file that contains just the text descriptions okay so we can have a look at that text document that we've just created and we can see that it's done exactly what we needed we have all of our nice descriptions separated neatly by new lines so great now we can start splitting them so the first thing we do is we load them using the text loader
method and you can see the syntax here is pretty straightforward and what we need to do is instantiate the text splitter so what we want to do is pass a couple of arguments here the first one is chunk overlap it's pretty easy to understand essentially what it's telling us is we don't want any of these chunks to have any overlap that's why we set it to zero because they are separate titles they they shouldn't overlap and we also set the separator as a new line so making that really clear but just going back to this
chunk size argument the reason we're setting that to zero is because it first tries to look for the closest separator to the index number indicated by the chunks and basically if this is more than one there's a chance that it may not split on a new line it will split on chunk size but so by setting it to zero we make sure that it prioritize splitting on the separator rather than trying to split on the chunk size so now that we've done this we've instantiated our text spitter we can apply it to those documents that
have been loaded in by the documents spitter and this takes a while and you can see that we get basically a warning every single one because we set the chunk size to zero but we'll just let that run we will just actually skip over that and now you can see that it's done so let's just go ahead and check that that worked correctly so what we're going to take is the first document um of those that have been split using the text splitter and we can see perfect this is the first description it's just the
description it's worked correctly so now we can go ahead and we can start building building our Vector database so kind of the final step actually we're pretty much done is that we need to in the same step create the document embeddings and store them in a vector database so what we're going to do is to use the chroma method we're going to assign that to a variable called DB books and we're going to use the from documents method in chroma and we're going to pass that two arguments we're going to pass it the documents that
we created the ones that have been split using the text splitter and we're going to tell it what embedding we want to use and we're going to use our open AI embeddings so what I'm going to do now is take a little diversion and explain to you how you can get access to an open AI API key and how you can also load up credits so that you can pay for this model so let's duck over to the openai website and have a look at that so in order to start working with open AI models
you first need to visit platform. open.com and if you don't have an account you will need to create one so once you have an account you can then go up to the top right hand corner and go to settings as you can see here and you will land on your profile page now there are two relevant sections for us here the first is the billing page so in order to use any of these open AI models you do need to pay for it but smaller models like the Ada embedding model that we're going to be
using in order to create our document embeddings or older models like GPT 3.5 turbo are actually pretty cheap to use so I chucked $10 on my account I think 6 months ago and you can see I've still got $440 left so it's not terribly expensive if you're not really hammering these models so you can see here on this billing page you can add credit like I said you can load up a small amount it will last you a while if you're not using the expensive models and you can also to manage your preferences to set
things like usage limits the other thing that we want to have a look at is how you get the API key and if you just navigate on the right hand side you can see that there is a section called API Keys all you need to do is click this green button it will generate a new API key and just make sure you save that straight in the M file so that you can use that and as you can see it's relatively straightforward to set up and once you've got this set up you got your API
key loaded in yourm file it's pretty easy and straightforward to work with these models so now we have everything in place to create our Vector database so if we just execute this cell you can see that this is going to run for a little while so I'm actually just going to skip ahead and you can see that it took about 24 seconds to create that database so now we're ready to start quering it we're at the fun part and you can see it actually wasn't that much work okay so for our first query let's try
for something kind of specific so let's say a book to teach children about nature so I'm going to save this to a query variable and then to get the recommendations what we're going to do is take our database the DB books and we're going to run this similarity search method over it we're going to pass in that query and this k equal 10 argument tells us how many results we want to get in return so let's go ahead and run that and let's see what it's returned so if we have a look at the top
results the first one is children will discover the exciting world of their own backyard in this introduction to familiar animals from cats and dogs to bugs and frogs and the second one is introduce your babies to birds cats dogs and babies not really sure why you need to introduce your baby to babies through a book about animals but anyway this is still a relevant recommendation so this is super cool and it's working really nicely recommendations really make sense but the problem is is as I said earlier this is just returning the descriptions to us and
we don't want to give recommendations of descriptions we want to give recommendations of book titles and authors and things like that so we obviously need some way of using these recommendations to filter the data frame containing all of our books and this is of course where those isbns come back in that I mentioned earlier so what I'm going to do is create a piece of panda code that is going to filter that books data frame just to the first result that was returned as our query so the one at the top there children will discover
the exciting world of their own backyard blah blah blah so let's have a closer look at this piece of code so we can see in this section here what we're doing is take the docs take all of the recommendations that were returned from the vector database extract from them the page content so just the text split that based on space and keep only the first element so the ISBN and then strip it so that there's no trailing white space and then convert the whole thing to an integer and the reason we need to do that
conversion to an integer is because the field in the data frame is also integer so they need to match in data type otherwise that matching won't work and then we pass all of that into a pandas conditional and that essentially tells pandas please give me only that book which has this ISBN so let's see how it works so if we run that it seems to have worked perfectly we have a book that makes sense Baby Einstein Neighborhood Animals and so this method has worked really cleanly and gives us a really quick and clean way of
looking up the books that are recommended through the descriptions so this is really nice but we've only done it for one recommendation from one query so in order to make our lives a bit easier let's bundle all of this functionality up into a function so we can do this for every query that we want to do and it's going to return all of the recommendations so let's call this function retrieve semantic recommendations and we're going to give it two arguments we're going to give it the query and we're going to give it the number of
recommendations we want the top K and it's going to return a panda data frame now the first thing we're going to pass in is uh the code to basically give us the recommendations so running that similarity search for the given query against the database then what we're going to do is create this blank list this is going to contain all of the isbns and what we're going to do is Loop over each of the recommendations that are returned and for each of them we're essentially going to do what we did before with extracting the ISBN
I've just made a small change in this function and the reason why is because I found that for some of the descriptions they were actually enclosed in quotation marks and this caused problems when I was trying to PA the ISBN I couldn't recognize it as an integer so basically in this case what I do is once we have the page content I strip off the quotation marks and then I split and keep the first element and convert that to an INT and what we have in return in this books list is a bunch of int
isbns and then what we do as the final step is we filter the books data set based on that so we keep all the IBN that match those in the books list so let's now have a look at how we go with our query a book to teach children about nature and these are the results that we get and they all look great you know these all totally make sense I actually see a r doll book that I read when I was a kid so that's actually quite nice and the Very Hungry Caterpillar as well
um so yeah this has worked very very well and this is our first building block for our recommender and I think you can see that even with the small amount of theory that we needed to cover this is not terribly complex to understand and it's very very powerful and gives you very flexible ways of working with text so now that we have our basic recommender let's start thinking about some things we could do to improve it or to refine it so have a think back to the first section when we were looking at our data
set and remember we had that categories field that was really really messy and you might remember that I said to put a pin in it that we were going to come back to it and tidy it up well this is what we're going to do in this section we're going to use llms to do a technique called text classification that's going to help us sort those categories into a much smaller number of groups once we have this smaller number of categories we can add this to our book recommender as a potential filter so text classification
as you might guess from the name is the branch of natural language processing which is concerned with trying to assign text to different discret groups so for example let's say we have this book description that we've seen before a heartwarming journey of love and friendship and we might for example want to sort it as either fiction or non-fiction so we could build a text classification model which is trained to do so and voila it predicts for us that this book is likely to be fiction we can repeat this with each of our book descriptions this
one about the ambitious attorney also gets classified as fiction Edward given Masterpiece is of course classified as non-fiction and then finally our book about relationships is also assigned to non-fiction Now text classification doesn't need to be done by llms of course this is an older problem that we were solving before llms but it does turn out that text classification is something that they're rather good at there are few different ways that llms can do text classification but the one we're going to use in this tutorial is called Z shot classification what this involves is taking
a pre-trained llm and without any further training no further work getting the model to assign text to a category what we do is we provide the model with a prompt like the one that you can see on the screen and the text that we want it to classify and we may optionally provide it with our categories that we want to classify as part of the prompt so in the case of our book descriptions we could take a pre-trained model that is good at doing doing zero shot classification and without any further work instructed to assign
the books to either fiction or non-fiction so we can see a simplified version of how an llm might do that here we have this prompt telling the model to do the classification and what the categories are and that's all the model needs to either classify it as fiction or nonfiction so how can models do this out of the box without us doing anything else well it seems to be something that sufficiently large llms able to do models that are 100 million parameters or more as we've discussed Transformer based models are good at understanding which words
are likely to be semantically related to one another due to seeing them in related context during training so in order to be able to do successful zero shot classification of our book descriptions the model will need to have seen enough text showing that certain types of topics are likely to be fiction or non-fiction in his training data so for example let's say that we're trying to train an encoda decoda model during training this model will see an enormous variety of texts from Wikipedia articles to news stories to Amazon reviews and somewhere in that training data
there is likely to be information about books with information about them such as their categories so in the training data the model might see a book that is a moving Tale Of Love Redemption and family which is further described as a fiction book after being exposed to enough similar examples the model will have a pretty good understanding that books with this sort of topic are fiction so when when we prompt it with the book that we want to classify the model will be able to compare the book's description with what it's already seen during training
and predict that that is most likely to be a fiction book so we can see that here a heartwarming journey of love and friendship is similar enough to things that it's seen in the past so it knows that this is likely to be a fiction so now that we understand the theory about how llms can do zero shot text classification let's jump into doing this for our book descriptions so as we saw in the last section when we were cleaning and screening the data we have way way too many categories for the books so if
we revisit this and we have a look at it again what we can see is that we very very quickly go from sizable categories things like fiction or juvenile fiction down to really small categories that get really specific things like self-help Computing Etc and the thing is is because we intend to use this for filtering we first we don't want too many but we also don't want each of these to be too small because what we're looking for is something that's going to facet the recommendations that are returned from the vector search and that's already
going to be a subset of the books so we don't want to you know divide up the categories into things that are two too small or too specific so if we limit this to categories that only have 50 books or more we can essentially see that we have a number of quite broad categories including fiction juvenile fiction and juvenile non-fiction so let's go ahead and have a closer look at the Juvenile fiction category we can see you know this looks pretty broad it looks like it really just contains you know fiction books for children so
it looks like it could be a potentially useful category and if we do the same thing with juvenile non-fiction we can see you know a number of books like graph books or educational books for children so this also could be a potentially useful category so it's the easiest thing that we can focus on when creating the book categories is by focusing on this fiction non-fiction distinction so basically what you can see is I pre-created a mapping of the top 12 book categories to either fiction or non-fiction and in addition I preserved juvenile fiction and juvenile
non-fiction as separate categories but I've renamed them as children's fiction and children's non-fiction so for example you can see that I've changed biography and autobiography to non-fiction I've Changed History to non-fiction but I've changed things like comics and graphic novels to fiction and drama to fiction so what this is going to give us is a nice chunk of the data which is either classified as fiction or non-fiction and that's going to give us a starter for classifying the rest of the books so if we have a look at how many of the books now have
known labels we can do this by checking which of the simple categories are not missing we can see that we have 3743 books so this is a pretty good basis and this is going to form the basis of the data set that we're going to check our llm based classifications on so at the beginning of this section we talked about how you can get llms to do a task called zero shot classification that is you can get them to sort pieces of text into particular categories without having being explicitly trained to do so so you
might be thinking well where can I get such a model where can I find a model they can do zero shot classification and the place we're going to be getting our model from today is hugging face so what is hugging face hugging face is a company that has a significant open- Source branch and this open-source branch is responsible for hosting and distributing all of the major open source llms as well as other types of AI models such as text to image voice models and multimodal models so we can see that we're here on the huggingface
./ models page and on this page you can see a whole variety of different models that you can use for different tasks and we go down to zero shot classification under natural language processing what we can see is a whole bunch of different models that we could potentially use for our zero shot classification task so you might be thinking okay well how can I use this model and happily hugging face also provides packages for us to interact with these models and the most powerful one for working with large language models is called Transformers so Transformers
gives us a whole bunch of functionality in Python for working with open source large language models that are hosted on hugging face and you'll see we're going to use it not only for our zero shot classification task but also for our sentiment analysis task down the line so after this tutorial you might want to learn more about working with large language models and the best course I've ever come across for this is hugging faces natural language processing course so if you visit their URL huggingface clearn NLP course you will be taken to to their homepage
and this course is such an amazing free resource it takes you through from the basics how to work with large language models what the different types of architecture mean which we have covered a bit in this course and different ways of working with large language models beyond what we cover in this tutorial so we've talked about the fact that hugging face has these zero shot classification models that we want to use for our task but pie charm gives us a really nice shortcut to being able to choose and access these models so I click in
a new cell in my Jupiter notebook and I can also do this if I'm using a python script what I will see is a context menu which will give me the option to pick insert hugging face model so once we've selected that we can see that we're presented with this tool window which gives us the same functionality that we have on the hugging face models page so if we go over on the left hand side you can see that we can filter Again by task type we select of course zero shot classification and then you
can see that we're presented with the same models that we saw on the hugging face models page we can change how they're sorted by likes by downloads created at or last Modified by the license type and we can also filter by tags so we're going to pick the most popular model the BART large mnli this is a very popular model for zero shot classification tasks and we can see that within this tool window we can also see the model card and that gives us a whole bunch of useful information about the model including how to
use it so if we go down to the use model button we can see that pycharm has inserted some boilerplate code for us to help us get started and we're going to use this as the basis of our classifier so having had a look at the model card it tells us that if we want to be able to use this model for classification for zero shot classification we need to set up the categories that we want the model to be able to classify into so I've decided to just limit this to fiction and non-fiction I
could have of course included the children's non-fiction and fiction but just to keep it simple I decided to just limit to the adult classes so what we do is we set this up as a list and we include that before we set up our model Pipeline and then one additional change that you can make to this boilerplate code is if your device has a GPU you can specify that you want the model to be able to use that so you can see that py charm is automatically completing device equals z you can use this argument
if you have Cuda I do not I have an apple machine which uses MPS so that is the argument that I will pass in so I'm just going to execute that cell and now that that's run our model is loaded in and ready to start making predictions before we start using it I just want to show you one more thing and that's the hugging face tool window in pie charm so if you click on the hugging Face logo over in the left hand side of pie charm you'll see this tool window pop up and what
you can see that it contains is every single one of the hugging face models that I've downloaded because what hugging face does is downloads encases models rather than you having to redownload them every time you want to use them now this is great but one problem that this can lead to is you can see see from this size column that the models can be quite big so it's a good idea to review these models periodically make sure that any models that you're not using you delete and that's something you can do right from that tool
window rather than having to go to the directory so let's now get to doing our zero shot classification and first things first let's have a look at the first of the known fiction examples that we have so we're just going to do this pend as filtering where symbol categories equals fiction take the description and the reason we add this reset index argument is because when we do a filtering obviously we're left with rows that have you know the index they had in the original data frame so by resetting the index we know that we're resetting
it so that it's now for the filter data frame and zero is going to be the first example so let's now run our classifier over that sequence and you can see that the code here is very very simple we just need to pass in the sequence that we want to classify and the categories we wanted to classify into and then once we've done that you can see it's quite fast and we get back the labels and we get back the scores so what this represents is the probability that that particular description that piece of text
belongs to each of those categories what we can see is that the probability that it is fiction is much much higher than non-fiction so just like the known label tells us the model has also predicted that this is a fiction book so in order to actually get the predicted label out of this output we need to do a bit of postprocessing so the first thing we're going to do is to take that array that contains the scores and we're going to run numpy's ug Max method over it and what that's going to yield is the
index of the highest probability now as you can see pie charm is telling me we have an error here it's because I haven't imported numpy so I'm going to go ahead and do that so now that we have that index what we can do is we can now take the array that contains the labels and take the index of the maximum probability and if we have a look at that it tells us correctly that the maximum probability the most likely label is fiction so let's now go ahead and bundle all of that up into a
function we'll call it generate predictions and it's basically just going to take in the sequence and it's going to take in the categories it's going to run those predictions that zero shot classification and then it's going to extract the maximum label so now we set things up so we can get this model to do zero shot classification over a description and tell us what the most likely label is fiction or non-fiction so the next thing we want to know is how good is this model at actually doing this task so to find this out what
we're going to do is take a sizable sample of both fiction and non-fiction books we're going to get the classifier to predict a label and then we're going to compare it to the known label so the first thing we're going to do is import tqdm because that's going to give us a way of knowing how long we've got left in our Loop because it does take a while to do these predictions over 600 examples and then what we're going to do is create blank lists for the actual categories the known categories and the predicted categories
the ones that the model comes up with then we set up our for loop with a range of 0 to 300 and what we do is we take examples where the books have the simple category fiction extract just the description and basically iterate through the first 300 of those and for each of them we generate the predicted category and we add that to our predicted cats list and then for our actual cats list we just add fiction then let's repeat the same thing for non-fiction so we change the filtering to non-fiction and we change the
actual categories to non-fiction and then we go ahead and run this and this is going to take a while so I'm just going to skip ahead and you'll see the results so now that that's finished let's go ahead and throw those two lists in a panda's data frame and we have these two columns actual categories and predictor categories and you can see that py charm did a very nice job of predicting what I wanted to type there and if we have a look at our data frame we can see actually from the first glance it
looks like it's done a pretty good job so the next step is to create a column where we compare these actual categories to the predictions and see if they match and let's go ahead and start creating that we're going to call it correct prediction and again you can see that py Chom has jumped ahead and autoc completed most of that I would prefer it to be 1 and zero rather than true and false it's basically the same thing but basically it will be one if the predictions lined up and it will be zero if it
didn't and then the final thing we can do is just check how many of those predictions were correct and again pie Jam's going ahead and completing that code and we can see that we got 78% correct so this is actually a pretty good rate for zero shot classification it does mean we're getting around 1 in five incorrect but for something that is predicting on categories it was not explicitly designed to predict on this is actually a pretty good rate so we can be happy with this and we can go ahead and use this model to
predict all of the missing categories okay so in order to predict the category label for all of the missing boards what we're going to do is we're first going to create two lists we're going to create a list for the isbns and we're going to create a list for the predictions so the reason we're doing this is because what we're about to do is subset the data frame and take only those where the category is missing or where the simple category is missing and we need the ISBN so that we can actually merge that back
into the full data frame later so let's now go ahead and create that subset of the full data frame so we use the filtering code to pick only those books where the simple category is missing is Na and we keep those two fields ispn and the description and again we're resetting the index because we want to be able to Loop through it and we need the index to be contiguous so here we set up another for Loop this time it's for the entire length of the missing cats data frame then what we do is we
take the description we pass it into our generate predictions function so we extract the most likely category and then what we do is we attach that category or we append it to the predicted cats list and then finally we attach the ISBN to the ISBN list or we appended and then finally we execute that and again this is going to take a while it's even more than the examples we did for checking the accuracy so I'm going to skip ahead until this is finished so again we're going to Chuck that into a data frame it
will have two columns the isbn13 and the predicted categories and you can see that data frame here so now that we have that data frame the last step is basically merging it into the original data frame and using these categories to replace those that are missing so first step is we're going to use a PD merge to merge those two data frames we're going to do this on isbn13 and we're going to do a left join so the reason for this is because these missing books these missing categories are a subset of the original data
frame and we want to be able to keep all the observations so having the books data frame on the left means that we can keep all the rows when we do this join this second thing we need to do is now that we've merged those data frames there's going to be a new column called predicted categories in the original data frame so we're going to use a numpy wear Clause where basically we specify that when the original simple categories column is missing please use the values from predictor categories the ones that we just predicted otherwise
use the original value and what that gives us is a mixture of the original known labels and our predicted categories so that's actually going to improve the overall accuracy of this category because only a subset of them are predicted and then of course we can finish up by Tiding up and dropping that predicted categories column because we don't need it anymore so let's now double check that everything has worked we'll have a look at the data frame let's scroll across to this column we can see that everything looks okay and when we have a look
at our column statistics we can see that we do not have any missing and we have four distinct categories so everything has worked exactly as we wanted so doing this zero shot classification possibly got you thinking are there other things I could use it for are there other categories I could predict and of course sky the limit if the model was trained on data that actually supports these associations then of course you can absolutely use it for this so one potential candidate for us is breaking down that fiction category we can see that it's 54%
of all of our books so maybe we want to narrow it down to specific fiction types however a challenge that we have is having insufficient labeled data to actually test how good these predictions are so you saw that how with the fiction and non-fiction categories we had a lot of labeled examples so we were able to easily see how good our predictions were but when it comes to specific categories especially those within fiction we really don't have a lot of examples in the data so let's have a look at this in our books data set
we're going to take that raw categories column and going to filter it down to those cases where there's an exact match for the following terms so we're going to use romance science fiction and sci-fi as an alternative fantasy horror mystery thriller comedy crime and historical and when we run this you can see that we get a whole 16 observations so essentially we really don't have enough labeled data in order to be able to tell how well our classifier will go with more specific categories so we could still do it and we could still just assume
that the model will do a reasonably good job but it is a little bit risky and this is sort of a lesson we need to keep in mind when we're using llms they're not really magic they're not really different from any other type of machine learning model we still need to apply the same checks and the same sort of uh processes with working with them as we would with any other machine learning model so that's it for the end of this section we have learned a lot about how we can use llms for zero shot
classification and the final thing we're going to do is of course save our nice new data set to file so we can use it in the next section so far we've used llms to find the most similar books to each other and also to classify those books now we're going to use llms to do something called sentiment analysis that's going to help us determine the emotional tone of those books I also think it's a really nice way of showing that the type of data you use can open up the possibilities for different types of features
in your data science products because we are working with Text data we have the option of extracting sentiment whereas we're working with a more traditional data set for recommenders we would wouldn't really have this information so once we've extracted this information we can include it as part of our recommender to allow our users to filter the books based on their tone so perhaps someone is after an exciting read so they might choose something that's suspenseful or maybe they just want to be cheered up so they might choose a book that's joyful so including this information
will allow that additional degree of control for our users so in this section we're going to revisit text classification but we're going to be applying a different technique using large language models so first things first what are we doing well we're going to be classifying our text into seven different discreet emotion categories we have anger disgust fear Joy sadness surprise and of course a neutral category because sometimes the text will not have any emotional content so using these categories we can get an llm to classify the dominant emotion expressed in our book descriptions so for
example for this description our old favorite our heartwarming journey of love and friendship the llm is likely predict that the most likely emotion is Joy now of course we could actually do this emotion classification using zero shot classification as long as the data set that the model was originally trained on contains sufficient association between emotional tone and book descriptions but this time we're actually going to be doing something bit different we're going to be using a technique called fine tuning in order to get an llm that can do em motion classifications so to understand how
fine tuning works and how it's going to give us an llm that can classify emotions let's revisit our Roberta model which we first saw when we were talking about document embeddings so this Roberta model is made up of a sequence of layers we have our word embedding layers we have our encoder layers and then we have those final layers which allow the model to do that mask word prediction task that it was initially trained to do with fine-tuning we can throw away those last layers that we used to do that mass word prediction task and
we can replace it with layers that are instead used to predict motion categories what we then do is we take a small labeled data set and this data set contains text and their Associated emotion and we can further train the model using this so what you can see is that as part of setting up the model for fine tuning we haven't touched those lovely encoder layers they are still there we didn't reset them or delete them meaning that the model has preserved all of that rich information about language that it learned from its original training
what we can use is that information and then the information contained in the emotion data set to get the model to learn the weights in its new Final layer meaning that we end up with an llm that is specifically designed to do an emotion classification task now we're not going to be fine-tuning a model ourselves in this video it's quite complex to do and it's really a whole Topic in its own right to do properly however if you want to learn more about how to do this for yourself in case you want to find Junior
own model I'm going to as always direct you to the hugging phase natural language processing course where they show you in detail in the third section how to do this for yourself instead what we're going to be doing today is use a model from hugging face Hub that someone else has fine-tuned and up loaded so let's get started so as per usual I've gone ahead and created a new Jupiter notebook and I've loaded in our new data set that one that contains all of those predicted categories so now that we've done that let's get to
work to finding a fine-tune model that we can use for a motion classification so just like in the last section we're going to be using an open source model from hugging face so we're going to right click in a new Jupiter cell and we're going to select insert hugging face model so as we discussed at the beginning of this section we're going to be treating sentiment analysis as a text classification problem so that means we select text classification from the left hand side of our model selection tool window and then we can search for emotion
in the search bar in order to narrow it down to emotion models so let's have a look at the most liked model the most popular model in this category and what we can see is this is a fine-tuning of a Roberta model like we talked about at the beginning of this section but this been fine-tuned to predict many many many different types of emotions this is probably far more than we really need for our purposes so let's have a look at the next model it's also a fine-tuning of a Roberta model and what we can
see is this time it's been fine-tuned for only emman six basic emotions so we've got anger disgust fear Joy sadness and surprise and we talked about those at the beginning of this section and it also has a neutral class so having a bit of a look through the model card for this what we can see is just like with our zero shot classification model we have instructions on how to use it so this time let's actually copy this and we're going to use this as the basis of how to start using this model so because
someone fine-tuned this model to do this specific em motion classification task there are likely evaluation metrics we can look at so how well did this model perform at doing this classification during its training so I found this page from datal loop. a and it gives us a bunch of information about this model it's quite a well-known model but if we scroll down to the accuracy section you can see that it tells us that it had an evaluation accuracy of 66% and this seems a little bit low but it is actually significantly higher than the random
chance Baseline of 14% that was achieved by taking 100% and dividing it across the seven different categories so I think we can be happy with this model we can feel fairly confident in using it and we can go ahead and use it to measure the emotional content in our descriptions so let's first test out our Emotion classifier by literally running the code that we copied from the model card so we have this little example I love this which is the sequence to classify and if we run this we can see that we get two warnings
the first is to tell us that we are not using gpus when we could be and the second is to tell us that this return all scores argument that was in the documentation is now deprecated so let's go ahead and update our function so that we modify these arguments so the first thing that we're going to do is change this return all scores argument to top k equals none as suggested and the second is like we did last time we're going to add device equals MPS so we get GPU utilization so we've loaded in our
emotion classification model and we've seen how we can get it to predict the emotion of different pieces of text so we now need to decide which level of the description we're going to apply the sentiment analysis over and we've got two options here we can either get the sentiment classifier to try to predict the overall emotion for the whole description or we can break it down into individual sentences and try to predict the sentiment of each of these so let's first look at this first description we have and let's just start having a look at
the potential emotional tone of each of the sentences so we start with a novel that readers and critics have been eagerly anticipating for over a decade Gilead is an astonishingly imagined story of remarkable lives well this feels kind of surprising right and then we have another sentence haunted by his grandfather's presence John tells the rift between his grandfather and his father the Elder an angry Visionary who fought for the Abolitionist cause and his son an Ardent pacifist that almost feels fearful so you can see that we have a bit of a mixture and potentially running
a sentiment analyzer to get one sentiment or one emotional prediction from this whole description might be losing some information but let's have a closer look at this let's test it out so let's first run the sentiment analyzer over the entire description and what we can see is the prediction we get overall is that it's 65% likely to be fearful now I don't really get that impression when I look at this whole book description like looking back up a little bit we can see sen is like told in John A's joyous rambling voice that finds Beauty
humor and Truth in the smallest of life's details that feels kind of joyous it feels like this book has a mixture of different themes and we want to be able to capture those so what we're going to do instead is split this description down into its individual sentences and classify on that basis and very nicely this classifier actually allows us to classify multiple sentences at the same time so we can just pass in pretty much the same code but instead with a split argument that allows us to split that on the basis of full stops
and if we look through this this is way better we have a lot more variants so we can see just like I suspected that first sentence is surprising and if we look a bit further we've got high scores for other sentences we've got one that is fearful and we've got another one that is sad and we've got another one that is joyous so we can see that we're getting a lot more variety here and this is doing a much better job at getting at the true emotional tone of these descriptions so let's just compare a
couple of these predictions to the sentence to see if you know it's actually giving the right predictions as well based on eyeballing so again let's just take that first sentence again and let's have a look at the classification and yes again it's mostly classified it as surprising as we said before so let's have a look at another sentence let's have a look at the fourth sentence and the predictions that it's given for this is that it's mostly fearful and this makes sense haunted by his grandfather's presence you know he's talking about a conflict he's talking
about his grandfather being angry so this all seems to make sense and it checks out that this classifier is also doing a good job so this idea does complicate things for us somewhat because now what we've done is introduced multiple emotions that can be associated with the same book so how can we make sense of this well my idea is what we can do is for each book have a separate column for each of the seven emotion classes and instead of a assigning a category of it is this or it isn't this what we can
do is take the highest probability from across the whole description for that particular sentiment so for example if Joy is very high in one sentence but it's low across all the others we'll just take that higher score for Joy for that book description and so on for all of the other seven or other six so what that means we need to do is we need to process this output of of the predictor and kind of amalgamate it or Cate it in such a way that it only gives us one maximum score for each of these
labels and you can see with the way this is formatted we're going to have quite a lot of processing to do so the very first problem we have is that this output is ordered by the score for each of the sentences so you can see that we have a different order of labels for every single one of the sent sentences so the first thing we can do is actually sort these by score instead and what it means is that for each of the sentences we will have the exact same order of each of the seven
emotion categories so let's create some code to efficiently extract the maximum emotion probability for each emotion for each description so first thing we're going to do is import numpy and then what we're going to create is this list called emotion labels and this is basically going to be the key in our dictionary so we're later going to turn that into The Columns of a panda data frame we also create an empty list for holding the isbns the reason we're doing this is because later on we're going to create this data frame as I said and
we want to merge it back in with the full data frame so again we're going to use isbn13 as the key and then finally we create this emotion score dictionary comprehension what this is going to contain is basically all of the scores for every single description for each of these labels anger disgust fear so let's now create this function calculate max em motion scores in order to extract the maximum motion scores for each description so the first thing we do is create another another dictionary comprehension this is designed to hold all of the predictions for
a particular description so we're not talking about every description just talking about a single description right now then what we do is we Loop over each of the sentences so each of the sentences return by prediction we sort it like we saw before so that all of the keys all of the emotions are in the same order and then what we do is we Loop over that and per each of the emotions we extract the score and we append it using the correct label then what we do is we append this to the uh dictionary
comprehension and then we take the maximum score for each of those emotions so what we now have for each description is a dictionary containing the maximum probability for each of the different emotion labels so we now need to apply this function to each of the books so let's just test it out first we'll just do the first 10 books and the first thing we do is of this for Loop is we take the ISBN 13 for that book and we append it to that ISBN list then what we do is we take the description we
split it into individual sentences and save that to the sentences variable and we pass that variable into the emotions classifier then what we do is we pass those predictions generated by the classifier into our calculate max em motion scores function and then we take the resulting dictionary that's returned by that function and we append it to to that emotion scores dictionary so basically by doing that we should have a dictionary that can serve as the basis of our data frame containing different columns with the maximum probabilities for each book and if we run that for
Loop and then we have a look at the results we can see that it seems to have worked like all of these probabilities seem to make sense um if we scroll all the way through we can actually see that Joy prediction for the first book that we already know about and we know that that's the correct number cuz we've seen that before so now that we know this works let's go ahead and apply it to all of the books so we're just going to go ahead and copy and paste the code for the for loop
from above and the first change we're going to make is by including tqdm as part of the for Loop so again we have a progress bar and py charm is throwing an error so it's telling us we have not imported tqdm so let's go ahead and do that and of course we modify the for Loop so that is now for the length of the entire book's data frame now of course we are starting from scratch with this Loop so we don't want the results from the previous run to be saved to the ISBN or the
emotion scores variables so let's just go ahead and copy and paste the three variables from above down here so we've got emotion labels we've got ISBN and we've got emotion scores and they're basically going to be reinstantiate here and pretty much this is it we are good to go so let's just kick that off and again this is going to take quite some time to run this over more than 5,000 observations so I'm just going to skip ahead and we can now have a look at the results and with that done let's now pass the
results of this dictionary into a panda's data frame and we don't want the index to be ISBN but what we are actually going to do is create a separate colum for ISBN and assign the ISBN list to that so if we have a look at that data frame we see we have exactly what we wanted got a separate column for each of the emotions and we can see that each of those columns contains the maximum probability for that description now of course the final thing that we need to do is to merge this back into
the book's data frame so again we're going to use Panda's merge we have the books we have the emotions data frame and we can just merge them both on isbm 13 and so let's now have a look at the resulting data frame and if we scroll across we can see all of our emotions columns and if we actually want to have a look at the distribution of those emotions we can again use the column statistics function and what we can see is we actually have a pretty good distribution of most of the emotions and in
particular the sadness emotion has quite a lot of pretty high probabilities so this indicates to us having a look at this that we do have a relatively good range even though we do have you know some inflation at the lower areas and this is going to give us a pretty good variable to use for sorting the different books when it comes to making the recommender and then as always the final stage is to save our beautiful new data frame to file so we can use it in our final step which is to present all of
this in a dashboard so we're going to go ahead and do that and I hope this has been an interesting overview of how large language models can do sentiment analysis and giving you some ideas on how you might be able to use this in some of your projects so now we finished developing all of the different components for our book recommender we have our Vector database that allows us to find the most similar books to a query we use text classification to sort the books into fiction or non-fiction meaning our users can also filter books
based on this category and we found out how likely each book description is to have a certain emotional tone however all we have right now is a bunch of code and a data set admittedly a very nice data set but still it's just a data set it's not the most userfriendly interface as such the last thing that we're going to cover is how we can bring all of this together and present it in a dashboard that people can use to get their book recommendations so in order to build this dashboard we have moved away from
Jupiter notebooks and we're now working with a python script and if you want to create a python script in pycharm it's the exact same process c as creating a jupyter notebook you just need to pick python script instead of Jupiter notebook so to get us started I've already gone ahead and imported all of our dependencies these should mostly look familiar because we've already covered them in the previous section so we have pandas numpy andm we have our Lang chain packages and the only new one we have here is gradio and I'm going to cover that
in a second we've already added our load. M function in order to load our open AI API Keys into the background and I've gone ahead and read in our very latest books data frame the one that contains all of those emotions that we just added so let's now talk about gradio so gradio is an open-source python package that allows you to build dashboards specifically designed to Showcase machine learning models so it's really tailored nicely to allow you to use things like machine learning models or llms under the hood and if you go to gradio doapp
you can explore a lot of the very very powerful functionality that it has and we'll see a touch of it in this you can see that it can be quite flexible in terms of the things you can show um but it gives you a really cool way of demonstrating the things that you're building with code to people who may not necessarily want to use code in order to use your models or whatever else you're creating in Python so first things first we're actually going to be using the thumbnail as part of our dashboard and the
thumbnail is basically a little preview of the book's front cover which is going to give us a nice sort of visual element to our dashboard so the books data set that we use provides a URL which links to Google books but what that provides Us by default is book covers that are all kind of random different sizes so what we actually want is that Google Books returns to us the largest possible size that it has available so that we get a better resolution so we can add this little argument to the end of the URL
just depending that to the string and that's going to give us back much better resolution book covers the next problem we have is that a number of books don't have covers so if we try to render them we're actually going to get an error so what I've done is I've gone ahead and I've created this interim cover I will provide this as part of the repo with all the code for this project but you can use whatever you want and basically what we now do is we modify the code again using NP Weare and what
we're going to do is replace those cases where we have a missing cover so where large thumbnail is na a with this interim cover and otherwise we'll use the link that's provided and that's it so we're now ready to use the thumbnails so we can get on with building buing the next parts of our dashboard so the next thing we need to do is add that code that we created in the second section in order to build our Vector do base and this is so we can of course do the core functionality of our recommender
which is semantic recommendations so just to remind you what this code does in this first line what we're doing is reading those tag descriptions into the text loader then we're instantiating a character text splitter which has as a separator the new line then we're applying that to each of the documents so what we end up with are document chunks that are individual book descriptions and then what we do is we convert those into document embeddings using the open a Ai embeddings and we store those in the chroma Vector database so now we're going to create
a function that's going to retrieve those semantic recommendations from our books data set and it's also going to apply filtering based on category and sorting based on tone so let's go ahead and start creating this let's call it retrieve semantic recommendations and it's going to have as its arguments the query it's going to have the category and we can set none as a default and also the tone which again can be none and then we're going to have two top k categories we're going to initially retrieve 50 recommendations because we're going to apply some filtering
and then what we're going to have have is a final top K which is going to be lived to 16 because 16 as you will see looks quite nice for display on our dashboard and then of course the result that it's going to return is a panda's data frame so to start this function we're going to again repeat some code that we saw all the way back in the second section the first thing that we're going to do is get our recommendations from the books Vector database the DB books and we're going to limit that
to the initial top K those top 50 results it's going to be based on a query that's going to be input by our user then what we're going to do is get back those isbns of those recommendations by splitting them off the front of the descriptions and then what we're going to do is limit our books data frame to just those that match the isbns of those books recommended from the vector database and then what we're going to do is start applying some filtering based on category so basically we're going to have a drop down
on our dashboard and it can either read all or it can read one of the four simple categories fiction non-fiction children's fiction and children's non-fiction so basically want the argument to be is that if someone has picked anything other than the default all we want to filter the books Rex data frame down to only those books that match that category and otherwise we just just want to return all the recommendations and then you can see what we've done is we've limited those filtered recommendations down to the final top K and then finally the way we're
going to use the emotions category I think I mentioned this earlier is we're going to sort based on the probabilities rather than doing any sort of classification or filtering so say if someone picks happy as a label that's going to match to Joy then what we will do is sort those recommend ations based on the highest probability of them being joyful books so we're going to do this for five of the emotions we're going to do it for Joy surprise anger fear and sadness and they're going to correspond to a drop- down menu with labels
happy surprising angry suspenseful and sad so I decided to leave out disgust because I can't imagine anyone really wants to read books that are likely to disgust them and I also left out neutral because neutral is kind of implied by all so you know you're not really looking for anything specific so let's go ahead and create the code for that so what you can see again it's just a simple um give else Clause so if tone equals happy then sort these books based on Joy and make sure that it is descending and then do the
same for the others and then to end this function we just return the data frame with the book recommendations so the next thing we need to do is to create a function that specifies what we want to display on the gradio dashboard so we're going to call this recommend books and it's going to take three arguments it's going to take the user query it's going to take the chosen category and it's going to take the selected tone and what we're going to do is first get our recommendations data frame by calling that function that we
just created retrieve semantic recommendations and we're going to pass in those three arguments we then create this empty results list and what we do is we then uh loop over every single one of these recommendations that have been passed back from our previous function so the first thing we're going to deal with is the book description so this is just going to be the description field of course but the thing is is we're going to be using this on a dashboard that has limited space so we don't necessarily want to show the full description so
instead what we're going to do is we're going to split that description into its separate words and if the description has more than 30 words what we're going to do is cut it off and just make it continue with a trailing ellipses so let's now think about how we want the author's list to be displayed so in this data set if a book has more than one author they are combined using a semicolon so first things first we're going to take the string containing the authors and split it on semicolon so let's now think about
the different conditions we might have a book that has two authors so let's create an F string that separates these two authors using and so we have the first author in the first placeholder and the second author in the second placeholder or we might have a book where we have more than two authors so in this case we create an F string where all of the authors except for the last author are separated by a comma and then the last author is added on using an and or else we just have a book with one
author in which case we just use the author and you can see I've just made a small mistake here in the F string for two or more authors I need to use single quotation marks rather than double quotation marks so I'll just pop up and change that so the way that we're going to display all this information about the book is as a caption that's sort of appended to the bottom of the book thumbnail image so let's now all combine this into a caption string again using an F string we'll first have the title by
authors and then colon we have that truncated description and then finally we have that results empty list that we created earlier so what we appended is a topple containing the thumbnail and the caption and we're going to do that obviously for every single book looping over it using that itose functionality okay so we are now ready to finally start creating the dashboard and you can see actually there really wasn't that much code we needed to write to get to this point we could have actually been a little bit less fussy about how we presented the
caption but you'll see it will look very nice so you'll see it's worth the effort so the first thing we do is we create two lists the first is our list containing all of our categories plus that all category that I talked about earlier and then we do a similar thing for tones so if someone doesn't want a particular emotional tone we have all as a standin for neutral so we start off our gradio dashboard with the following code and you might have noticed as I'm writing it I'm including the argument theme within the blocks
method so gradio actually allows you to customize dashboards to an extent with a bunch of different themes so before we go any further let's quickly go and have a look at what they are so we can see that we are on the theming guide page within the gradio documentation and if we scroll down a bit we can see that these are all the themes that are available so they range from themes that are very simple up to themes that are a bit more bright and a bit more colorful like the Citrus theme so I specifically
chose the glass theme because when I messed around with the different themes this really felt like the most you know the most dignified something you might want for a book recommender but depending on your purpose you might want something very simple very soft very bright so you can just play around with these so continuing on with our dashboard we can see that the first thing we include is this markdown element and this is going to be the title of our dashboard so this will appear at the top and it'll tell people what our dashboard is
about so we will call it semantic book recommender so now we're going to create the part of our dashboard that our users will be interacting with so this is going to first contain our user query and we'll represent this as a text box we're going to give it the description to please enter a description of a book and we can actually add a placeholder which is really cool to give them an idea of what sort of things they can actually query so let's say we put for example a story about forgiveness then what we're going
to do is we're going to add dropdowns for both category and tone so let's first have a look at the code for the category dropdown so we use this dropdown method and what we do is we assign the choices by assigning that list with all the categories and again we can add a label and we can make the default value all and so we do the exact same thing with the tone drop down and then finally we need to add a button so people can get their recommendations we use the button method to do that
and again we can label that so what we're now going to be doing is adding the functionality to display the recommendations so again we use that markdown method and we give it the subtitle recommendations and we're going to displaying it as a gallery so this is going to be a really nice way to Showcase all of those nice thumbnails of the books that we prepared and what you might have noticed is I've made it size of column 8 with two rows this is why we have a maximum of 16 recommendations that are returned after filtering
and then finally we need to tell gradio what to do when users click that submit button so what we tell gradio to do is to execute the function recommend books take as the inputs the user query the category dropdown and the tone dropdown and to Output whatever comes out of that recommend books function and then finally of course we create our main method and from there we can execute the script so as you can see this is rebuilding the vector database from scratch we can of course just save this Vector database cuz we don't really
need to recreate it each time and that means that it's going to be a lot faster for our dashboard to start and then finally our dashboard is launched so let's go ahead and have a look so here's our gradio dashboard so here are all the elements that I described we were creating when we were coding it up we can see our text box where our user can enter their query with that placeholder that we designed we can see our two dropdowns with category and emotional tone so let's go ahead and do our first query and
let's make it pretty broad let's say a book about World War I so when we click find recommendations we get back that really nice Gallery with all of the different thumbnails and you can see the cover not found popping up a couple of times and if we go ahead and click on the first of the books we can see that c that we created being displayed down the bottom so you can see why I needed to truncate the description there's not very much space and if we just go clicking through down the bottom we can
actually scroll through the gallery this way or scroll through it on the main screen so let's now try our category filter and let's filter this down to fiction books and you can see that this has eliminated a lot of books that were about World War I but we're not actually fiction stories so let's now try sorting these books based on their emotional tone and well we're talking about stories about World War I so they're probably going to be sad so let's try sorting on that and basically what we can see is the top recommended one
is this Virginia Wolf book so this is what our recommender has come up with but searching for books about World War I is pretty straightforward so let's put our semantic recommender to the test and let's try something a little more nuanced so let's say a story about a troubled family set across many generations so looking at this second result we can see you know pretty good so the description is a young Widow raising two boys Sarah Laden is struggling to keep her family together when a shocking Revelation rips apart the family of her closest friend
you know looks pretty relevant this one here also looks pretty good Bry Ashley knows that her family's Grand estate is both hell and Paradise once elegant and beautiful yet myed in debt and shrouded in shadow looks pretty troubled to me and deals with this sort of generational family issues and actually if we go ahead and we sort this list of recommendations based on how suspenseful they are this one actually comes up at the top so that seems pretty consistent like this book seemed like it was probably going to be like good mystery as well as
a family generational drama and this brings us to the end of the tutorial thank you so much for completing it with me and I hope you've enjoyed it so let's end with a quick recap in the course of this tutorial we've covered a lot of different topics in modern natural language processing the core of this tutorial was of course large language models and I hope you've ended this tutorial with an understanding of how these important models work as well as how flexible their applications can be for solving natural language problems we've also seen the current
state of the development ecosystem around llms and we've seen how getting access to and choosing between these models is getting easier and easier we saw how proprietary providers like open AI have their own easyto usee apis to let you access their models and these can be relatively inexpensive depending on the model you use we also saw how hugging face Hub makes it easy to find and choose between open-source large language models and how py charms Integrations with hugging face make make it even easier to do that within your development environment finally userfriendly python packages such
as Lang chain and Transformers make it easy to do even relatively complicated tasks like building a vector database with really just a few lines of code so just before we wrap up there are a few things that I wanted to remind you about that I've mentioned throughout this tutorial the first is if you want to get that three Monon free license for py Chon professional make sure you grab the code from the description below if you want to ask me any questions or contact me about this tutorial you can also find my social media links
in the description as well and then finally I have shared some further resources in the description if you want to follow up and learn more about this topic after this tutorial so thank you again so much for joining me and I hope you had as much fun as I did I hope you're feeling confident and excited about working with llms after this tutorial and I also hope that you're feeling inspired to learn more about natural language Pro processing it is a very exciting area of data science and there's a whole lot more that obviously I
couldn't cover in this tutorial which is waiting for you to learn about please keep in touch I would love to know what you end up building
Related Videos

7:21
A Conversation with Dr. Nazariy Mykhaylyuk
NYU Dentistry - Advanced Clinical Fellowships
28 views

27:12
Authorities reveal cause of death for acto...
ABC 33/40
1,681,247 views

2:11:12
How I use LLMs
Andrej Karpathy
728,534 views

3:32:55
OpenAI Assistants API – Course for Beginners
freeCodeCamp.org
655,073 views

46:47
Unraveling the Figma Enigma
Olshania - Mr. Olshan's YouTube Channel for Learning, Discovery, and Horror
2 views

10:03
Microsoft’s New AI "MAI" Will Replace Open...
AI Revolution
4,282 views

28:16
China Releases WORLD'S FIRST AUTONOMOUS AI...
Wes Roth
62,498 views
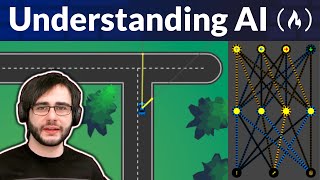
3:44:18
Understanding AI from Scratch – Neural Net...
freeCodeCamp.org
528,479 views

18:16
Experts show why WW3 over AI is nearly ine...
Digital Engine
26,591 views

8:20
Tesla Collapsing, HUMILIATED Musk Struggles
Rebel HQ
438,268 views

21:27
AI Agents Fundamentals In 21 Minutes
Tina Huang
466,230 views

16:53
Even US STUNNED As UK Plans to Send EUROFI...
The Military Show
377,507 views

31:12
Singapore's Top Diplomat Reveals TRUTH Abo...
Cyrus Janssen
250,119 views

33:08
How to Start Coding | Programming for Begi...
Intellipaat
10,000,220 views
33:37
Something Strange Happens When You Trust Q...
Veritasium
5,004,318 views

5:49
Claude 3.7 goes hard for programmers…
Fireship
1,716,978 views

2:11:40
Dopamine Expert: Doing This Once A Day Fix...
The Diary Of A CEO
3,315,706 views

24:27
How to Build Effective AI Agents (without ...
Dave Ebbelaar
351,886 views

44:38
Jon Stewart on Trump’s Zelenskyy Smackdown...
The Daily Show
399,887 views

1:09:56
Professor Brian Cox speaks at Space Committee
Sky News
53,795 views