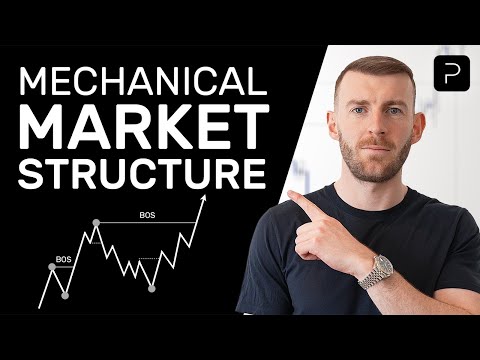
How To Understand Market Structure | FOREX | SMC (Part 1)
855.89k views9433 WordsCopy TextShare
Matt Donlevey - Photon Trading
Boost your win rate, skyrocket your reward:risk ratio, and get extreme clarity by following this me...
Video Transcript:
youtube how are we doing right let's not muck around let's just get straight into it so in this video um i kind of want to talk about something that has probably made one of the yeah probably one of the biggest sort of differences to my own performance but also really just kind of simplifying and making my trading strategy as mechanical as possible and as you probably guessed by by the title of this video that is having a mechanical system for mapping market structure now no matter what strategy you trade whether it's you know smart money
concepts uh supply and demand uh emas fibonaccis harmonic patterns all that right um yeah no matter what strategy you trade if you apply the concepts that we're going to go through in this video and potentially the next few videos i can pretty much guarantee you three things one you are definitely going to boost your strike rate because if you're mapping your kind of market structure the right way and consistently you're going to find yourself on the rights of the market a hell of a lot more times than you're not you're going to skyrocket your average
reward to risk ratio pretty much because you're going to be able to manage your trades a hell of a lot more effectively and that's kind of for two reasons so one well you're gonna know you know where to target but two you're gonna be able to hold those trades with just a lot more confidence to those overall targets as well and then kind of the third outcome um i think you'll really get from this it's just having that extreme clarity and kind of yeah just confidence when you're looking at the charts because when you map
it this way you're gonna know exactly you know what the market is doing you know and what you're looking for straight away you know as soon as i hop on the charts every single morning the market structure is the first thing i'm looking at you know i follow that mechanical system for mapping it um and it just yeah it just makes everything a lot more easier and simple more simple and everything just kind of follows on from there now kind of originally planned to do this as like uh you know like a six-part mini-series or
something like 10-15 minutes each long but if you can't concentrate for sort of 30 for 40 minutes you know probably not going to make it bro as the crypto fanboys love to say so what we're kind of going to do is we're going to wrestle through a little bit of theory first uh and then we're going to hop on the charts and obviously apply that theory to the price action and get a bit more practical so i just want to kick things off first with this uh weightlifting allergy that i came up with that i
kind of like um and yeah if you haven't sort of well if you don't recognize this movement it's essentially an olympic weightlifting movement called the clean and jerk now when you see an athlete perform this it looks like a reasonably well not simple but quite a you know a fluid clean movement where they're essentially just lifting the floor the weight off the floor and getting it above their head right um now i think this is quite a good analogy for training because when someone is kind of at that pro level and they have simplified their
strategy into something that makes sense to them when you see them perform that right it just looks like they're clicking buy and sell and it looks relatively effortless but actually you know it came from understanding or having quite a complex understanding of of the complex parts that goes into that one fluid movement right knowing how to deadlift to clean the front squat on the overhead press everyone wants to just jump into the fancy stuff you know doing the front squat or getting that weight above above their head but if you haven't laid that solid foundation
you know doing the deadlift just doing the boring stuff right just picking the weight off the floor none of that other stuff that follows on from then um you know is gonna gonna work or you might be able to do it initially when you've got focal weight on the bar but as soon as you start to put serious weight on there if you haven't nailed the deadlift if you haven't absolutely nailed your technique what's going to happen well you're either not going to move it or you're going to pull your back out right so i
think this is a pretty good analogy for trading that if you know a market structure and if you really have a solid way of doing that that you can consistently map it everything within your business will follow from there on your trading business right um supply demand liquidity whatever confluence you're using your strategy entries and management come last first you need to build that solid foundation so that's kind of my little rant uh for for kind of trying to drill home the importance of um yeah of just why i think you know nearly market structure
is so important so i'm gonna hop on the charts now just to go through a little bit more theory um probably should have warned you yes my charts are white so if you are sitting in a dark room then yeah apologies to your retinas that have probably just been burnt but um yeah so some of you are probably rolling your eyes at this point yes this is very basic bear with me just for five minutes i promise you you will learn something hopefully learn something new um in the next few minutes or so so yeah
like i'm saying we'll wrap up through this theory pretty quickly and then we will hop on the charts and do a walkthrough on price action now hopefully if i figured out how to do this there should be a pdf i guess scrolling on the screen maybe um i'm basically yeah i'm going to put this together into pdf all of the charts that we're going to go through and you guys will be able to download that for free there should be a link in the description box somewhere below if i figured out how to do that
so yeah we'll go through this pretty quickly and then we'll hop on the charts so basic market structure kind of what you learned day one right baby pips um what is a bullish market well a bullish market is very simply defined by price making a series of higher highs and higher lows right so bullish order flow you're going to keep seeing price making those higher lows each lower stay in attack and intact and it keeps printing a higher low now every time price takes out a high to form that higher high we get what is
called a break of structure so kind of just annotated that as boss right so price moves up it forms a higher high it pulls back to form a higher low it then breaks that high so we get a break of structure that high to then form that higher high then we pull back to form a higher low right pretty basic stuff now that's kind of if the market moved in a nice utopian sort of fashion but obviously in reality it's a little bit more complex than that so this is a bit more of a realistic
example where when price goes on it breaks structure to form that higher high it can have a bit more of a complex uh movement so the way or i guess the most important thing probably out of this entire video would be nailing where your swing highs and your swing lows are in structure if you can get that right everything else pretty much will follow from there so let's say we're in the live market we see this high get taken we get a break of structure form a higher high as price starts to pull back you
can then mark out where your high is and you can mark out where your most recent swing low is now everything within that high that orange line and that low that orange line right everything in between there is just internal structure so the whole time prices you know pulling back it's breaking highs it's breaking lows price is still bullish we're still within the swing high and swing low this is all just what i call internal structure now when price finally breaks out through that high to form the higher high and we get that break of
structure we want to look back and we want to know where our new swing low is okay now some people would say this is their swing low some people would say this is their swing low but the way we're going to do it nice and mechanical is a swing low is the lowest point that caused the swing high okay so when we see this new high being formed and we know that's the new high our swing low is the lowest point that caused the high which in this case as you can see as i've already
marked that is the swing low okay now again this might seem pretty basic but as we start to apply more kind of you know complex steps to this or we start to look at multi-time analysis especially in live markets you can sometimes get a little bit lost so it's just really important to then know where the next range you are playing within the k so then price can pull back um to form the high low before we get that next uh break of shut now the reason why this is so important is because what you'll
see a lot of people do in the live market is they don't kind of paint the story well enough they don't go back far enough in price action and when they're trying to define their swing high in a swing low what they do is they're actually way too zoomed in on price if i can actually get this to zoom in for me uh and let's say they're just looking at this section of price action here and they go okay what i can see is price is making series of lower lows and lower highs and it's
pulling back to form a lower low sorry lower high and now it's broken and it's formed a lower low right and they're just looking at this section of price action in in the orange line right so as price is pulling back up to this level maybe there's a supply zone they trade from maybe it's a resistance zone wherever you trade and then they try and get short from here all right whack on okay that's gonna spaz out for me but whack on there's a wrist reward tool and then boom they get smashed right as price
moves up higher and they're sitting there scratching the head going well prices move to the downside it was making lower lows and there were highs i've got short i've just been spanked why is that happening and they go oh maybe that was just you know down to probability but actually it's because you're on the wrong side of the market and you haven't mapped your swing highs and swing lows correctly um and you're trying to trade that internal structure and trying to trade against the actual swing trend there so yeah it's pretty basic but you'd be
surprised at how many people who have actually been trading for quite a while can get their structure uh mapped out a little backwards sometimes so that's kind of the main points i wanted you guys to take away from this sort of first little bit swing high is just the highest point you know it's vice versa on the bearish stuff right the swing high is the highest point so let's say this high that calls that low so then when price forms that lower low in a bearish market that becomes your next swing range the price can
pull back as deep as it wants right it could come all the way up to this orange line but as long as it doesn't breach that line as long as it doesn't form a higher high as long as that lower high stays intact then we're still in the bearish market and price can then go on to make that next lower low okay then again everything that's in between that low and that high that is all just internal structure okay it's not swing structure and the final point is again a very simple one but after a
break of structure we always expect a pullback on that time frame pretty simple but you'd be surprised at how many people in the market let's say over here right they see that level go they see that high go they see price form a higher high and the minute they see that level go then they start thinking about buying they think okay well we're forming a higher high we're bullish that's a sign of strength let me get along here but actually the smart thing to do is when you first see that breaking structure that's when you
use it in your mind and start thinking the opposite of going well actually now i'm expecting a pullback so now i need to think about that and adjust accordingly right whether you want to short and play the pullback or whether you need to manage et cetera et cetera so on to the next thing very very simple stuff here but this is the concept of strong and weak highs and lows so what easiest way to think about this is what is a lowe's job well a swing low's job is to make a swing high if you
think about that right and a swing high's job is to try and make a lower low okay so lows want to make highs and highs want to make lows now in a bullish market that is where we have a series of strong lows so the way to think about this is this is a strong low this solid blue line because it went on to form a high it went on to form that higher high so it did its job now when price pulls back this high whether where the pullback initiated from right if it doesn't
take out that strong low then actually that means it's a weak high because it's failed to do its job that high has failed to make a lower low so if you get in long here right you can then target that weak high that does it high because it's failed to do its job so now we get in in the bullish market we like to get long and we target that weak high okay exact same thing as long as it pulls back and it doesn't take out that next strong swing low we now know that this
is a weak high so if we are in any longs here we can target that weak high uh and then we can you know try and target that higher either so hopefully that makes sense exact same thing in a bearish market i'm not going to go through that just for you know trying to keep this video at a reasonably short length but that's kind of as simple as this concept is but it's a powerful one because if you're getting in long hair on these on these strong high lows and you're going okay where am i
going to target well you can start to target that weak structure this is a weak high why because it failed to take out the low okay it failed to do its job this is a strong low in theory right so we should try and target that weak high so on and so forth so if you think about it really our goal is traders you know we're trying to trade those easy trades trade those continuations our goal is to catch higher lows in a bullish market right we want to catch all of these strong lows and
we want to catch lower highs um in a bearish market right we want to be trading from here and then targeting those weak lows right that's kind of the simplest uh way to think about it so like i was saying here right let's say we're in this bearish range here we've had that breaking structure price is pulling back at this point we know that this is a strong high because it took out the low it did its job so in theory price can pull all the way back up to that hot pool all the way
back up to the high but because it's a strong lower high price should not breach it and kind of another way you can think about this is that it took a hell of a lot of money for price to actually move down and break that low so i guess you could think there's a vested interest in that high being protected and priced not trading above that high right um so what that does is we can build trade ideas around that right it gives us a hell of a lot of confidence to look to short from
here and target what target that weak low why is it a weak low well because it fell to its job it failed to take out the high and it failed to form a higher high right super simple but it just gives you such a clean framework for kind of mapping your structure and knowing where to target so trend changes obviously bullish market doesn't last forever bearish market doesn't last forever well especially in forex maybe if you trade crypto or all the stocks it's just bullish forever but yeah anyway so we have a bullish market we're
making price what price is making high highs and high lows now at this point here right this low in theory is a strong low because it did what it took out that high and it made a higher high so it did its job but at some point what's going to happen is price is going to break that low and it's going to go on to form a lower low so when price was pulling back we expected this to be a strong low the expectation is that bullish trend will continue right so we should expect price
to do that but obviously hasn't the bullish expectation has failed and price has now formed that lower low so we're now in a bearish market okay and that's what this dotted line shows it just shows where that trend change occurred as soon as we break this level and we form a lower low for me that is now a bearish market now some people what they want to see for a confirmed trend change is they want to see both a lower low and a lower high okay and the reason why that is um is because what
can happen is you can get a trend change price can form that lower low but it can be a false kind of signal and the price can continue upwards and what it turns out is actually it was just a liquidity grab it was just grabbing the liquidity behind this low to grab that and then continue the bullish market so that's why some people they don't confirm a trend change until you get both a lower low so that move there and the lower high right so they need to see the lower low and the lower high
and remember we never know where that lower high is going to be until it takes out the low okay so for those people to have a confirmed trend change they would need to see a double break of structure because they would need to see the lower low price form pull back to form the lower high and then obviously it needs to break structure to form or to confirm where that lower high is okay now so for me personally i don't need that much confirmation the way i keep my training super simple is the moment we
get that lower low that swing lower low that for me is a trend change and now i'm looking for that lower height to form to continue that bearish move okay so when we get that lower low formed if you think about the strong and weak highs and lows concept what has happened well a strong low was taken out so that means a lot of money had to step in somewhere in this leg to form that lower low right to form that trend change so in theory this should now be a very strong high because it
took a lot of money to cause it low so if you think there's a you know it's a protected high right there's a lot of money has a vested interest in price now not trading higher than this high so when we form that trend change and price is pulling back what we can now do is build trade ideas around this right because we can start to look to get short and we know that price should not really in theory trade higher than this this level here right this line here and then if we do get
short in here where do we target well at minimum we want to be targeting that weak swing low why is it a weak low well because it failed at its job it failed to take out that high right so this is really simple stuff but it's literally how you build um just a solid foundation for your training and then very very quickly right we get a bearish market and then eventually we'll form that higher high a lot of money stepped in to take out that strong lower high to form that higher high so the bearish
expectation where we would have expected the lower higher to form that has now failed we've formed a higher high so then we can look for the pullback and we can try and catch that higher low because this strong low should be protected and we can target this weak high high because it's failed to do its job right and then boom we continue that bullish market okay pretty simple stuff now something called change of character i don't really like the term it's a bit of a fancy name but all it essentially means it's similar to trend
change but it's not the same so for a trend change we're looking for the swing highs and lows to be taken out for a change of character it doesn't have to be swing structure it can just be that internal structure so there's little minor movements in between that is what we're looking for a change of character so it's the first sign of weakness or the first sign of strength essentially so imagine you just got some nice small little price movements making a series of you know high highs and high lows the first time you see
that high low fail and we get a lower low that is your change of character okay generally we're applying that to the the internal structure between the swing highs and swing lows that is what we call a change of structure then of course eventually at some point that series of lower lows and lower highs eventually price will break up and form that first uh higher high right um and that is essentially what you call a change of character it's basically bullet structure changing to bearish structure and vice versa so a bit of a subtle difference
to trend changes but you'll see how we apply that now so if you kind of look at this very basic sort of continuation you know price model whatever you want to call it price makes a nice swing high it pulls back to form a swing low we then get a break of structure so we form that higher high okay now when we get a break of structure what do we expect we expect to pull back on that time frame how can we know when that pullback is about to start well there's a few things we
can use supply and demand liquidity and all these other things which we'll get into in a minute but for this this video we just want to look at structure alone so how can we know when that swing run is over and that pullback is about to start well this is where change of character becomes really handy where essentially this is all one swing leg up okay so we're now playing within this next range and we want to know can we uh play that pullback right um so if we see this minor low here get taken
out and we get that first kind of you know sign of weakness that change of character where that minor low gets taken out and we get that internal lower low now the internal structure is bearish and that is in line with trading a pullback right so now we can trade that pullback now how do we know when the pullback is finished and that higher low is likely to well have formed we then get a bullish change of character okay where that internal lower high gets taken out we then form an internal higher high remember the
whole time the swing structure is still bullish that has not changed we're just looking at the internal structure so everything in in here is internal structure we're just looking for that to switch from uh bearish to bullish and that basically just allows us to anticipate when the pullback is starting and then when the pullback has finished and then when we get that internal structure to the upside we get that change of that change of character now we can look to get long and target what target that weak high why is that a weak swing high
well because it failed to do its job it failed to take out the swing low so just to keep this as simple as it needs to be we look for those in those internal changes of character to help us know when this swing run has ended when we can then start to anticipate the pullback and then when we can anticipate that that pullback has now finished and we can anticipate that the high low is formed and we can start to target that next swing high high hopefully that makes sense now what i want to add
is changes of character i'm not the holy grail obviously they can give you full signals and that is why you need to pair them with other complements that we're going to look at right in the next few videos so again we get that swing movement up we see that change of character that first sign of a lower low okay pull back is now starting it stays bearish but then we get a bullish change of character where we get that first internal higher high okay maybe now this tells us that the high lows is in place
and we can target that higher high price tries to do that but then what happens it fails to do so and now we get another bearish change of character k because now we've got another lower low so the internal structure has now switched bearish again okay maybe that means we're gonna have a deeper pullback so we pull back deeper wait for a buddhist change of character okay now the internal structure has a line bullish again it's back in line with the overall swing structure okay now maybe the high low is in place and now we
can get long and we can target that weak swing high okay so yeah that's basically as simple as we use change of character but obviously when we uh combine that with multi-time analysis supply and demand et cetera et cetera that is how we can increase um our strike rate of using it and very quickly the same applies to you know if you're using this for reversals so let's say price is bullish with the swing structure right making a series of higher highs and high lows now let's say we come into a really clean supply level
that we like resistance level whatever your strategy is and you are anticipating a trend change so you are anticipating that bearish reversal now what you can do and the safest thing to always do is to wait for this swing higher low so this being the lowest the most recent swing low you just wait for that to be broken right because then once this is broken and we get a lower low that trend change is now confirmed okay now we have that confirmed bearish trend change and you can wait for price to pull back to form
that lower high now we can get short that's the safest way to do it but of course we don't have to wait for that we can anticipate that reversal beforehand by looking at that internal change of character right so price takes out that minor low that internal low we then get that internal lower low that change of character wait for price to pull back and then we can look to short and we anticipate that trend change okay but of course like anything it's on 100 strike rate we can get that internal change of character we
can get short right but then what can happen is this is still a strong low and a strong high right sorry weak high until it's taken out so when the market is bullish and we're training to the upside yes we can get that change of character there and we can anticipate the reversal like what we were expecting to happen over here but there's no guarantee because this is still a strong low right so the odds are that this strong low is going to be protected and we're going to continue to to the upside so if
you do get short and you're trying to trade that reversal you see that change of character but then if you see that bullish change of character again you have to take that message from the market that actually this low is going to be protected it's likely the higher low is now formed and now we can target that high high again right and take out that weak high so yeah just kind of that's how we use change of character we just need to know that of course it's not you know 100 of the time now before
we apply all of this onto the charts one other thing we need to look at is actually you know how do we map this on candlestick charts right because i'm not just going to be looking at line charts so kind of two main ways you can do this both ways we're always going to draw structure from the wicks of candles okay so wherever you draw your swing high and swing low we're always going to draw it from the wicks of candles but the difference between the two types is what you need to see for a
break of structure to have occurred so for type 1 when you draw your structure from the candle the wick of the candle you need to see a candle close above that that that that swing higher k for there to now be a higher height for there to be a break of structure now this is a bit more of a conservative way of mapping your structure because it's going to take a lot more money right to actually get price to breach that high and to stay and to maintain above that high and to close above that
high so here you can see where price spiked above it actually it was just what's called a liquidity grab right it grabbed the orders behind that that high but it failed to close above there so for me at that point that would not be a higher high that would not be a swing higher high because it didn't close above until we get this closure here now the second way is type two this is a bit more aggressive because we map structure the same way from wix but we only need to see price literally just wick
it for there to be a break of structure so as you can see this is the exact same price action but you can see how the trend changes you know a lot more quickly it's a lot more aggressive you get those turning points um a lot sooner because as soon as price breaks that high that then gives us our higher high so then if we look back where was the lowest point that caused the high it was this point here okay so that becomes your swing low so you map that then price breaks that so
now we're bearish so we're playing within this range here but then price moves up and then it forms a higher high so you can see how that's a lot more aggressive we can potentially get you into trade sooner um but it can give you a lot more full signals where basically you're viewing liquidity grabs as trend changes okay so for me personally the way that i use these i use both which okay you may be thinking right give me a simple answer but i always use both so i use type one for um i'll show
you here i've done this little diagram which hopefully makes this explanation a little bit more simple so i use type 1 mapping where i want to see a candle closure for swing breaks of structure so when i want to know if we formed a swing higher high or swing level or whatever i need to see a candle close above that higher low so as you can see here these are the two type ones there and here because they're my swing brakes of structure i want to see a candle closure at both these points to confirm
those higher heights now where i use type 2 so where i just want to see a wick break i use those for the changes of character so on the internal structure i'm happy just to see a wick break there to know that i've had my change of character um now i know the pullback's starting and now i know maybe the pullback's ended and we can get that next higher high okay so hopefully that makes sense so that wraps up the theory like i said below there should be a pdf link um in the description below
if you want to save these uh and go back over them so let's hop into the charts and apply this so what we're going to do is we're going to go through a bit of price action on the four-hour chart i'm not gonna do like a full-on long long long walk through just because this video will go on for hours um but we'll just look at a few kind of random bits of price action um yeah and i'll just show you the way that i kind of apply that theory that we've just gone through and
hopefully it will make a lot more sense i went through it at a reasonably quick pace some of you who kind of trade this way super simple stuff some of you who don't it might be a little bit confusing but hopefully as we go through this now you'll kind of see my thought process how i how i look at everything we've just discussed um and you'll see how simple it can be obviously watch this video as many times as you need to so let's just zoom into this section of price action here so so my
camera did just cut out there but hopefully i can edit this together so right now we're on the charts uh what i'm going to do just zoom into kind of a random bit of price action um i'm just going to kind of yeah just talk through i guess that process that we just looked at and hopefully this will start to make quite a bit more sense so as we can see right on the four-hour chart price is making these series of higher highs and higher lows and then we take out this low to switch to
a bearish trend so let's kind of just go from this point onward so as we get this breaker structure here on the four-hour chart all right we'll just mark that out as our breaker structure now where is our swing high on a swing low that's basically what we always want to find out what swing range are we playing within and then everything from there on right follows so as we get that breaker structure to the downside our swing high is the highest point that took out the swing low so we traced back pretty obviously in
this case it would be that high up there now after we get a break of structure what do we expect we expect to pull back on the time frame how do we know when that pullback is likely to start we get a change of character so where is the change of character well if you look at price action ignore the color of the candles that's irrelevant what you want to be looking for is those counter-trend movements where the next candle fails to break the low or the high of the previous candle right so in this
case we're bearish we want to look at where those candles stop breaking the prior counters low here's the first point right we get that pull back but we continue bearish right we get another pullback and then we can continue bearish and then we take out that internal lower high to form an internal higher high right so that's the change of character we're looking for so when we see that that gives us our signal that there is now a bullish change of character right from that inside bar and now we have the internal structure switching bullish
which is aligned with that pullback starting how do we know when that pullback is likely to finished and the next spring leg is likely to have started purely just thinking about structure here right don't have much time from analysis just yet not looking at supplying demand not looking at liquidity sweeps around that stuff purely just simple structure we look for a change of character back to the downside so we have this bullish movement up we have a pullback we then have that internal higher high again which means we now have that internal low there right
zoom in that now becomes a low so when price comes down and takes out that low to form a lower low now we have that change of character to the downside the internal structure is now bearish which means it's aligned with the swing structure so now that gives us a really solid signal that the lower high has likely formed and now we can look to get short as price pulls back into supply right and the model we target we target at a minimum that weak swing low why is it a weak swing low because it
failed to take out the swing high right it failed to do its job and then we get short target there and potentially further okay that's it that's as simple as it is that's the process of follow um pretty much um obviously across more than one time frame which we'll get into in a bit um but yeah that's it so then we get our break of structure now we need to know what's the next range we're playing with it so where's our swing high pretty obvious uh in this case so just marked out it's the highest
point that took out the low uh what do we expect after a break of structure we expect to pull back on that time frame how do we know when the swing run is over and that pullback is likely to have started we get a change of character so here this is just a very minor pullback right and then all of those candles break the prior candles low so for me this is the high that needs to go for there to be a change of character okay so that confirms kind of the pullback started now how
do we know when that pullback is slightly to have ended and we can catch that next lower high we look for a change of character to the downside so where does that happen well if you look at the price action you had a movement up that's a pull back there because that's an inside bar but then all of these candles uh break the prior cameras high so that is all part of the up move then we pull back and then we take out that low so now we have that internal change of character right the
internal price action is now bearish it's back in line with the swing trend or the swing range that we're within right that's the swing higher that's the swing low we've had the pullback we've now had the bearish change of character we're back in line with the bearish swing trend so now we can look for shorts right price pulls back into supply boom we can get short catch the lower high and target that weak low right so on and so forth and that that is literally it you just always want to know where is my swing
range where's my swing high where's my swing low um what is the internal structure doing is the internal structure currently against the swing structure then that means it's likely pulling back and then when it realigns with the same trend as the swing structure then you know it's very likely that the pullback is now finished the lower high may be in place and now we can then target that that weak swing structure um yeah that's it i mean i don't want to go through every bit of price action here just look at a few kind of
more interesting i guess examples so here we're still bearish then we get a pullback let's kind of measure that pull back how big is that so yeah over 40 pips so on a four-hour chart for me that counts as a swing pullback um so for me i would mark that out as a break of structure okay and then we are playing within what range well that would be the swing high because that's the highest point that took out the low and then obviously that's going to be the swing range we are within so this is
obviously where we get a reversal with the benefit of hindsight but let's see how you know how i would read this in a live market okay so um actually let's use this i wasn't going to do this but let's do a little bit of bar replay um which is on this example just because if we do it for everything it will take forever but we'll kind of finish up on this right so we're clearly bearish we pull back we break structure that's right so this is our current swing high now we don't really know where
the swing low's going to be until we pull back but we've had the breaker structure what do we expect to have to break a structure we expect to pull back how do we know when the pullback uh is likely to start we look for a change of character so we see how all of these cameras break the prior counters low that's all part of the down move but then with this candle here it's an inside bar it's got a little indicator that makes it a white candle but essentially you can see that this candle here
failed to take out this candle's low so that's part of the pullback right so now we know that we have a minor low so move along now price has taken out that low that now means we have a minor high here so i'm literally if i'm looking for that bullish change of character i'm waiting for this high to get taken out and then i know that i have that bullish change of character and we can potentially anticipate a pullback starting so let's move this forward okay now we get that high taken out that means we've
had a bullish change of character so now i can look for a pullback into where into this swing high up here okay so the expectation purely just looking at structure i'm purely just looking at one time frame the expectation at the moment is that price will not trade higher than this swing high here why well because technically it should be a strong high because it took out a low so it was to remain bearish price can trade all the way up here and then it can go as long as it doesn't breach that high okay
but we've had a bullish change of character so now we can look to trade this pullback back up in towards the higher okay so price pulls back into uh demand we get a nice movement up that would be a great area to look for long positions right to play that counter trend pullback now as price starts to pull back what i'm looking for this entire time is i'm looking for price as it's putting back to have that bearish change of character so the internal structure realigns with the swing structure then i know that the lower
high is likely to have formed and then i can try and trade that short okay so what do we have here price is still bullish okay we just start to get a bit more corrective but we're still bullish okay now we've had that bearish change of character because we have taken out this lower okay so you can see how price moved up it pulled back it went up it pulled back it went up and then we got that internal lower low so now the trend or the internal structure is in line with the bearish structure
we can look for shorts okay now we pull back okay now what happens here you see this is a warning sign because we move down we form a lower low internal lower high an internal lower low but then we take out that internal low high so what's happened we've had a bullish change of character so that gives us a warning sign that potentially you know we're going to move up at a bare minimum i would expect this high here to get taken out to get run because it's failed to do its job it's failed to
make a level low so at a bare minimum i would expect that but generally when this happens especially right at the top of the range this is usually a warning sign that that it's going to fail and we are going to form that higher high so now you can look for for longs and then boom we anticipate that trend change and our prices change trend so then at this point right you start looking for longs or pro trend longs and we get priced there uh trading there to the upside so yeah i mean i'll tell
you what we'll look at one last example let's look at reversals they're usually a bit more interesting and then we can look at the continuation from there so price is clearly bullish for quite a while um and then this would be our swing low down here right move this out of the way and we get that breaker structure to the downside so let me zoom in into here so price now switch switches bearish so obviously we're trying to anticipate that lower high to get that next various trend change right so price we get a breaker
structure what do we expect after breaking structure we expect to pull back how do we know when the pullback started we get a bullish change of character so we get that bullish change of character now we could just straight away you know if you trade supply or whatever look to get short from here and that's absolutely fine maybe we want a little bit more confirmation so how do we know when that pullback is slightly likely to have ended and the next spring run is likely to have started we wait for the internal structure to align
with the spring structure the spring structure is obviously bearish so now we want to wait for the internal structure to switch bearish so we come into supply we pull back we go in and then we take out that minor low right which is down here so now the internal structure just drawn a little bit more accurately you can be really aggressive with taking inside bar or let's just take that minor low there right now we have that bearish change of character so now what now all systems are aligned all systems go we pull back into
supply everything's there boom we get short where do we target at a minimum that weak swing low why is that a weak low well because it failed to take out the swing high okay then we get our breaker structure we now get a lower low how do we anticipate when that pullback is slightly to start well we get a change of character so you see how we take that minor high right we take the low we take the high that is our bullish change character let me give it all these lines because it's getting messy
as hell um so we get that breaking structure okay here breaker structure then we get that change of character as we take that minor high there then we pull back into supply how do we know when that lower high is likely to have formed we wait for the internal structure to switch bearish so we take that low out we get bearish pull back into supply right and then short at a minimum that low there right then we pull back how do we know the pullback's over we wait for that low to go see this is
a minor low there we get that bearish change of character pull back into supply boom we're off now obviously you can't anticipate how far price is going to go no one knows how far price is going to go but that's when we start to bring in multi-timeframe analysis behind demand yeah and we can start to do it and you just follow it on you know again when when is the swing run likely to ended because we dumped for ages but we never get a chipboard change of character until when until boom then we get the
change of character okay pull back's now started how do we know when the pullbacks ended we get a bearish change of character look we take out the low pull back into supply then we target the weak low why is that a weak low because it failed to take out the swing high all right i'm going to leave that there just because i don't want this to turn into like two out two hour video i don't even know how long we've been running already but yeah hopefully oh i feel like i went through that a little
bit too quickly but hopefully that's made sense um let me know if it has it hasn't um any feedback is appreciated for some of you who trade this way it might be a little bit simple like i was saying for some of you who are a bit brand new to this um just watch this as many times as you need to and it will start to click but yeah it's literally the first thing i'm looking at every time i'm on the charts i map out my swing high my swing low figure out if i'm trading
pro trend or counter trend how's the pullback started do we have that change of character has a pullback ended do we have that you know change of character back in line with the swing structure and then i'm looking for where are my weak highs where are my weak lows right and i want to trade in that direction okay targeting um yeah those weak points of structure so if you take any value from that um yeah please let me know in the comments below give me any feedback any requests that you want to see for content
as well um obviously i do have my own uh course and mentoring program at photon as well if you want to check that out um hopefully on screen i'm just showing you now that we have a full course showing you the end to end you know if you literally know nothing about fx and you want to start i have covered everything in there um all the way through to you know really advanced technical analysis and it's kind of my mechanical strategy laid out there for you um full trading plan and everything um you know i've
kind of laid out the course in a way where essentially i'll show you the theory like this then i'll do a walkthrough then i'll give you a section of price action for you to then go away and apply the concept that you just learned and then in the next video you can then watch me go through that exact bit of price action that you just attempted your analysis on and then you can compare and contrast and yeah it just makes it a really kind of uh dynamic and effective way for learning um also you know
there's regular market content breakdowns commentaries every week uh you know i post my analysis um before that session every morning uh full tray recaps markups a lot so if you're interested have a little bit below if not i'm gonna be posting um content pretty much aiming for every week now on youtube so yeah like i said if you literally comment below anything you want to see um i will take note of all of those but there's in a spreadsheet and get those uh videos done for you so i don't think there's anything else i wanted
to add like i said if you do want those diagrams they should be in a pdf in a link below the video so yeah enjoy and see in the next one you
Related Videos
![How to Understand Multi-Timeframe Market Structure - MUST WATCH | SMC | FOREX [Part 2]](https://img.youtube.com/vi/iYbevTXtejc/mqdefault.jpg)
59:33
How to Understand Multi-Timeframe Market S...
Matt Donlevey - Photon Trading
633,833 views

3:27:44
Beginners Guide To Forex Trading In 2025 (...
Matt Donlevey - Photon Trading
165,337 views

39:19
Support And Resistance Didn't Work Till I ...
Rayner Teo
2,067,288 views
1:17:35
The Only Technical Analysis Video You Will...
The Trading Channel (The Trading Channel)
24,332,345 views

19:37
How To Find Intraday Bias Simplified
Matt Donlevey - Photon Trading
128,111 views

20:41
Elite Market Structure (Mechanical Trading...
Matt Donlevey - Photon Trading
213,651 views

1:16:58
How to Read Market Structure | Basic and A...
Iliya Sivkov - Trading Fanatic
1,064,782 views

34:36
Smart Money Concept Free Course | Learn SM...
Pushkar Raj Thakur: Stock Market Educator 📈
734,100 views

20:08
Liquidity + Structure = Profit
JeaFx
608,211 views

17:23
Master Institutional Supply and Demand Tra...
Matt Donlevey - Photon Trading
1,095,363 views
27:20
How To Trade AGAINST The Trend | SMART MON...
Matt Donlevey - Photon Trading
222,236 views

25:27
Master Liquidity Concepts (Mechanical Stra...
Matt Donlevey - Photon Trading
618,349 views

22:13
How To Do Multi-Timeframe Analysis Easily ...
Matt Donlevey - Photon Trading
151,051 views

4:56:52
The Ultimate "Smart Money Course" Ever🔥 |...
Fortune Talks
590,537 views

49:48
Use this SIMPLE Tool to INSTANTLY Boost Yo...
Matt Donlevey - Photon Trading
395,959 views

23:06
Liquidity Trading SIMPLIFIED (Step by Step...
JeaFx
278,925 views

26:19
Double Your Win Rate With This Mechanical ...
Matt Donlevey - Photon Trading
170,058 views

23:41
How to Understand Market Structure | FOREX
Iliya Sivkov - Trading Fanatic
550,701 views

22:20
Complete Guide to Market Structure (Mastery)
JeaFx
130,069 views
![How I Beat the Mental Game of Trading [After 5 Years of Failure]](https://img.youtube.com/vi/4gaaGDldQwY/mqdefault.jpg)
27:48
How I Beat the Mental Game of Trading [Aft...
The Traveling Trader
422,660 views