6. Monte Carlo Simulation
2.07M views6492 WordsCopy TextShare

MIT OpenCourseWare
MIT 6.0002 Introduction to Computational Thinking and Data Science, Fall 2016
View the complete cour...
Video Transcript:
the following content is provided under a Creative Commons license your support will help MIT open courseware continue to offer high quality educational resources for free to make a donation or to view additional materials from hundreds of MIT courses visit MIT opencourseware at ocw. mit. edu welcome to lecture six as usual I want to start by posting some relevant reading um for those of you don't know this lovely picture is of the uh casino at at Monte Carlo and uh shortly you'll see why we're uh talking about casinos and and gambling today uh not because I want to encourage you to gamble your life savings away little history about Monte Carlos simulation which is the top of today's lecture the concept was invented by the Polish American mathematician stanislav ulam uh probably more well known for his work on thermonuclear weapons than on mathematics but he did do a lot of very important mathematics earlier in his life uh the story here starts that he was Ill recovering from some serious illness and was home and was bored and and was playing a lot of games of Solitaire a game I suspect you've all played being a mathematician he naturally wondered what's the probability of my winning this stupid game which I keep losing and so he actually spent quite a lot of time trying to work out the combinatorics so that he could actually compute the probability and despite being a really amazing mathematician he failed the comat TOs were just too complicated so he thought well suppose I just play lots of hands count the number I win divide by the number of hands I played then he thought about and said well I've already played a lot of hands and I haven't won yet uh so it probably will take me years to play enough hands to to actually get a good estimate and I don't want to do that so he said well suppose instead of playing the game I just simulate the game on a computer he had no idea how to use a computer Compu but he had friends in high places and uh actually uh talked to John Von noyman who is often viewed as the inventor of the stored program computer and said John C could you do this on your fancy new eniac machine and on the lower right here you'll see a picture of of the eniac it was a very large machine it filled a room um and Von noyman said sure we could probably do it in only a few hours of computation uh today we would think of a few microseconds but those machines were slow hence was born Monte CLE simulation and then they actually used it in the design of the hydrogen bomb so it turned out to be not just useful for cards so what is Monte caros simulation it's a method of estimating the values of an unknown quantity using what is called inferential statistics and we've been using inferential statistics for the last several lectures the key Concepts and I want to be careful about these because we'll be coming back to them are the population so think of the population as the universe of possible examples so in the case of solitire it's a universe of all possible games of solitire that you could Poss posibly play I have no idea how big that is but it's really big then we take that universe that population and we sample it by drawing a proper subset proper means not the whole thing usually more than one sample to be useful certainly more than zero and then we make an inference about the population based upon some set of Statistics we do on the sample so the population is typically a very large set of examples and the sample is a smaller set of examples and the key fact that makes them work is that if we choose the sample at random the sample will tend to exhibit the same properties as the population from which it is drawn and that's exactly what we did with the random walk right there were a very large number of different random walks you could take of say 10,000 steps we didn't look at all 10 all possible random walks of 10,000 steps we drew a small sample of say a hundred such walks computed the mean of those 100 and said we think that's probably a good expectation of what the mean would be of the all the possible walks of 10,000 steps all right so we were depending upon this principle and of course the key fact here is that the sample has to be random if you start drawing the sample and it's not random then there's no reason to expect it to the same properties as that of the population and we'll go on throughout the term and talk about the various ways you can get fooled and think you have a random sample when exactly you don't all right let's look at a very simple example people like to use flipping coins because coins are are easy um so let's assume we have some coin all right so I brought two coins slightly larger than the usual coin and I can flip it flip it once and let's consider one flip and let's assume it came out heads I have to say the coin I flipped is not actually a $20 gold piece in case any of you were thinking of stealing it all right so we've got one flip and it came up heads and now I can ask you the question if I were to flip the same coin an infinite number of times how confident would you be about answering that all infinite flips would be heads or even if I were flip it once more how confident would you be that the next flip would be heads and the answer is not very well suppose I flipped the coin twice and both times it came up heads and now I asked you the same question do you think that the next flip is likely to be [Music] heads maybe you would be more inclined to say yes than having only seen one flip but you wouldn't really jump to say sure on the other hand if I flipped it a hundred times and all 100 flips came up heads well you might be suspicious that my coin only has a head on both sides for example or is weighted in some funny way that it mostly comes up heads and so a lot of people maybe even me if you said I flipped it 100 times and it came up heads what do you think the next one will be I best guess would be probably heads how about this one so here I've simulated a 100 flips and we have 50 heads here two heads here and 48 tails and now if I said do you think that the probability of the next flip coming up heads is it 52 out of 100 well if if you had to guess that should be the guess you make based upon the available evidence that's the best guess you should probably make because you have no reason to believe it's a fair coin could well be weighted you know we don't see it with coins but we see weighted dice all the time or we shouldn't but they exist you can buy them on the Internet um so typically our best guess is what we've seen but we really shouldn't have very much confidence in that guess because well nah could have just been an accident highly unlikely even if the coin is fair that you'd get 5050 right so why when we see a 100 samples and they all come up heads do we feel better about guessing heads for the 101st than we did when we saw two samples and why don't we feel so good about guessing 52 out of 100 when we've seen 100 flips that came out 52 and 48 and the answer is something called variance when I had all heads there was no variability in my answer I got the same answer all the time and so there was no variability and that intuitively and in fact mathematically should make us feel confident that okay maybe that's really the way the world is on the other hand when almost half for heads and almost half for Tails there's a lot of variant right I hard to predict what the next one will be and so we should have very little confidence that it isn't an accident that it happened to be 5248 in One Direction so as a variance grows we need larger samples to have the same amount of confidence all right let's look at that with a a detailed example we'll look at roulette uh in keeping with the theme of Monte Carlos simulation this is a roulette wheel that could well be at Monte Carlo uh there's no need to simulate Roulette by the way it's a very simple game um but as we've seen with our earlier examples it's nice when we are learning about simulations to simulate things where we actually can know what the actual answer is so that we can then understand our simulation better for those of you don't know how roulette is played is there anyone here who doesn't know how roulette is played good for you you grew up virtuous all right so well all right maybe I won't go there all right so you have a wheel that that can spins around and in the middle are a bunch of pockets each pocket has a number in a color the you bet in advance on what number you think is going to come up or what color you think is going to come up then somebody drops a ball in that wheel gives it a spin and through centrifugal force the ball stays on the outside for a while but as the wheel slows down it heads towards the middle and eventually it settles in one of those pockets and you win or you lose now you can bet on it and so let's look at an example of that so here's a roulette game I've called it fair roulette because it's set up in such a way that in principle if you bet your expected value should be zero you'll win some you'll lose some but it's fair in the sense that it's not either a negative or a positive SU game so as always we have an underbar underbar in it um typically well let's we're setting up the wheel with 36 pockets on it so you can bet on the numbers 1 through 36 that's the way range works you'll recall uh initially we don't know where the ball is so we'll say it's none and here's the key thing is if you make a bet this tells you what your odds are that if you bet on a pocket and you win you get Len of pockets minus one so this is why it's a fair game right you bet a dollar if you win you get $36 your dollar plus 35 back if you lose you lose all right self.
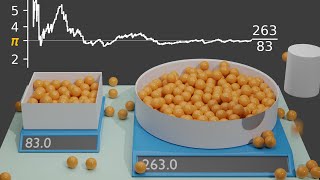
spin will be random. Choice among the pockets and then there's simply bet where you just can choose an amount to bet and the pocket you want to bet on I've simplified it I'm not allowing you to bet here on colors all right so now we can play it so here's play roulette uh I've made game the class a parameter because later we'll look at other kinds of roulette games you tell it how many spins what pocket you want to bet on for Simplicity I'm going to bet on the same pocket all the time pick your favorite lucky number and how much you want to bet and then we'll have a simulation just like the ones we've already looked at so the number you get right starts at zero for I and range number of spins we'll do a spin and then tote pocket plus equal game. pocket it'll come back either zero if you've lost or 35 if you've won and then we'll just print the results so we can do it um in fact let's run it so here it is uh I guess I'm doing a million simul games here so quite a few um actually I'm going to do two I'm going to look what happens when you spin it a hundred times what happens when you spin it a million times and we'll see what we get so what we see here is that we do a 100 spins uh the first time I did it uh my expected return was minus 100% I lost everything I bet not so unlikely given that the odds are pretty long that do 100 times without winning uh next time I did 100 uh my return was a positive 44% and then a positive 28% so you can see for 100 spins it's highly variable what the expected return is that's one of the things that that makes gambling attractive to people right that you if you go into a casino 100 spins would be a pretty long night at the table and you know maybe you'd won 44% you'd feel pretty good about it what about a million spins well people aren't interested in that but the casino is right they don't really care what happens with a hundred spins they care what happens with a million spins what happens when everybody comes every night to play and there what we see is you'll notice much less variance uh happens to be minus 0.
04 plus6 plus 79 so it's still not zero but it's certainly these are all closer to zero than any of these are um we know it should be zero but it doesn't happen to be in these examples uh but not only are they closer to zero they're closer together there's much less variance in the results right so here I show you these three numbers and ask what do you expect to happen you have no clue right so I don't know maybe I'll win a lot maybe I'll lose everything I show you these three numbers you're going to look at and say well you know it's going to be somewhere between zero around zero and maybe 1% but you're never going to guess it's going to be radically different from that and if I were to change this number to be even higher um it would go even closer to zero but we won't bother okay so these are the uh yeah these are the numbers we just looked at because i' set the seed to be the same so what's going on here is something called The Law of large numbers uh or sometimes Bru's law this is a picture of brui on this stamp um it's one of the two most important theorems in all statistics and we'll come to the second most important theorem in the next lecture uh here it says in repeated independent tests with the same actual probability the chance that the fraction of times the outcome differs from P converges to zero as the number of Trials goes to Infinity so this says if I were to spin this rouette Fair roulette wheel an infinite number of times the expected return the return would be zero the real true probability from the mathematics well infinite is a lot but a million is getting closer to infinite and with this says is the closer I get to infinite the closer it will be to the true probability so that's why we did better with a million than with a 100 and if I did a 100 million we'd do way better than I did with a million I want to take a minute to talk about a way this law is often misunderstood this is something called the gambler's fallacy and all you have to do is say let's go watch a sporting event and you'll watch a batter strike out for the sixth consecutive time the next time they come to the plate the idiot announcer says well he's struck out six times in a row he's due for a hit this time because he's usually a pretty good hitter well that's nonsense says people somehow believe that if deviations from expected occur they'll be evened out in the future and we'll see something similar to this that is true but this is not true uh and there's a great story about it this is told in a book by huff and G uh and this truly happened in Monte Carlo with roulette and you could either bet on black or red black came up 26 times in a row highly unlikely right two to the 26 is a giant number and what happened is word got out on the casino floor that black had kept coming up way too often and people more or less panicked to rush to the table to bed on red saying well it can't keep coming up black surely the next one will be read and as it happened when the casino totaled up its winnings it was a record night for the casino it just millions of Franks got bet because people were sure it would have to even out well if we think about it probability of 26 consecutive Reds is that a pretty small number but the probability of 2 26 consecutive Reds when the previous 25 rols were red is what no that no if You' had 25 Reds and then you you spun the wheel once more the probability of it having 26 Reds is now 05 because these are independent events unless of course the wheel is rigged and we're assuming it's not people have a hard time accepting this and I know it seems funny but I guarantee there will be some point in the next month or so when you will find yourself thinking this way that something has to even out I did so badly in the midterm I will have to do better on the finals I'm that was mean I'm sorry all right speaking of means uh see Professor Grims is not the only one who can make bad jokes um there is something it's not the gambler's fallacy that's often confused with it and that's called regression to the me this term was coined in 1885 by Francis gton in a paper of which I've shown you a a page from it here and the basic conclusion here was but this table says is if somebody's parents are both taller than average it's likely that the child will be smaller than the parents conversely If the parents are shorter than average it's likely that the child will be taller than average now you can think about this in terms of genetics and stuff that's not what he did he just looked at a bunch of data and the data actually supported this and this led him to this notion of regression to the mean and here's what it is and here's the way in which it is subtly different from the gambler's F fallacy what he said here is following an extreme event parents being unusually tall the next random event is likely to be less extreme he didn't know much about genetics and he kind of assumed the height of people were random but we'll ignore that okay but the idea is here that it will be less extreme so let's look at it in roulette if I spin a fair roulette wheel 10 times and get 10 Reds that's an extreme event right there's a probability of basically 1 over 1024 now the gambler's fallacy says if I were spin it another 10 times I would it would need to even out as in I should get more blacks than you would usually get to make up for these excess Reds what regression to the mean says is different says it's likely that in the next 10 spins you will get fewer than 10 Reds you will get a Le a less extreme event now it doesn't have to be 10 if I'd gotten seven Reds instead of five you consider that an extreme and you would bet that the next 10 would have fewer than seven but you would wouldn't bet that it would have fewer than five all right because of this if you now look at the average of the 20 spins it will be closer to the mean of 50% Reds then you got from the extreme first spins so that's why it's called regression to the mean the more samples you take the more likely you'll get to the mean yes yes that's nothing do with the first one right because it's you have an extreme event which was unlikely and now if you have another event it's likely to be closer to the average than the extreme was to the average right and it it's precisely because it is independent that make sense to everybody yeah isy no the gambler's fallacy here and it's a good question and indeed people often do get these things confused the gamblers fallacy would say that the second 10 spins would we would expect to have fewer than five Reds because you're trying to even out the unusual number of Reds in the first spin right whereas here we're not saying we would have fewer than five we're saying we'd probably have fewer than 10 that it'll be closer to the mean not that it would be below the mean whereas the gambler's fallacy would say it should be below the mean to quote even out the first 10 does that make sense okay great questions thank you all right now you may not know this but casinos are not in the business of being fair um and the way they don't do that is in Europe they're not all red and black they snit sneak in one green and so now if you bet red well sometimes it isn't always red or black and furthermore there's this zero they index from zero rather than from one and so you don't get a full payoff in American roulette they manag to sneak in two greens they have a zero and a double zero uh tilting the odds even favor even even more in favor of the casino so we can do that in our simulation we'll look at European Roulette as a subass of fair roulette I've just added this extra Pocket zero uh and notice I have not changed the odds so what you get if you get your number is no higher but you're a little bit less likely to get it because We snuck in that zero then American roulette's a subass of European Roulette in which I add yet another pocket all right we can simulate those again nice thing about simulations we can play these games so I've simulated 10 10 20 Trials of a thousand spins 10,000 spins 100,000 and a million and what do we see as we look at this well right away we can see that uh Fair roulette is usually a much better bet than either of the other two that even with only a thousand spins the return is negative and as we get more and more as I got to a million it starts to look much more like closer to zero and these we have reason to believe at least or much closer to your true true expectation saying that while you break even in Fair roulette you'll lose 2. 7% in Europe and over 5% in Las Vegas or soon in Massachusetts all right we're sampling right that's why the results will change and if I ran a different simulation with a different seed i' get different numbers whenever you're sampling you can't be guaranteed to get perfect accuracy it's always possible you get a weird sample that's not to say that you won't get exactly the right answer I might have spun the wheel twice and happen to get the exact right answer of the return actually not twice because the ma math doesn't work out but 30 five times and gotten exactly the right answer but that's not the point we need to be able to differentiate between what's happens to be true and what we actually know in a rigorous sense is true or have maybe don't know it but have real good reason to believe it's true right so it's not just a question of faith and that gets us to what's in some sense the fundamental question of all comp computational statistics is how many samples do we need to look at before we can have real justifiable confidence in our answer as we've just seen not just a few minutes ago with the coins our intuition tells us that it depends upon the variability in the underlying possibilities so let's look at that more carefully we have to look at the variation in the data so let's look at first something called variance so this is variance of X think of X as just a list of data examples data items and the variance is we first compute the average of value that's mu so mu is for the mean for each little X and big X We compare the difference of that and the mean how far is it from the mean and square the difference and then we just sum them so this takes how far is everything from the mean we just add them all up and then we end up dividing by the size of the set the number of examples why do we have to do this division well because we don't want to say something has high variance just because it has many members right so this sort of normalizes by the number of members and this just sums how different the members are from the mean so if everything is the same value what's the variance going to be if I have a set with of a thousand sixes what's the variance yes zero I'm and just you think this is going to be hard but I came prepared I was hoping this would happen look out I don't know where this is going to go all right maybe it isn't the best technology I'll go home and practice all right so and then the thing you're more familiar with is the standard deviation and if you look what the standard deviation is it's simply the square root of the variance now let's understand this a little bit and first ask why am I squaring this here especially because later on I'm just going to take this a square root anyway well squaring it has one virtue which is that it means I don't care whether the difference is positive or negative right and I shouldn't right the variance I don't care which side of the mean it's on I just care it's not near the mean but if that's all I wanted to do I could take the absolute value the other thing we see with squaring is it gives the outliers extra emphasis because I'm squaring that distance now you can think that's good or bad but it's worth knowing it's a fact the more important thing to think about is standard deviation all by itself is a meaningless number you always have to think about it in the context of the mean if I tell you the standard deviation is 100 you then say well and I ask you whether it's big or small you have no idea if the mean is 100 and the standard deviation is 100 it's pretty big if the mean is a billion and the standard deviation is 100 it's pretty small so should never want to look at just the standard deviation all right here's just some code to compute those easy enough why am I doing this because recorded now getting to the punchline we often try and estimate values just by giving the mean so we might report on an exam that the mean grade was 80 it's better instead of trying to describe an unknown value by it an unknown parameter by a single value say the expected return on on betting a roulette wheel to provide a confidence interval so what a confidence interval is is a range that's likely to contain the unknown value and a confidence that the unknown value is within that range so I might say on a fair roulette wheel I expect that your return will be between minus 1% and plus 1% and I expect that to be true 95% of the time you play the game if you play a 100 rolles spins if you take a 100 spins of the roulette wheel I expect that 95% of the time your return will be between this and that so here we're saying the return on betting a pocket 10 times 10,000 times in European Roulette is minus 3. 3% I think that was the number we just saw and now I'm going to add to that this margin of error which is plus or minus 3.
5% with a 95% level of confidence what does this mean if I were to conduct an infinite number of Trials of 10 ,000 bets each my expected average return would indeed be minus 3. 3% and it would be between these values 95% of the time right I've just subtracted and added this 3. 5 saying nothing about what would happen in the other 5% of the time how far away I might be from this this is tot silence on that subject yes9 oh let's see yep I do thank you we'll fix it on the spot this is why you have to come to lecture rather than just reading the slides because I make mistakes thank you Eric all right so it's telling me that and that's all it means and it's amazing how often people don't quite know what this means for example when they look at a political poll and they see how many votes somebody is expected to get and they see this confidence interval and you say what does that really mean most people don't know but it does have a very precise meaning and this is is it where how do we compute confidence intervals most of the time we compute them using something called the empirical rule under some assumptions which I'll get to a little bit later the empirical rule says that if I take the data find the mean compute the standard deviation as we've just seen 68% of the data will be within one standard deviation in front of or behind the mean within one standard deviation of the mean 95% will be within 1.
96 standard deviations and that's what people usually use usually when people talk about confidence intervals they're talking about the 95% confidence interval and they use this 1. 6 number and 99. 7% of the data will be in three St standard deviations so you can see if you're outside the third standard deviation you are a pretty rare bird For Better or Worse depending upon which side all right so let's apply the empirical rule to our roulette game so I've got my three roulette games as before I'm going to run a simple simulation um and the key thing to notice is really this print statement here right that I'll print the mean which I'm rounding and then I'm going to give the confidence intervals plus or minus and I'll just take the standard deviation time 1.
6 * 100 why time 100 because I'm showing you percentages all right so again very straightforward code just simulation just like the ones we've been looking at and uh well I just I don't think I'll bother running it for you in interest of time you can run it yourself but here's what I got when I ran it so when I simulated betting a pocket for 20 trials we see that the of a th000 spins each for a th000 spins the expected return for fair roulette happened to be 3.
Related Videos

50:29
7. Confidence Intervals
MIT OpenCourseWare
175,600 views
10:06
Monte Carlo Simulation
MarbleScience
1,464,674 views

31:18
The Story of Shor's Algorithm, Straight Fr...
Qiskit
535,885 views

20:07
Monte Carlo Simulation For Any Model in Ex...
Minty Analyst
108,374 views

51:31
11. Introduction to Machine Learning
MIT OpenCourseWare
1,644,752 views

1:03:43
How to Speak
MIT OpenCourseWare
19,406,075 views

15:11
Bayes theorem, the geometry of changing be...
3Blue1Brown
4,380,689 views

1:09:58
MIT Introduction to Deep Learning | 6.S191
Alexander Amini
533,756 views

54:24
26. Chernobyl — How It Happened
MIT OpenCourseWare
2,869,812 views
31:33
The Oldest Unsolved Problem in Math
Veritasium
9,603,141 views

19:14
Monte Carlo Methods : Data Science Basics
ritvikmath
120,641 views

1:16:07
Lecture 1: Introduction to Superposition
MIT OpenCourseWare
7,469,308 views
1:03:30
Lecture 1: Introduction to CS and Programm...
MIT OpenCourseWare
664,419 views

12:46
Importance Sampling
Mutual Information
60,535 views

1:02:34
MIT Godel Escher Bach Lecture 1
jasonofthel33t
488,528 views

16:07
Jim Simons: A Short Story of My Life and M...
The Abel Prize
687,040 views

4:35
What is Monte Carlo Simulation?
IBM Technology
259,212 views

17:25
The better way to do statistics
Very Normal
216,563 views

49:34
16. Learning: Support Vector Machines
MIT OpenCourseWare
1,998,056 views

27:23
How to: Monte Carlo Simulation in Python (...
Mr. P Solver
61,624 views