This Trend Indicator Also Filters Out Ranging Markets!
40.3k views1482 WordsCopy TextShare
PineTrades
📈 Discover the power of the Trend Levels Indicator by ChartPrime! This versatile tool not only iden...
Video Transcript:
this is a ranging market and it was identified and filtered out by this indicator how did it do that you may be thinking well by using the trend Delta value this number right here as long as it's less than 80% then the market is more likely to be in a Range rather than trending this was another ranging market and was identified and filtered out by the same indicator because as you can see the Delta value was again less than 80% and the same thing goes for this ranging Market the Delta value was less than 80%
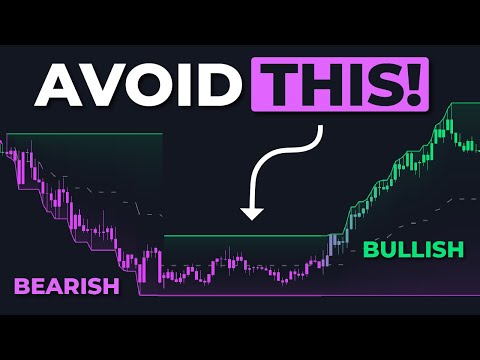
the reason why I love this indicator so much is because it not only identifies the trend of the market as bullish and bearish but it also tells you exactly when the market is ranging helping you to avoid false signals when trading in this video we're going to go over exactly what this indicator is let's get into it now to get started with this indicator you want to go to trading view after you've loaded up any trading asset that you like you want to open the indicator search Tab and type in Trend levels you want to
select this one by chart Prime the trend levels indicator by chart Prime is a tool designed to help Traders identify key levels within the trends of the market it's also used to gauge the strength of these Trends which is going to be directly applicable to how this indicator filters out ranging markets as you can see it's a super simple indicator which is made up of the the following components first we have the colorcoded trend ribbon which is made up of a high level line at the top and a low level line at the bottom the
high level line marks the highest price level within the trend and often serves as a resistance level in an uptrend conversely the low level line marks the lowest price point within the trend and often serves as a support level in a downtrend we also have the midline which is this line in the center that marks the middle level between the high and the low lines acting as a potential pullback or rejection Zone next we have the trend shift arrows which are these purple and green arrows that are printed whenever the trend shifts from bearish to
bullish and vice versa as you can see a green arrow is printed whenever the trend transitions from bearish to bullish conversely a purple arrow is going to be printed whenever the trend shifts from bullish to bearish now above we have a table that shows what symbol the indicator has been applied to if you didn't already know at the same time we have the trend Delta value for some reason they just called it Trend and then they put a value here in percentage to represent the strength of the trend but for the description of this indicator
it's actually supposed to be called the trend Delta so I'm going to be calling a trend Delta now in an uptrend this trend Delta value represents the percentage of candles that opened and closed above the midline as you can see it says 92.1 n% meaning that throughout this bullish trend from here to here we had a few candles that closed below the midline but the candles that opened and closed above it constituted a total of 92.1 n% now for a bearish trend like this you can see that the trend Delta is 74.5 2% meaning that
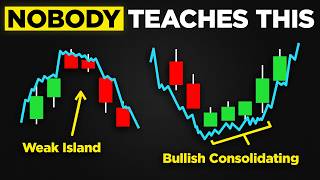
during this bearish trend all the candles that opened and closed under the midline constituted 74.5 2% of the total candles within this bearish Trend when using this indicator to identify bullish and bearish Trends in the market you want this number to be as high as possible to guarantee success in your trades for my recommendation you should always aim for 80% all the way to 100% this indicator also changes the color of the candles according to the trend of the market green for bullish purple for bearish we also have a gradient of purple and green for
when the market is trending but with super weak momentum these are the areas where you wouldn't want to be taking any positions next we're going to go over how we can use this indicator to trade but before we do that let's take a look at the settings and see how customizable this indicator can be as you can see here we can change the length which specifies the look back period used to calculate the highest and lowest values which then determine the trend levels and then here we can change the up and down colors and then
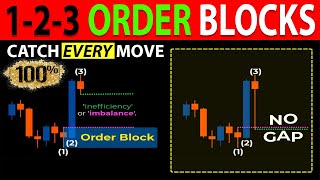
the style tab allows you to disable any of these options after you've made your changes click okay okay now using this indicator to trade is as simple as this to take a long trade condition number one is you want to confirm that the trend is bullish to do that you want to ensure that these candles are colored bright green like this to indicate a bullish Trend condition number two we want to wait for a gap of at least five candles and then have the price come back down and retest the midline of the trend ribbon
with the wick a gap of five candles basically means that no candle should touch the the midline for at least five candles before the retest keep in mind that the retest itself needs to be subtle so a candle can touch the midline with the wick and then the price has to close back above the midline but if a candle closes under the midline then the next candle would need to close above the midline for this particular trade this is our pullback now our last condition is to ensure that immediately after the pullback the trend Delta
is exactly 100% meaning that none of these candles during the uptrend opened and closed under the midline which basically means that this trend is strong enough to push the price in the direction of our trade we enter our long position here put the stop loss at the low level line which is this one the take profit is going to be set at two times the risk letting the trade run and as you can see it was profitable now this long position was valid because as you can see the trend was bullish indicated by the bright
green candles above the midline at the same time we had a pullback that happened after a gap of five candles which makes this pullback a valid pullback looking at the pullback candle itself we can see that it touched the midline only with the wick if we hide the indicator for a bit we can see that it's actually a bullish candle meaning that this is going to be our entry candle no need to wait for any other candles lastly you can see that here we have the trend Delta which was at 100% we take this trade
stop loss at the bottom level targeting two times the risk as you can see the trade was profitable here we had a short position the trend was bearish as indicated by the purple candles and then we had a gap of several candles before the price did a pullback the pullback was confirmed when this candle touched the midline with the wick lastly we can see that the trend ZTA was at 100% meaning that this trend is strong enough to push the price down we enter a short position here put the stop loss at the upper level
of the trend ribbon targeting two times the risk and as you can see the trade was profitable so as you can see by looking for a trend Delta value of 100% we are able to avoid trading when the market is ranging or consolidating because most of the time during ranging markets the Delta value is often less than 100% it usually goes as low as 10% or 20% this indicator essentially helps us avoid ranging markets and only allows us to capitalize on strong bullish or bearish momentum ladies and gentlemen this is the trend levels indicator by
chart prime a comprehensive tool for visualizing key Trend levels assessing the strength of the trend and identifying ranging or consolidating markets if you want to check it out you can find it on trading View and remember this video is not Financial advice well that's been it for this video I really hope you found some value if you did remember to leave a like or even consider subscribing to stay tuned thanks for watching and I'll see you next time
Related Videos
10:48
This Indicator Can PREDICT Future! It Give...
Soheil PKO
610 views
12:42
1 Indicator, 3 Uses! Most Powerful Trading...
PineTrades
171,716 views

21:58
How I Nailed Trading with the MACD Indicat...
Ross Cameron - Warrior Trading
418,550 views

21:49
Convert TradingView Indicators into Strate...
Michael Automates
343,678 views

30:19
I Never Shared This Scalping Trading Strat...
The Secret Mindset
106,457 views
9:55
This Zero-Lag BUY SELL Indicator Makes All...
PineTrades
52,863 views

39:19
Support And Resistance Didn't Work Till I ...
Rayner Teo
1,890,236 views
28:20
Trading Candlesticks Didn’t Work Until, I ...
Riley Coleman
15,267 views

18:20
Improve TradingView Strategy with AI (add ...
Michael Automates
41,637 views

29:09
JUST IN: Thom Tillis Gets Into Heated Exch...
Forbes Breaking News
539,280 views

10:38
UAP Hearing EXPOSES Secrets, Trump WILL Di...
The Hill
90,896 views

14:29
The 8 Second Chart Decoding Trick - No Ind...
Trader Dale
82,652 views

18:58
JUST IN: Donald Trump Gives Remarks At AFP...
Forbes Breaking News
255,537 views
18:19
🔴 1-2-3 ORDER BLOCKS Trading Strategy Ban...
Trader DNA
94,254 views
30:40
Wall Street Loves To Do This…
FX Evolution
41,057 views

11:58
This Oscillator Tells You Exactly Where To...
PineTrades
110,263 views

55:11
Master This ONE Candlestick Pattern TODAY ...
Ross Cameron - Warrior Trading
949,084 views

4:46
The 3 BEST Free Buy & Sell Indicators!
ChartPrime
11,665 views

12:26
Trading Without Indicators Proves 89.58% P...
The Transparent Trader
196,496 views

15:54
Migrant Gang Invades Queens NYC… Before Tr...
Cash Jordan
912,440 views