ICT Candle Range Theory (CRT) Explained: Easily Predict Smart Money Moves
182.58k views2590 WordsCopy TextShare

Pro Trading School
Candle Range Theory Explained: Master Price Movements & Predict Smart Money Moves
In this video, we...
Video Transcript:
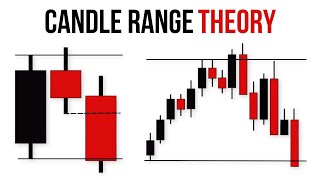
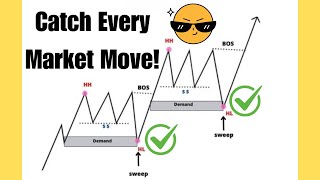
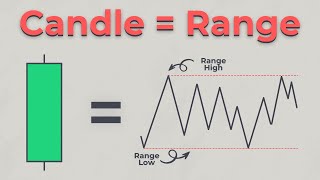
hey Traders welcome to another episode of prot trading school today we're diving into candle range Theory an advanced trading concept that can supercharge your win rates by mastering CRT you'll learn how to predict price movements and candle formations with Precision putting you in sync with institutional Traders rather than being caught on the wrong side of their moves in this video we're going to cover some key Concepts that will help you fully understand and master candle range Theory here's what we'll dive into what is candle range Theory the power of three how accumulation manipulation and distribution work in the markets how smart money uses the power of three to trap retail Traders how to predict smart money moves before they happen using CRT candle range Theory pattern types time frame breakdown for CRT execution key times for high probability CRT setups practical examples of trading high probability CRT setups so stick around by the end of this video you'll have a powerful tool in your trading Arsenal can range theory is built on a simple yet profound idea every Candlestick on a chart reflects a range of price action when viewed from a higher time frame this candle represents the broader Market's movements and when zoomed into a lower time frame you'll notice the micro movements forming within that range here's what you need to know every candle has a high and a low these points form a price range as you zoom into a lower time frame this range becomes clearer and forms the basis of the CRT strategy in markets price moves through three main phases accumulation manipulation and distribution or what we call the power of three these phases represent the cycle the market constantly moves through accumulation this phase is where price consolidates and moves sideways Gathering liquidity manipulation here the market pushes price Beyond key levels to trigger stop losses grabbing liquidity distribution after manipulation price reverses and moves in the opposite direction to to distribute liquidity the power of three is essentially the heartbeat of the market understanding these phases is crucial for applying CRT effectively to spot high probability trades how smart money uses the three Market phases to trap retail Traders let's start with the accumulation phase in this phase smart money begins to build their positions while keeping the market relatively flat you'll often see this as consolidation or sideways movement on the chart the price stays contained within a defined range and it looks like nothing major is happening when we zoom out to the higher time frames such as the daily or 4-Hour chart this accumulation phase often shows up as a narrow-range candle or a series of small candles moving sideways the purpose of this phase is simple smart money is preparing for the next stage the manipulation phase they are quietly accumulating long or short positions all without triggering large price movements now let's move on to the manipulation phase this is where smart money grabs liquidity by by triggering stop losses they deliberately push the price below support or above resistance causing retail traders to exit their positions or enter new ones thinking the market is breaking out when we observe this phase on higher time frames such as the daily or 4-Hour chart we'll often notice long Wicks or Shadows extending below the candle's low in a bullish setup or above the candle's high in a bearish setup these Wicks represent the market manipulation where smart money collects liquidity this is where candle range Theory or CRT becomes especially useful CRT helps us spot this manipulation by observing these sharp movements on higher time frames for example if you see a long Wick below a support level on the daily chart it's a sign that the price was deliberately pushed down to trick Traders into thinking a breakdown was happening once the liquidity grab is complete the price usually reverses marking the start of a bullish move now let's discuss the distribution phase after the price has moved up or down following the manipulation phase smart money starts off flating their positions they do this while setting up another liquidity trap this time at the resistance level in a bullish setup retail Traders are often lured into buying at the top thinking the price will continue Rising but instead the price reverses sharply on higher time frames such as the daily or 4-Hour chart we typically see a long Wick above resistance in a bullish Trend this Wick indicates that smart money is offloading their positions while trapping Traders again the Shar sharp reversal that follows confirms the distribution phase candle range Theory or CRT helps us recognize this setup by focusing on price action near the high of the candle range if the price Wicks above the high and then reverses it's a clear sign that smart money is Distributing their positions let me give you a practical example to understand how you can predict smart money behavior before they even act look at this candle on the hourly time frame with a defined high and low the price briefly drops below the low and forms a lower Wick before closing back inside the range this Wick represents smart money's attempt to grab liquidity from stop losses placed below the support level on a lower time frame like the 15-minute chart this movement would appear as a sharp downward Spike triggering retail traders to sell however using CRT on the hourly chart we can identify this as a liquidity grab the quick reversal after the wick suggests that smart money is preparing to push the price higher as a retail Trader when you switch to the lower time frame such as the 15-minute chart in this trading scenario you will find that the market has already made the liquidity grab and closed above the support level presenting a trading opportunity you would enter at the close of the bullish candle with your stop- loss placed 10 Pips below the higher time frames low your target can be set at the next higher time frames resistance which in this case is the hourly chart all right now that we've walked through a practical example of how CRT plays out in real market conditions let's shift gears and talk about CRT pattern types recognizing these patterns is key to spotting high probability setups and improving your trade entries so let's break down the different types of CRT patterns you'll want to master let's start with the standard three candle CRT pattern this is one of the most important setups you'll need to recognize when using candle range Theory first you'll notice the first candle which establishes the range by setting the high and low of the market for that time frame next comes the second candle this is where smart money creates a manipulation move usually by making a false breakout or breakdown to trap retail Traders then the third candle gives you the confirmation it closes back inside or above the range signaling the start of the reversal here's how you can use it by identifying this pattern on a higher time frame you can avoid getting caught in false breakouts instead you'll position yourself to trade in the direction of the market after the manipulation phase has completed now let's move on to the inside bar CRT pattern another key setup you should be familiar with here's what happens the inside bar forms when a candle stays completely within the range of the previous candle this often indicates Market indecision or consolidation smart money is waiting for the right moment to strike your job is to watch closely for Price manipulation around this inside bar when a false breakout happens whether above or below the inside bar that's your signal once the price reverses it creates a perfect opportunity for you to jump into the trade and ride the sharp movement in the opposite direction now let's talk about the multi- candle range expansion pattern this one is a bit different from the standard three candle setup because it involves more than three candles forming a larger range you'll notice that with this pattern the market takes its time to build up a range that's what makes it so powerful smart money is laying the groundwork before creating a liquidity grab and when that liquidity grab happens it sends a much stronger signal for you to act on your focus here is to watch for one or multiple candles that Wick below the low or above the high of the range once the breakout finally occurs the move is often much stronger giving you a great opportunity to capitalize on that momentum all right Traders now let's dive into one of the most important aspects of trading CRT time frame analysis this is key to making your trades as precise as possible here's how it works when you spot a CR pattern on a higher time frame you don't just stop there you zoom in to a lower time frame to find your entry point and make sure your timing is spot on for example if you see a CRT setup on The Daily time frame your lower time frame for execution is the hourly chart why because the hourly will give you a clearer view of price action within that daily range allowing you to place more accurate entries and exits now if you spot a CRT on the 4-Hour time frame drop down to the 30- minute chart to refine your entry the smaller time frames provide insight into price movements that aren't as obvious on the higher time frames some so-called gurus who have never traded recommend the 15-minute time frame as the lower time frame for the 4-Hour chart however after testing 3,500 setups we found that the best and most accurate lower time frame for the 4-Hour chart is the 30- minute time frame for a CRT on the hourly chart you'd want to zoom into the 15minute chart for more precise entries some Traders recommend using the 5-minute chart but in my experience combining the hourly and 15minute time frames provides great results and finally if you're analyzing the 15-minute chart the 1 minute time frame is where you'll find those quick scalp opportunities let me show you a practical example of how you can use top- down analysis with candle range Theory to make smart trades let's say the price creates a candle with this high and this low the key moment happens when the price briefly dips below the low during the day forming a long Wick and then closes back inside the range what does this tell us that long Wick is a clear sign of a liquidity grab smart money pushed the price below support to trigger stop losses of retail Traders forcing them to sell or exit but as the price closes back inside the range it's signaling that smart money has finished their manipulation and is preparing to push the market higher now that we've identified the manipulation phase on the 4-Hour chart we zoom into the 30-minute chart to to get a closer look on the 30-minute time frame we can clearly see the sharp drop below the low this is the liquidity grab that took place afterward the price starts reversing back up this is your opportunity as you can see the market closed above the low of the 4-Hour time frame so you can use this candle as your entry place your entry at the close of this bullish candle that formed after the liquidity grab set your stop loss just below the wick and your target can be the next high of the 4-Hour time frame as you can see the market moves perfectly to the Target because the trade was based on one of the most powerful trading strategies candle range Theory now that we've walked through how to use time frame analysis to master CRT setups let's take it up a notch if you really want to take your trading to the next level you need to understand that timing is just as crucial as spotting the setup itself because here's the truth not all candle range setups are created equal and one of the biggest factors that separates a winning trade from a losing one is when you catch it so let's dive into the key times that can make or break your CRT trades for Forex Traders here are the most important times to keep in mind 1:00 a. m. 5:00 a.
m. 9:00 a. m.
1 p. m. 5:00 p.
m. and 9:00 p. m.
these times are crucial because they align with key Market sessions like the London open at 5:00 a. m. UTC and the New York open at 1: p.
m. UTC these are periods when liquidity is at its highest in volatility spikes this makes it the perfect time for spotting CRT setups especially during session overlaps when two major markets are open at the same time for futures Traders here's when you want to be paying attention 2 a. m.
6: a. m. 10: a.
m. 2: p. m.
6 p. m. and 10: p.
m. these times align with high volume periods especially during the London and New York sessions trading CRT setups during these key hours gives you the best shot at catching liquidity shifts and Market manipulations when institutional Traders are most active let me give you an example as you can see here this is a candle range with a defined high and low on the hourly chart this candle represents an accumulation or a distribution phase so we need to wait for the second candle to break below the low or above the high and then close inside the range look at what happened next the second candle breaks above the high and if you check the time you'll see that this candle which purged the range formed at 1M UTC this time is crucial because it marks the opening of the New York session during the London session the market was trending upward following the accumulation phase and at the start of the New York session the market created a liquidity grab signaling the beginning of the distribution phase that's why the 1 p. m.
Related Videos

15:05
Candle Range Theory Explained and Simplifi...
Smart Risk
592,858 views
29:30
Candle Range Theory | CRT Simplified
ETM FX
126,208 views

27:12
Authorities reveal cause of death for acto...
ABC 33/40
392,528 views
7:04
Bolton has theory on why Trump threatened ...
CNN
269,878 views
28:44
Top 6 ICT Concepts for Successful Smart Mo...
Pro Trading School
71,305 views

19:17
Liquidity Concepts Explained: My Key to Ma...
Smart Risk
215,887 views
19:40
Candles are Range Theory (CRT) | The Final...
~ C
158,800 views

24:07
Jon Stewart on Trump’s Heel Turn on Zelens...
The Daily Show
7,205,145 views
23:21
Top Liquidity Sweep Trading Strategies for...
Pro Trading School
59,523 views

55:11
Master This ONE Candlestick Pattern TODAY ...
Ross Cameron - Warrior Trading
1,340,749 views
19:19
ICT Daily Bias Was Hard, Until I Understoo...
Justin Werlein
200,069 views

16:55
🔴 The MOTHER of All Indicators (Dangerous...
Trader DNA
339,225 views

45:59
The 3 Scalping Setups That Make Me A Livin...
Etienne Crete - Desire To TRADE
635,714 views

15:17
Liquidity Run Or Liquidity Sweep ( Purge O...
ETM FX
609,537 views

18:39
Candle Range Theory Explained
Solomon King
52,291 views

30:38
Jesse Watters Primetime 3/7/25 FULL HD | B...
NVT HomeMade
520,671 views

19:48
Master Trendline Trading With This Simple ...
Pro Trading School
12,427 views

17:39
Zelenskyy’s SHOCKING Offer to NATO SHOCKS ...
The Military Show
699,058 views

16:16
Order Block Simplified - Smart Money Course
Smart Risk
1,072,003 views
23:20
Candle Range Theory (CRT) - Everything To ...
Mulham Trading
113,978 views