The Range Filter! The Most Accurate BUY SELL Indicator Of 2024
18.58k views1471 WordsCopy TextShare
PineTrades
🎯 Looking for a strategy to cut through market noise and find high-probability trades? In this vide...
Video Transcript:
ah Buy sell indicators we all love them they tell you when to buy and you buy they tell you when to sell and you sell most of the time these indicators have lots and lots of false signals but in this video I'm going to Showcase a buy sell indicator that is decent even on its own and then I'm going to combine it with arguably the best trend indicator I've ever discovered to filter out the false signal and produce a super profitable trading strategy if you happen to find Value in this video remember to leave a
like let's get into it now to get started with this indicator you want to go to trading view which is the trading platform that I'm going to be using if you need to sign up there's going to be a link in the video description for you to do that next you want to load any trading security that you like in any time frame for me I'm going to be using the 5 minute time frame of jbp JPY and then you want to click on indicators and type in range filter by and sell and you want
to select this one by this trading view user now at this point in time I know you may be thinking but what exactly is the range filter buy and sell well the magic behind the range filter lies in how it Smooths out the price movements now I need you to think of this as a noise canceler for your chart instead of showing you every tiny wiggle in price it waits until the price moves Beyond a certain range threshold before signaling a potential Trend change this approach draws inspiration from volatility based indicators like the qqe but
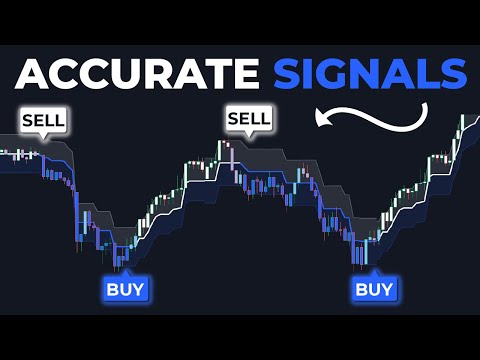
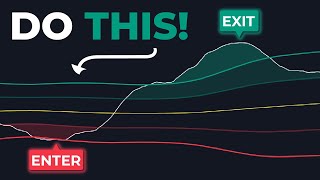
it then applies the logic directly to price data essentially the indicator identifies a smooth average price range and then uses a multiplier to determine what counts as meaningful price movements this indicator is made up of the following components first of all we have the range filter this white line which also changes color to Blue depending on on the trend of the market if the market is bullish the range filter is going to be colored white as you can see the candles are also going to have the same color but if it's a bearish trend the
range filter is going to be colored blue the same is going to be reflected on the candles now up at the top we have the high Target and then at the bottom we have the low Target these are basically the areas that you can use as the trailing stoploss for your entries the area in between the targets and the range filter is filled with a gray color at the top and a blue color at the bottom we also have buy and sell labels that indicate when the price breaks outside the range area the gray area
at the top is called the high target range and then the blue area at the bottom is actually called the low target range now if the price breaks and closes above the high target range a Buy Signal is going to be printed conversely if the price breaks under the low target range a sell signal is going to be printed now let's take a look at the settings of this indicator and see how customizable it can be now here we have the source and then the length has a default value of 100 if you want the
indicator to be more sensitive to price changes you can lower the sampling period but if you prefer a longer term view of the market you may want to increase this number now the same thing applies to the range increasing it widens the range generated by the indicator as you can see but then lowering this number is going to make the range narrower and n narrower for me I'm going to stick with a default value now this style tab has several customizable visual options that you can toggle on or off um after you've made your changes
assuming you had any you may want to click okay this is a buy sell indicator but can also be used to identify the trend of the market a bullish trend is identified whenever the candles are colored White and the price is trading above the range filter consistently heading upwards conversely if the candles are colored blue with a price Trading below the range filter and head it downwards then that is going to be a bearish trend but in order to take advantage of these buy and sell signals we need to add an indicator known as the
volumatic variable index Dynamic average or the video indicator this one by big Beluga double click on it and then you want to change the video length to 34 after that click okay also you want to double click on the Range filter and then on the style tab you want to disable the range filter the high Target the low Target the bar color as well as the high target range the lower target range and then click okay so we're only going to be left with the buy and sell labels the video indicator is a trend indicator
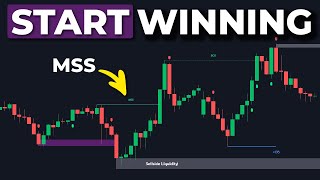
one of the best I've ever discovered and I actually created a video to talk about what exactly this indicator is but a simple explanation is this it identifies bullish and bearish Trends in the market but what makes this indicator even better is that it gives you the volume data at each point within a trend helping you to know when to trade and when not to trade so this indicator not only identifies the trend Direction but also the strength of the trend now here's how to take a long position with this strategy condition number one you
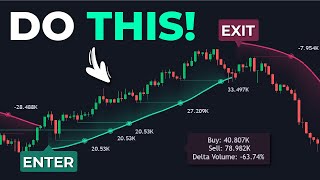
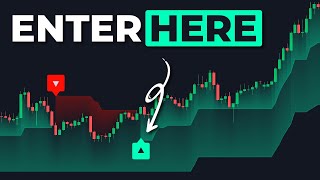
want to have a Buy Signal printed by the range filter indicator once you have it you want to ensure that the trend of the market is bullish which means you need this trend ribbon to be colored green like it is right here then lastly to ensure the trend is strong enough and increase the chances of the price going up we need to take a look down here the Delta volume is supposed to be at least 20% the Delta volume is actually the difference between the volume for all the bullish candles and the volume for all
the bearish candles within this specific Trend so it basically takes the buy volume value minus the sell volume value and expresses it as a percentage having a minimum of 20% increases the probability of the price going up right here we can see it's well above the 20% limit so we take a long position the stop loss is going to go under the most recent swing low targeting 1.5 times the risk letting the trade run and it was profitable now to show you the power of this strategy you can see that we had another long position
just a few candles later we had a Buy Signal the trend of the market was bullish and then the Delta volume was above 20% if we were to take this trade you can see it would have been profitable now to take a short position it's basically going to be the opposite so you want to have a sell signal printed within a bearish trend the trend is going to be identified as bearish whenever the trend ribbon of the vidi indicator is red and then to confirm the trend is strong enough to push the price down we
need the Delta volume to be at least minus 20% and this number should be increasing towards the negative side here we can see it's at minus 34 which is larger towards the negative side when compared to our minimum of minus 20% we take a short position the stop loss is going to go above the most recent swing High the take profit is going to be set at 1.5 times the risk looking at this the trade was profitable in summary the range filter strategy combines buy and sell signals with the viia Trend as well as the
Delta volume analysis to filter out FSE signals ensuring trades align with strong bullish and bearish Trends in the market if you want to check out this indicator well you can find it on trading view that's been it for this video I really hope you found some value if you did remember to leave a like or even consider subscribing to stay tuned thanks for watching see you next time
Related Videos

23:55
Masterstroke or Death of Democracy: One Na...
Think School
247,682 views

18:00
Best CCTV Fails of 2024 | Try Not to Laugh 😂
FailArmy
528,989 views

12:00
'Whoa': Biden can checkmate Trump's reveng...
MSNBC
89,763 views

10:39
I Remade Star Wars VFX in a Week
ErikDoesVFX
1,539,977 views
12:42
1 Indicator, 3 Uses! Most Powerful Trading...
PineTrades
328,407 views

30:40
Incredible Moments Caught on Camera
UNSORTED
7,745,208 views
11:17
Premium Indicator, Now FREE! 99% Accurate ...
PineTrades
141,392 views

21:49
Convert TradingView Indicators into Strate...
Michael Automates
586,913 views

15:49
Kennedy Reveals Shocking 'Fraud' That's Se...
Forbes Breaking News
1,219,843 views
7:39
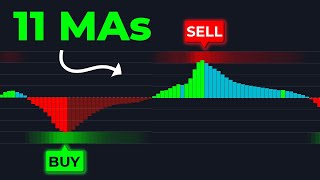
11 Moving Averages In One! THIS Oscillator...
PineTrades
39,864 views

18:26
10 NEW Costco Deals You NEED To Buy in Dec...
The Deal Guy
566,312 views

8:55
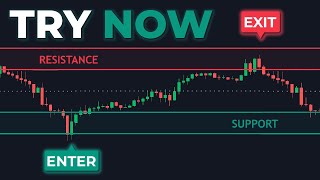
This Trend Indicator Also Shows EXACT Supp...
PineTrades
73,196 views
12:21
This 1 Indicator Identifies Both Momentum,...
PineTrades
51,044 views

7:57
Elon Musk sends message to Republicans: Th...
Fox News
595,195 views

22:04
Once you breathe like this, reality shifts
Solace Owl
1,697,236 views

59:43
The Failure, Fear, And Frenzy around Luigi...
Josh Johnson
812,763 views

14:29
The 8 Second Chart Decoding Trick - No Ind...
Trader Dale
145,465 views

55:05
900%+ Return In 11 Months: How To Identify...
Investor's Business Daily
14,936 views
9:50
Best All-in-One Indicator For Accurate SMC...
PineTrades
16,497 views
8:34
NEW Supertrend Indicator Uses Machine Lear...
PineTrades
38,778 views