The ULTIMATE Beginner's Guide to the DOW THEORY
126.08k views5142 WordsCopy TextShare
Fractal Flow - Pro Trading Strategies
This is a video about the Dow Theory.
FRACTAL FLOW WEBSITE: https://www.fractalflowpro.com/ (better...
Video Transcript:
welcome to the ultimate beginner's guide to the dow theory in this video you'll understand the basics of one of the most famous charting techniques in the world the ultimate beginner's guide series aims to reveal the advantages and the disadvantages of any technique no matter how popular it is so in this course you are also going to learn the flaws of the dow theory and some challenges that most educators hardly ever talk about before we begin you should understand that this video is made for educational purposes only if you decide to use the trading techniques presented
in here do it at your own risk in this course you are going to learn the origin and a brief historical context in which the dial theory was born and the six fundamental principles behind the theory within the six fundamental principles you'll learn the three types of price movements how to identify a trend change how to determine if the trend is going to continue how to use different stock averages to confirm the long-term trend how to use volume to confirm price direction the three different phases of both and bear markets and last but not least
you are going to learn the advantages and disadvantages of the theory as well before we move on to the actual rules and guidelines of the dow theory we should quickly remember the context in which he was born the man behind the theory that we're going to study today was a journalist called charles dell born in 1851 in new york charles dall was very interested in the understanding of how markets behaved in conjunction with edward jones and charles bergstrasser charles dowd created the dow jones and company the financial publishing firm responsible for the wall street journal
back then many of these stocks had an overly chaotic movement because of low liquidity and the absence of strong regulation which facilitated stock manipulation for that reason charles dalt had the idea of creating stock averages which is nothing more than the sum of similar stock prices divided by the number of stocks being summed this gave an overall feeling of similar stocks while smoothing out the erratic movement of individual stocks these averages were published in the wall street journal and they are still widely used today the dow jones industrial average is the average of the 30
largest and most important american companies we are talking about companies like apple coca-cola nike walt disney visa microsoft and others in this image we can see the weekly chart of the dow jones industrial average since the 1950s there are other averages like the dow jones transportation average and the dow jones utility average also charles dall's ideas of how the market behaved were later developed by william p hamilton after charles dowd passed away in 1902 the doll theory is based on investor psychology and it is supported by chart analysis the theory outlines six fundamental principles that
will theoretically allow the trader or investor to write the long-term trends of the market the theory provides rules and guidelines to identify reversal signals along with confirmation of these signals the identification of the different phases of bull and bear markets based on basic investor psychology the best way of understanding the theory is to go through each of the six fundamental principles one by one while analyzing their properties the first principle claims that the average discounts everything except what charles dow used to call acts of god even though this is a short principle we must apprehend
what charles dow meant by the term discount and the expression acts of god what he meant by this county is that the stock averages will smooth out the chaotic movement of individual stocks in other words the stock averages will have a more stable movement in comparison to individual stocks in more practical terms the dow jones industrial average for example would have a smoother price action than looking at the individual stocks that composed the average there is a reason for that and it relates to the concept of systematic and unsystematic risk in the financial markets individual
stocks are subjected to the risk of the overall economy being affected and beyond that they are subjected to the risk of bad internal management meaning that the economy can be going well but if the company has a bad administration or suffers some sort of a specific negative event a stock price will tumble this internal risk associated with the company is called unsystematic risk also known as diversifiable risk the risk associated with the economy as a whole is called systematic risk the concept of stock averages attenuates the unsystematic risk of individual stocks very much like a
portfolio of stocks diversifies the unsystematic risk of for buy and holders for example if one of the companies that composed the dow jones industrial average suffers some sort of negative impact and that causes the stock price to fall while the average is going up the reflection of that movement in the average will be minimal since one company represents only a small fraction of the average as a result the average is more of a reflection of the economy as a whole or at least a sector while individual stocks are a reflection of individual companies and the
economy as a whole let's create a hypothetical stock average using five hypothetical stocks we have stocks a b c d and e and we are going to create an average of these five stocks notice that all of them are rising but they are different from one another the average will obviously reflect that remember that we calculate the average by summing the stock prices from the five companies and then divide this number by the number of stocks being summed which is five in this case the graph title average one is the resulting average of these five
hypothetical stocks now imagine the stock e fell instead if we compute the new average we'll observe that it still rises because all of the other stocks are rising and stock e only represents one-fifth of the average this example we are only using five stocks the dow jones industrial average uses 30 stocks so the effect of each stock in the average is much less powerful that's the advantage of using an average it smooths out the noise created by stocks that are going in the opposite direction of the market in general that's what charles dall meant by
the phrase that stock averages discount everything expression acts of god relates to events associated with the systematic risk or the economy as a whole these are the types of events that affect the economy in general and therefore all stocks in the average simultaneously in summary when analyzing stock averages we'll be looking at broader sectors of the economy and not individual stocks the second principle relates to the classification of trends before we understand that we must learn how the dell theory classifies price movements there are three types of price movements according to the theory the primary
trend which is the long term trend the secondary swings which are the midterm movements that happen within the primary trend in the daily fluctuations which are the short-term movements that happen within the secondary swings in the primary trend there is a useful analogy that ties these three movements together the primary trend is analogous to the ocean tides in other words very slow but very broad movements the secondary swings are like waves so they happen within tides they are smaller in size and shorter in time duration even though there is quite a bit of variation in
the size of waves the daily fluctuations are analogous to the ripples which are tiny variations compared to the tides for example in this illustration we have the primary trend or tide being represented in green this is the slow and broad movement of the market in red we have the secondary swings or waves which happen more frequently within the tides in blue we have the daily fluctuations or ripples these are small variations that happen within secondary swings in the primary trend the second principle of the dell theory tells us that when the primary trend shows rising
prices we have what's called a bull market when the primary trend shows falling prices we have what's called a bear market the use of the terms bull and bear is a simple analogy to the fact that bulls throw their preys up when they attack and bears throw their prey down when they attack traders are obviously interested in knowing when a bull market reverses into a bear market and when a bear market reverses into a bull market the dell theory provides two elements for detecting a reversal the first is a breakout signal which is a sign
that a significant reversal might occur and the second is a confirmation of that signal the reversal signal for a bull market happens when the market is going down and a swing high is broken the confirmation happens when the market hits a twenty percent retracement from the market low for example if the market low is ten thousand the twenty percent retracement in the case of a bullish reversal will be ten thousand plus twenty percent of that which equals twelve thousand the reversal signal for a bear market happens when the market is going up and a swing
low is broken the confirmation happens when the market hits a twenty percent retracement from the market high for example if the market high is 10 000 the 20 retracement in the case of a bearish reversal will be at 10 000 minus 20 percent of that which equals 8 000. notice that this has nothing to do with fibonacci retracements which are relative the 20 retracement confirmation from the dow theory relates to the absolute price value later in the course we'll see that identifying the reversal signal is not as easy as it looks because secondary swings vary
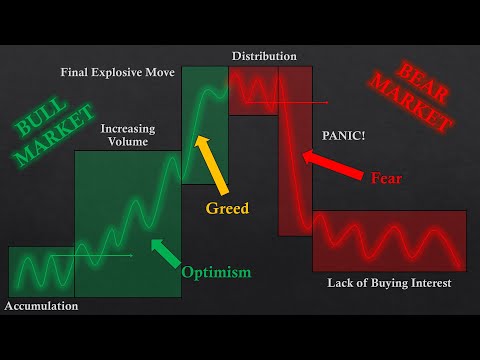
a lot in size in time duration and the market will often produce false breakouts due to a condition called expanding pivot formation we'll also observe some important problems with the reversal signals and reversal confirmations bull and bear markets have three distinct phases each let's begin first by looking at the different phases of a bull market the first phase of a bull market is called accumulation in this phase investors and traders tend to carefully choose the most discounted stocks to buy in technical terms an accumulation is a sideways market that happens before a net trend or
a bull market if we look at volume the accumulation phase is characterized by a sideways price movement while volume gradually rises if you want to learn more about volume trading check the ultimate beginner's guide to volume trading in the youtube card in the second phase of the bull market which is called increasing volume both price action and volume start to rise there's an overall sense of optimism in relation to the economy and secondary stocks also become an interesting choice for buyers if the trader looks at a cumulative volume indicator like the obv for example both
volume and price will rise indicating a strong bullish movement the third phase of a bull market is called final explosive move this phase is characterized by an overly optimistic bias about how much further stocks will rise people usually borrow money to invest in stocks and the valuation of companies is ignored excessive speculation and greed tend to occur in this third phase of a bull market in this final stage we can usually observe a more significant spike in volume when it comes to bear markets there are also three distinct phases the first phase is called distribution
and its main characteristic is that professional investors and traders are starting to sell while amateur investors and traders are still thinking it's a good idea to buy these are the traders who enter the bull market too late which facilitate the transfer of ownership of overbought stocks from professional investors to amateur investors second phase of a bear market is called panic which is marked by the amateur investors in traders realizing they bought stocks at unreasonably high prices so now they are any urge to liquidate their positions before they lose too much capital in general terms prices
fall faster than what they rise because panic is a stronger feeling than optimism and it creates more sense of urgency the third phase is called lack of buying interest even after the market has significantly dropped and most of the companies are extremely undervalued there's still a sense of pessimism in most traders and investors there is a general fear that prices will not stop falling the third principle in the dial theory is called principle of confirmation this principle states that for a real bull or bear market to exist at least two of the three dow jones
averages must be going in the same direction the three averages are the industrial transportation and utility each average reflects a different sector of the economy the goal of this rule is to assure that the trend is a result from a macroeconomic phenomenon and not just a trend contained within a specific sector of the economy if the three averages are going in the same direction or at least two of the three averages are going the same direction as the theory suggests it's a good indication that the economy as a whole is going in the same direction
notice that the third principle of confirmation in alignment with the second principle of trend identification gives a framework to analyze if there is a reversal signal and a confirmation in the financial markets as a whole the third principle in the dial theory is that volume confirms the trend as a general guideline volume increases at the peak of a bull market and at the panic phase of a bear market once again for a more detailed study of volume check out the ultimate beginner's guide to volume trading in the video card in basic terms the idea that
volume confirms price movement suggests the high volume confirms the strength of the price movement and low volume disproves it for example if price is rising and volume is increasing the price movement is confirmed if price is rising and volume is flat or even declining it means that the upward price move might not be as strong as it seems because there is not much volume to sustain it the same is also true for downward movements as well if price is falling the volume is rising the downward price movement is confirmed if price is falling and the
volume is flat or declining it means that the downward price move is not as strong as it seems to be since there is not much volume to back it up traders need to pay attention regarding this sort of thing because volume is an indicator of market activity and not market direction so when volume is rising for example it doesn't necessarily mean that price is rising it might be falling as well the fifth principle in the dial theory is that only closing prices are taken into account charles dao believed that the closing price was the most
important of the four prices which are open high low and close that's because many different types of traders execute orders near the close for example day traders close all their positions near the close and some hedge funds execute orders near the close as well closing prices alone tend to be easier to analyze because traders will not make any judgment about what happened inside each period even though it's easier to analyze a lot of important information is omitted when only closing prices are taken into account in modern price action analysis using the four prices contained in
a candlestick or bar is a pivotal part of the process as there are many nuances buried in the relationship between the four prices for example by analyzing the ratios between the four prices in a single candlestick we can roll back the internal history of the period we can make better judgments about the intentions of buyers and sellers the sixth and final principle of the dow theory is that the trend persists in other words a trend is assumed to continue in effect until a reversal signal is confirmed the dial theory makes no assumption about how much
a trend should last unlike other theories out there but it states that trades should be taken with the trend and the trend only ends when there is a clear reversal signal aligned with a confirmation given the rules already laid out in the course one thing that becomes clear while using the dial theory is that it's much easier to apply it in a bull market because bull markets tend to last longer and they have lower volatility which makes the signal and confirmation a little more reliable bear markets are usually shorter in time duration and the movements
are too volatile by the time the bear market signals are confirmed the market might already be too developed in this chart we can see an example of that during the 2008 financial crisis the bear market lasted about 516 days the next signal and confirmation for the bull market that came later happened arguably in 2010 and this bull market had been sustaining itself until the 2020 coronavirus pandemic hit the markets the market took 1 461 days to recover and come back to the top again since the lowest point of the 2008 financial crisis what is how
the bull market has lower volatility and longer time duration these are the six fundamental principles behind the dow theory let's make a brief summary of them the first principle claims that stock averages discount everything except what charles dao used to call acts of god second principle is about trend identification a bull market happens when the primary trend which is the largest and slowest price movement shows rising prices in a bear market happens when the primary trend shows falling prices beyond that a bull market shows three distinct phases called accumulation increasing volume and final explosive movement
a bear market also has three distinct phases and they are called distribution panic and lack of buying interest a bullish reversal signal happens when the market is going down and price breaks the last swing high a bearish reversal signal happens when the market is going up and price breaks the last swing low both of these signals are only confirmed when prices reverse 20 from their extremes in absolute terms the third principle states that for a trend to exist at least two of the three dow jones averages must be going in the same direction the fourth
principle states that volume confirms the trend so when the volume increases we have a strong price movement and when volume decreases we have a weak price movement the fifth principle states that only closing prices should be used in the analysis since that's the most relevant price among the open high low and close according to the dow theory the sixth and final principle is that the trend persists until there is a new reversal signal in alignment with a confirmation of the signal now we must move on to what i consider to be the most important section
of this course which is the analysis of the advantages and disadvantages of the dell theory this is important because most training educators will often highlight the advantages of some technique or method and ignore the disadvantages as if they were absent however for a proper and fair learning experience you should become aware of the limitations in any technique or method in fact the most value you can extract out of common trading methodologies comes from the understanding of their inherent limitations we start by quickly reviewing the advantages of the dell theory and then will attack the many
disadvantages present in the method the first advantage in the dell theory is that is based on investor psychology that does make a lot of sense even though it's not very sophisticated the phases of a bull and bear markets can indeed be observed over and over again and they do represent the cycle of emotions that usually appears in the markets the second advantage is that volume analysis that is aligned with the simple investor psychology also makes sense the simple premise the volume confirms price movement also seems to be an effective tool in all phases of bull
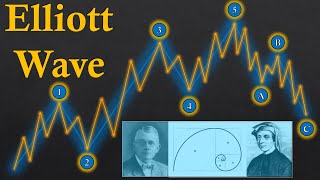
and bear market in its alignment with the various phases of bull and bear markets also make sense the good thing about volume is that it is devoid of lag the third advantage relates to the fact that the dow theory makes no assumption about how much a trend should last some theories like the elliott wave theory for example make bold assumptions about how many waves a trend should have in the ratios between the various waves the dial theory is a much looser method it assumes that the trend can persist until there is a clear reversal and
confirmation signal there is a much simpler and much more effective way of thinking because it lets the market show when it's time to update the analysis and not the other way around theories that try to box the market into a rigid set of rules tend to be ineffective the fourth and final advantage of the dial theory is that it is extremely simple to use the method has gained fame for its simplicity even though this tells us nothing about the effectiveness of the techniques involved just because something is simple doesn't mean it's good there are no
complicated concepts in the dell theory and that makes it easier for beginners to study its features as far as advantages go these are the most relevant notice that the advantages are very broad in general which is not a very good sign we must now move on to the disadvantages which are more numerous and unfortunately highly specific i say that this is unfortunate because the more specific the disadvantages the greater the probability that they will go unnoticed by most people most of the disadvantages of the dell theory are related to the chart analysis part of the
method as we just saw in the advantages the part related to investor psychology and volume analysis in the theory does make sense even though it lacks profound concepts however the chart analysis part of the theory is indeed very flawed and quite superficial let's begin first by talking about the problem of identifying secondary swing highs and lows which is a prerequisite for the detection of reversal signals secondary swings are similar to waves in the simple analogy made earlier the problem is that the secondary swings vary a lot in size and time duration that makes it difficult
to select the right swings in real time for the detection of reversal signals there are secondary swings there are quite small they could almost be mistaken by daily fluctuations other secondary swings on the other hand are quite large even though the dial theory is simple identifying the correct secondary swing highs and lows for the reversal signal involves quite a bit of discretion and the theory doesn't expand on how the trader should approach this type of discretion in great detail this leads us directly to the second disadvantage which is a trade-off between the secondary swing size
and the accuracy of the reversal signal larger secondary swings are easier to see but because they are larger they also provide reversal signals that are far from the actual reversal point of the market smaller secondary swings are harder to see because they can be confused with daily fluctuations but on the other hand they can provide a more accurate reversal signal speaking of inaccuracy the dell 3 provides the simplistic swing breakout as a reversal signal swing breakouts are the most inaccurate type of breakout signal because they are too obvious even traders who open price charts for
the first time can intuitively use swing breakouts as a technique without knowing it is a technique it's usually one of the first intuitions that occur when traders open a price chart and that is precisely what makes it bad in more technical terms the swing breakout is a bad idea because it completely disregards the idea of supply and demand trading when price breaks a swing high or a swing low the market has already extended itself past the optimal reversal point ideally traders should wait for a retracement near the last significant supply or demand zone if you
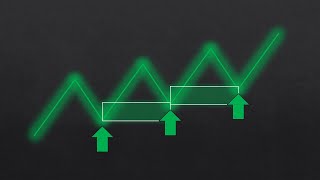
want to learn more about supply and demand trading check the ultimate beginner's guide to supply and demand trading in the youtube card one of the strongest pieces of evidence against the use of swing breakouts as a reversal signal lie in a situation called expanding pivot formation the situation is characterized by higher highs and lower lows in other words when the market gradually increases volatility and successively breaks highs and lows in alternative motion the sort of situation is deadly for someone following the dow theory rules and guidelines the expanding pivot formation will generate not just one
but a series of false reversal signals and that will obviously remove traders of trends that are not finished yet or get traders in trends that haven't really started in this illustration you can see how the creation of alternating swing breakouts will generate a cascading effect of false signals that will greatly diminish the effectiveness of the dell theory as far as reversal signals go dow theory enthusiasts will claim that the reversal signal should be confirmed with the 20 percent rule here lies yet another problem the 20 confirmation rule is completely arbitrary there is no reason to
believe that a 20 confirmation rule is better than a 15 or a 25 rule for example the other problem with this rule is that it diminishes the accuracy of the signal even more beyond that the twenty percent rule creates a gauging problem twenty percent reversal from market highs are larger than twenty percent reversals from market laws because a percentage of a large number is larger than the same percentage of a small number for example twenty percent of ten thousand is two thousand while twenty percent of five thousand is one thousand that means that a confirmation
of a bear market comes later than the confirmation of a bull market this leads us to another problem of the dow theory there is an asymmetry between bull and bear markets this asymmetry makes the dial theory much easier to apply in bull markets rather than bear markets that happens because the human emotions driving bow and bear markets are vastly different and that creates distinct statistical properties for bull and bear in a markets market you encounter emotions like optimism about how much further stocks will rise and greed in the final stages of excessive speculation in a
bear market you will find emotions like fear and panic in the more volatile phases the issue is that fear and panic are stronger emotions than optimism and greed because panic and fear are stronger emotions they trigger more irrational behaviors in traders and investors simply because strong emotions override rationality the nobel prize-winning psychologist daniel kahneman responsible for the prospect theory argues that the human brain has two basic modes the fast thinking mode and the slow thinking mode the fast mode is intuitive and automatic the slow mode is rational and deliberative under high psychological stress the fast
mode tends to be dominant that's where irrationality takes over to make traders make bad decisions all of that means that price falls much faster than what they rise this is a problem in the dell theory because by the time a reversal signal and its confirmation happens the bear market has already developed significantly meaning that the signal is too late that's why the dial theory works better in bull markets that asymmetry between bull and bear markets combined with the gauging problem of the 20 confirmation rule makes the dial theory especially inaccurate in bear markets bull markets
are less volatile than bear markets and they tend to last for longer periods of time this allows the trader following the dial theory to capture returns despite the inaccuracy of the method in bull markets bear markets tend to be faster and a lot more volatile and that makes it difficult to trade these markets using the dell theory the last disadvantage of the dial theory is the fact that traders are only supposed to use closing prices to analyze the market in modern price analysis it's known that the four prices of a candlestick are necessary to make
good judgments about the intention of buyers and sellers regarding the various barriers of price the use of closing prices alone is a simple but rudimentary way of simplifying the analysis and it comes with a cost ignoring the other prices contained in the price bar erases the very important nuances we can extract out of a price chart this concludes the ultimate beginner's guide to the dow theory i hope you were able to understand the basic fundamental principles of this theory and most importantly i hope you are able to understand its limitations also which is really important
any trading method strategy and technique has flaws so you should always strive to understand both advantages and disadvantages as this will give you an edge over traders who purposefully ignore the disadvantages that's it for this video if you enjoy the videos i create and wish to support the channel please click the like button subscribe to the channel activate the notifications button so you don't miss future uploads share the video and leave your feedback below in the comment section if you are interested in learning more advanced training techniques and methods please visit my website available in
the video description there you will find the table of contents of my paid courses and testimonials from students all over the world thank you very much for watching and i hope to see you in the next videos take care you
Related Videos

1:40:25
The ULTIMATE Wyckoff Trading Course
Fractal Flow - Pro Trading Strategies
881,905 views
32:09
The ULTIMATE Beginner's Guide to Supply & ...
Fractal Flow - Pro Trading Strategies
482,618 views
9:21
Dow Theory For Beginners
Market Misbehavior with David Keller, CMT
12,060 views

9:18
Stocks Off Session Lows in Final Hour | Cl...
Bloomberg Television
4,639 views

7:26
DOW THEORY - What is it & how can it be ap...
Financial Wisdom
75,873 views
35:38
The ULTIMATE Beginner's Guide to the ELLIO...
Fractal Flow - Pro Trading Strategies
297,006 views
42:54
Chronos: Time series forecasting in the ag...
AutoML Seminars
573 views

1:15:29
The ULTIMATE Beginner's Guide to SCALPING
Fractal Flow - Pro Trading Strategies
65,722 views

1:26:11
The ULTIMATE Beginner's Guide to FIBONACCI...
Fractal Flow - Pro Trading Strategies
17,962 views

27:28
16 Ways of Anticipating a TREND REVERSAL
Fractal Flow - Pro Trading Strategies
203,196 views
45:51
The ULTIMATE Beginner's Guide to CHART PAT...
Fractal Flow - Pro Trading Strategies
5,458,842 views

51:01
Master ORDER FLOW TRADING in Less than ONE...
Fractal Flow - Pro Trading Strategies
303,454 views

2:28:45
The Definitive Guide to Candlestick Patterns
Fractal Flow - Pro Trading Strategies
24,210 views

1:11:21
The ULTIMATE Beginner's Guide to CANDLESTI...
Fractal Flow - Pro Trading Strategies
5,310,457 views
1:00:02
The Only Chart Pattern Trading Video You W...
The Trading Channel (The Trading Channel)
1,876,197 views
15:58
Learn VOLUME SPREAD ANALYSIS in less than ...
Fractal Flow - Pro Trading Strategies
265,196 views
16:49
Elliott Wave Trading Was Impossible, Until...
The Secret Mindset
761,629 views

15:18
Top 8 Ways of Using the Andrews Pitchfork
Fractal Flow - Pro Trading Strategies
24,861 views

29:36
The ULTIMATE Beginner's Guide to VOLUME TR...
Fractal Flow - Pro Trading Strategies
130,223 views
1:14:47
The ULTIMATE Beginner’s Guide to Stock Opt...
Fractal Flow - Pro Trading Strategies
143,438 views