Beginners Guide To Reading A Price Chart (Price Action Trading)
59.91k views3823 WordsCopy TextShare
Thomas Wade
This video highlights one of the best scalping strategies that can be used in day trading. Whether y...
Video Transcript:
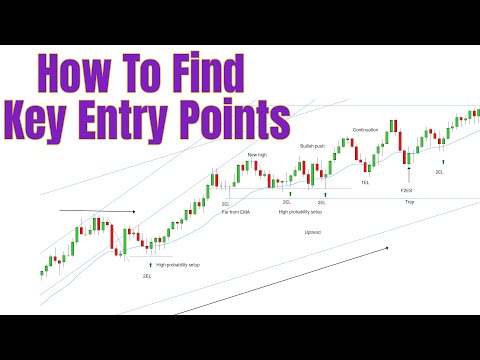
shadows in front of us we have 2000 tick chart for the s p 500 m in futures and as a price session trader my goal is to identify places on the chart where price will create a significant move and i can capitalize on this move in order for me to predict these moves i need to have a strategy that will help me to identify the spot on the chart in hindsight i can see that the structure was a bullish uptrend but how do i identify the proper places to enter when i'm watching this real time
this is a pure naked price session chart in front of us what i'm going to do i'm going to make my job a little bit easier and i'm going to plot the 21 bar expunge moving average the 21 bar exponential moving average is a supportive indicator only it tells me the bias and it serves as a key entry point which means when prices will pull back that the key entry point is from our exponential moving average i can expect under proper conditions for price to bounce off the exponential moving average now that's not the only
thing that i need to pay attention to as part of the strategy my goal is to take advantage of price action rules and wait for high probability setups on the right conditions at key entry points if you guys don't know what the price session rules are i made a video about five price session rules that you need to know you can go and check the video to make it a little bit more easier to understand now what is a high probability setup high probability setup it sounds simple but it's a two-legged pullback because market likes
to move in pairs of twos to like a pullback at the key entry point at the trend line support resistance line or the 21 bar exponential moving average once price creates two like a pullback i expect continuation of the trend as a price session trader when i'm trading a naked chart my goal is first to identify the pre-market structure before i start trading and i can take advantage of the information that was provided to me from the pre-market structure the first thing i can see is that yesterday's session ended very bullish you guys can see
ema pointing up and prices were creating series of higher highs higher lows and that price action was transferred into today's session as well ema keeps holding prices and we still keep pushing higher consistently so right now i have a bullish bias right from the get go what i'm going to do because i want to follow the trendline rule i'm going to draw my shortened channels in price action you guys can see we shorten uptrend break new extreme so i now need to draw a shortened downtrend like this and we have an overshoot for this channel
now you guys can see this is the overshoot this is unnatural activity in the market why am i not making the trend line wider because i'm bullish bias and also it fits nicely at the very beginning and these are three big bearish bars very steep move when the move is very steep i tend to trust this as an overshoot so i'm not extending the channel i'm treating this as a channel with the overshoot and overshoot leads to break of a trendline or possibly straight up reversal so this overshoot is giving me more confidence to my
overall bullish analysis and as price is creating break of a trend line and is pushing higher this is confirming that this is a bullish structure so i'm going to draw a shortened channel because i want to follow the trendline rule and right now i expect to get a two-legged pullback at the key entry point now a high probability setup can also be a fail to like a pullback that goes against the trend second entry short in a bullish trend under right conditions at the key entry point can be considered as a failure and i can
treat it as a high probability setup now we have a newer right here i reset the count here because price created first century short second entry short so i reset the account after significant even in the market and we have first century short second entry short again remember in bullish structure so i treat it most likely as a failure if it make its way to the key entry point now we have a small little trigger right here but when i was watching this live there was no tick lower so i'm going to make this lesson
as the prices were printing live otherwise the second entry short failure would be right here now notice what we have price is making its way all the way to the key entry point but at this point on prices are a little bit stacked and it's not touching the ema completely the body is very far from the ema but once we get a trigger above this bar right here this is the first bar of the second entry short trigger that we triggered above and this can serve as a felt second energy short so according to price
action rules this entry is decent but it feels a little bit stacked and not perfect at the key entry point so it's a little bit advanced but notice as price action is pushing higher i have to make the judgment i'm going to zoom out and i'm going to judge the structure and right now we keep pushing higher so what i'm going to do i'm going to identify a larger channel because right now this is looking like a stronger bullish structure than it did initially what i'm also going to do since prices creep getting multiple lags
to new extremes if i have a trendline that keeps creating multiple new extremes that means there's a probably a wider channel so i'm even going to extend the channel like this and prices are right now working higher but remember i'm following the price session rules so what is my main focus where is the high priority cell going to appear at the key entry point and what is the high probability set up a second in too long it's that simple the trend is bullish and i only want to take entries on a high probability setup i'm
not interested in chasing the market all the way up here far away from key entry point so this is the highest high where i'm going to reset the count and as i'm watching the market i can see that the price is created first century long pull back lower and we have second entry long forming where at the exponential moving average also i see a micro double bottom and i have a strong bullish uptrend and this shortened option needs to get new extreme according to trendline rule so this is a two legged pullback first leg down
second leg down it's simple but it works and this is the only setup i'm interested in and this is a high priority set up this is my first trade for the day it let me sweat a little bit because it took a long time before it eventually pushed higher but if you don't monkey with the stop your stop loss goes one tick below the signal bar and you cannot move the stop you do your analysis prior and after you enter you cannot crash the trade you can move your target profit you cannot move your stop
loss the only way you can scratch the trade a break even is if the market goes into long congestion and in that case the market can probably break out in either direction after scalping out i was just trailing the runner below each swing because i want to stay in the market in case market rallies to the upside so portion of my position i was just trailing to the upside scalp is the main portion and runner is just a gravy just a bonus in case market is going higher a market was truly working higher so after
too like a pullback high probability setup at the key entry point is my strategy changing do i approach market differently no i approach it in the exact same way and i expect for market to do the exact same thing so after prices are pushing higher and i always we set the count at the new high we have for example new high first century long second inch long but this second inch long is not at the key entry point not at the ema so i cannot take it prices keep pushing higher new extreme form this is
why we set the count and we have a new high first century long second entry long and we have shortened downtrend that played out and once again this is a two legged pullback second inch long great bullish signal bar at the exponential moving average with the direction of overall trend this is a simple high probability price action setup it was good enough for a scalp market form a double top pushed lower now we have a new high and i reset the count again and we have a first entry long notice what we have still closing
above exponential moving average confirming the trend is still in play and we now have a triple bottom triple test so this is telling me that this bottom is still holding but i cannot take this entry why because it's just a first entry this is just the first lag so that means there is a high likelihood that the second lag is going to follow and prices may create a tool like a pullback at the key entry point again and remember when you are in a strong trend with trend pullbacks are designed to look weak counter-trend entries
are designed to look strong so it constantly tempts you to pick a top and not enter on a pullback with the direction of overall trend remember you never want to enter while the market is pushing higher like this you always want to enter in its exhaustion phase in its pullback at the key entry point so right now we have a new high we have a first century long pullback second entry long again two key entry points are holding and this is another high probability setup using a simple price action rule what can be a little
bit worrisome is that you're close to this resistance but if i'm going to zoom out and i'm going to judge the structure how strong and clean option it is there's a really strong likelihood that the triple bottom will hold ema will hold and if it's a 2 like a pullback with such a nice signal bar that you can take this as a slightly aggressive entry now market key is pushing higher and uptrend is still in play remember i'm following the trend line rule so as long as this uptrend is without a break meaning close outside
this option is still in play and my job is to focus on exponential moving average and on a high priority setup notice what we have we have a first century long but i'm not interested it's just a first entry long also we have a multiple bottoms right here so i can reset the count all the way down here first century short pullback second entry short failure this entry is a larger felt second entry short it looks like this larger visual two like a pullback first leg second leg down felt second entry short at this point
we entered a ema hard mode which means every single touch to the exponential moving average will result into a bounce so you can consider this entry as a decent entry it's a little bit aggressive once the market is this strong and this is a clear up trend you can pretty much make a case for going long here but once again you're not focusing on different entries you just want to take second entry longs at the key entry point or failed second entry short that goes against the trend now as the market keeps pushing higher and
i see structure like this and it's the new hybrid reset the count we have a first century long and that means there's a possibility for me to get a second in too long the same pattern it sounds too simple it looks too simple but this is how price session likes to move in pairs of two prices are breaking lower and we have first century long second inch long at the ema at the time i even drew a little bit channel what was my channel something like this potential spike and a channel that i had so
smaller channel it was very close to getting confirmed another second entry long at the key entry point again signal bar is bullish structure is bullish trend and you can see that it resulted into a winning trade and today was one of those days but it was like taking a candy from a baby but once you get a day like this you need to make sure you take advantage of this day and you only need couple of these days during a month if you get two days like this in a month and you can catch few
decent runners because it is not impossible to catch two good runners on a day like this i caught one very good run today a simple to like a pullback at the key entry point in this bullish trend is all you need for the day like this is the day that we long for rules are still the same i'm not picking top i'm not even thinking about selling structure is bullish i keep resetting the counts at the highs right now we have micro double top so i'm going to reset the count and we have a first
century long i'm not interested this is just a first entry long we have a second entry loan below ema ema get bar decent entry a little bit more advanced when i'm watching this i expect still for price to push above exponential moving average but it is not happening prices keep pushing lower consistently okay so right now i expect for prices to make its way all the way to my key entry point i'm going to draw the trend line we have a new low form first century short pullback second entry short failure but we closed below
exponential moving image when i was watching this had we closed above i would have liked entering here but second entry short form below and even felt second entry show didn't manage to push above ema to confirm the voice momentum this is big we still need to push above ema because this down training is new low so if i'm going to be gambling and taking along here i need to see push above ema it never pushed above ema in fact it created a nice juicy double trap and this entry is very tempting because this downtrend needs
to get new low so you're following the trendline rule not only for the big patterns but for the corrections as well and this was really tempting trade i can almost mark it but i'm not going to because it is against the overall trend but once you see traders getting trapped like this such a great burst reversal bar and it's down to this new low you can figure the market is probably going to keep pushing lower at least to the key entry point now notice what price did we have a break two likes to a new
extreme and what do i expect now i observe how ema is going to react and this uptrend right now needs to get new extreme because i'm following the trendline rule so i expect to get a felt second entry short above ema and i don't get it markets just keep pushing lower and keep pushing over consistently so that means i have to adjust and this downtrend is probably not the one because we have five legs to your extreme so what i did i extended the channel like this because i get multiple confirmation now off the highs
and even off the lows up chinese new extreme yes there's the bigger pattern but big patterns corrections may take time so i need to let this downtrend play out first unfortunately i don't even get a good second entry short if i had a decent second entry short at the two key entry points because ema and trendline are running together i would have considered it but we never got it and notice what we have small little break moved to a new extreme and prices are right now pushing above exponential moving average this is what it looks
like zoomed out and i expect for prices to create new extreme why not only because i'm following the trendline rule and the price session rules but also because technical patterns repeat over and over again this is may 23rd technical analysis patterns repeat over and over again price action rules are working we have an option working higher we have a first break for the uptrend and what do i expect i expect to get a new high downtrend played out with the break new extreme and after prices pushed above ema and ema confirmed the bush momentum notice
we eventually received a new extreme same structure i expect for it to do the same thing upturned from the june strong uptrend break we expect to get a new high first i'm going to let the downtrend play out break new low and if prices push above ema and give me a reversal pattern i can enter long expect for prices to create new extreme push above ema confirming the bullish momentum first century short failure second entry short failure do i get a trigger here unfortunately i don't get a trigger above this felt second entry short so
when i was watching this i'm expecting now to get a last hope and to get a second entry long a noticeable price created new high first century long pullback second inch long and once again when i was watching this live there was no double top there was one tick lower so there was a legit second in too long and right now i have a first century long second inch long ema keeps holding price the bigger channel still needs to get a new extreme and this right here is a second entry long at the key entry
point and not only that it is also continuation of the felt second entry short but the second entry short failure could have been treated as in the golfing and it is still in play and it didn't get stopped out you keep your stop loss one take build the signal bar so you would have to ride this out now that this is a great engine because you would be entering at the very highs and you don't want to take an entry like that but it is still continuation of a felt secondary short and at second inch
long at the key entry point this is my second trade for the day and unfortunately i didn't get runner because it came back instantly stopped me out and market eventually kept going higher and notice what you have again new high phone first century long second inch long first leg down second leg leg down to two key entry points but the signal bar is horrible this is a nice bullish body i want to go long above this signal bar is bad so i cannot go along here and i need to be patient now we have a
break of the spike at a channel new extreme form so that means that right now we can get correction of possible reversal and notice what we have new high first century long pullback second entry long another two like a pullback it was good enough for a scout but after breaking new high i'm going to be a little bit hesitant you guys can see you barely got out market reverse to the downside now i'm going to zoom out like this and i can see that right now we are working in a sideways trading range but we
still tread it up into this trading range so we're most likely going to break higher and the option still needs to get new extreme so i'm not really thinking about selling prices are pushing above ema so if anything i'm looking for felt second entry short new low first century short second entry short failure but it is way too big way too congested ema in the middle of these bars i cannot take it you guys can see you still would have survived because you keep your stop loss one tick below the single bottle but that doesn't
mean this is a good entry it was too congested too big and i need to steal my hands be patient in the meantime i still expect for prices to create eventually new extreme for the major uptrend right now we're in the middle of the stream range and you guys can see there are no high probability setups once prices are in the middle of the training range in the no man's land i'm not interested because you can get chopped out and i expect for prices to give me at least a second long before we reach new
highs but we already reach new high so i can expect correction or possibly reversal so i'm going to draw the shortened channel to the downside first century short pullback second entry short i can mark this entry it is off two key entry points upgram played out with the break a new extreme expect correction or reversal we push ball ema which confirmed the best momentum and we are coming from the range highs second entry short 2k entry point market continue pushing lower and we are at the close the two-legged pullback pattern seems too simple to be
powerful but if combined with proper market conditions it can be a reliable high probability setup i'm going to see you next time
Related Videos

17:44
Trendline Mastery - How To Identify Moment...
Thomas Wade
66,486 views

31:16
5 Price Action Rules EVERY Trader NEEDS To...
Thomas Wade
2,028,479 views

8:01
EUR USD ANALYSIS TODAY| Live Forex Trading...
TubeCore (Creating The Need, Not The Greed)
No views

26:22
The Secrets of Price Action Trading (Preci...
SMB Capital
39,749 views
![3 Steps for a Solid Price Action Trading Foundation [Webinar] | Urban Forex](https://img.youtube.com/vi/nshC4INMndQ/mqdefault.jpg)
50:47
3 Steps for a Solid Price Action Trading F...
Urban Forex
193,377 views

45:59
The 3 Scalping Setups That Make Me A Livin...
Etienne Crete - Desire To TRADE
752,754 views

14:36
'FRAUD AT SCALE': Elon Musk exposes shocki...
Fox News
3,092,109 views
41:26
Support and Resistance For Beginners (The ...
Rayner Teo
237,464 views

48:15
Reading Candlestick Charts Was HARD Until ...
Ross Cameron - Warrior Trading
1,468,784 views

23:05
Using Orderflow To Identify Absorption & R...
Price Action Volume Trader
55,142 views

1:07:08
Dr David Paul - Unleashed
Trader Tom
138,540 views

46:05
Scalping series: #02 Scalping 2-minute Emi...
Brooks Trading Course
447,084 views

19:14
3 Steps to trade Price Action - Urban Fore...
Urban Forex
39,224 views

27:58
Every Candlestick Tells a Story... Here's ...
JeaFx
541,928 views

27:40
The ONLY Beginner's Guide To Trading Trade...
Thomas Wade
147,017 views

6:25:10
Warren Buffett presides over the 2025 Berk...
CNBC Television
455,889 views

59:00
How to BUY THE DIP the RIGHT WAY
Ross Cameron - Warrior Trading
159,164 views

29:45
The Truth About Trading Gurus - My Research
Finance Illustrated
540,412 views

23:08
Price Action Trading Was Hard, Until I Dis...
The Trading Channel (The Trading Channel)
2,182,003 views

18:04
I Tested 100 Candlestick Strategies... Her...
Ezekiel Chew
15,855 views