Lec 12, Sampling and Sampling Distribution
58.98k просмотров4790 СловКопировать текстПоделиться

IIT Roorkee July 2018
Sampling, Sampling distributions, Sample statistic, sampling distribution of sample mean, probabilit...
Транскрипция видео:
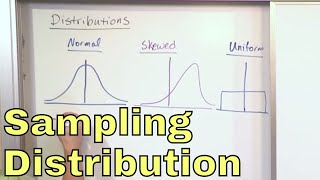
[Music] [Music] [Applause] [Music] [Applause] [Music] dear students we are going to the next lecture that is sampling and sampling distributions the objective here is objective of this lecture is describing a simple random sample and why sampling is important explain the difference between descriptive and inferential statistics and defining the concept of sampling distribution determining the mean and standard deviation of the sampling distribution of the sample mean that very important theorem that we are going to see in this class the central limit theorem and its importance and determining the mean and standard deviation of the sampling distribution of the sample proportions then at the end we will see the sampling distribution of sample variances the whole statistics can be classified into two categories one is the descriptive statistics another one is the inferential statistics the descriptive statistics is only for collecting and presenting describing the data as it is it is very low-level statistics whereas the inferential statistics drawing conclusions are making decisions concerning a population based on sample data in the inferential statistics with the help of sample data we are going to infer something about the population so when you say population you should know what is the population what is the sample population is the set of all items are individual of interest for example all likely voters in the next election all parts produced today all sales received for number the sample is the subset of the population like thousand voters selected at random for interview a few parts selected for destructive testing random received selected for audit this is an example of sample when you look at the left hand side there is a bigger circle that is the population from there some numbers are bigger the collection of that picked of the values is called a sample the question may come why we out to sample it is less time-consuming than a census less costly to administer then your census it is possible to obtain statistical result of your sufficient the high precision based on the samples because of the research process sometimes destructive the sample can save the product if accessing the population is impossible sampling is the only option sometimes you have to go for census also we're in census we will examine each and every every item in the population suppose if we need to have higher accuracy and you are not comfortable with the sample data then used to go for census the reasons for taking a census because census eliminates the possibility that random sample is not representative of the population many time there is a chance that the sample which you've taken may not represent the population otherwise the person authorizing the study is uncomfortable with the sample information then you go for census we will see what is sampling sampling is generally selecting some items from the population that is a sampling so there are that can be classified into two way one is random sampling another one is a non random sampling in the random sampling the concept of randomness is taken care non random sampling the randomness is not there sometimes we may go for non random sampling even though it is not so comfortable that is not good for doing many statistical analysis sometimes we have to go for non random sampling but they random sampling the outcome or the generalization which you provide with the help of random samplings are highly robust so we will go for what is the random sampling every unit of the population has the same probability of being included in the sample that is the concept of your randomness a chance mechanism is used to selection of the process because the chance of mechanism is we can use a random table to choose someone you can use your calculator you can choose someone choose someone randomly that eliminates the bias in the selection process also known as the probability sampling they'll go for non random sampling every unit of the population does not have the same probability of being included in the sample it is open the you know action by us there is a possibility selection by us not appropriate data collection methods for most statistical methods so it is not good method for doing some statistical analysis also known as nonprobability sampling random sampling techniques there are four way we can say of selecting random one is the simple random sample second one is a stratified random sample with the proportion disproportionate third world is a systematic random sample fourth one is cluster or area sampling simple random samples every object in the population has an equal chance of being selected objects are selected independently samples can be obtained from your table of random numbers or computer random number generators a simple random sample is the ideal against which the sample methods are compared this is a best method suppose we will see there are 20 states have ever taken suppose I want to choose some states randomly for some studies suppose first task is I have given some number two-digit number 0 1 0 or 2 for example up to this one it is only for illustrate the purpose it is not taunting the number of states are more next I am using the random table to choose the States randomly for example you can start from you can see this is a random table you say see the table you can follow any 2 digit 99 43 78 79 61 because the random table can be read at any direction okay so suppose if I am reading left to right 99 4378 76 61 45 and so on so 53 next is 16 so 16 is I have to choose the serial number 16 and corresponding states I am going back so the 16 is Tamilnadu so one state is chosen the next random number is 18 so the 18 is Kerala next state is chosen next 250 there is no number 65 there is no number 60 there is no number but zero one number is a 0 1 is Andhra Pradesh then 27 27 is not there 68 knots there's 36 not there 76 not there 68 not 0 82 is not but 0 8 is there 0 it is Haryana so like this I this is the way to use a random table to choose from the population here the population is the number of states suppose I want to choose some states randomly for my study so I can use the this random number table okay suppose so the capital n is a 20 n is 4 so capital interest in the population n represents the sample size then we will go for stratified sampling so the population is divided into non-overlapping subpopulations called strata random sample is selected from each stratum potential for reducing sampling error we can go for proportionate the percentage of these samples taken from each stratum is proportion to the percentage that each stratum is within the population we can go for disproportionate also the proportion of strata within the sample are different than the proportion of the strata within the population for example stratified random sample population of FM radio listeners so whatever then the whole population is divided into 3 stratum one is 20 to 30 30 to 40 40 to 50 you see that each statins are homogenous within between the stratum there may be a difference maybe there's a different variance but the same stratum will have is homogeneous the similar kind of behavior are dead as it will be there why it is reducing the sampling error that you if you choose 20 to 30 if you choose something from this data so all we will we have the similar characteristics if you choose number some numbers 40 two-fifty these sample will have similar characteristics see that between the stratum it is a heterogeneous within the strata it is homogeneous then next method is the systematic sampling it is convenient and relatively easy to administer the population elements are ordered in sequence the first sample element is selected randomly from the first K population element thereafter the sample elements are selected attea constant interval k from the ordered sequence of frame what is the K is K is the population size divided by sample size the K represents the size of selection interval we will see an example suppose the purchase order is from the previous fiscal year serialized one to 10,000 so capital n is 10,000 a sample of 50 m equal to 50 purchases orders need to be selected for an audit so here K is 10,000 will be 50 that is a 200 K is the interval so the first sample element randomly selected from the first 200 purchases assuming that we have chosen forty-fifth the purchase order from the forty-fifth you have to add 200 so 40 50 plus 200 245 245 plus 200 for 45 for 40 plus 645 645 and so on okay then we will go for the cluster sampling here the population is divided into non-overlapping clusters or areas each cluster is miniature of the population the subset of cluster is selected randomly from the sample if the number of elements in the subset of cluster is larger than the desired value of n these clusters may be subdivided into for me a new set of clusters and subjected to a random selection process because each cluster will behave like your population now you may ask the difference between stratified sampling and cluster sampling in stratified sampling the things are homogeneous in each stratum the items within the in Stratham of ammaji but in cluster sampling it's highly heterogeneous and each cluster will act like your population for example say a parallel cluster Ludhiana a perilous trip or these are the example of clusters because each cluster will have similar characteristics but will have different variants so we will go for advantages of cluster sampling it is more convenient for geographically dispersed a population reduced travel cost to contact the sample elements simplify the administration of the survey because the cluster itself will act as a population unavailability of sampling frame prohibits using other random sampling methods because there is no other method we can go for a cluster sampling the disadvantage is statistically less efficient when the cluster elements are similar because that cannot be generalized cost and problem of static analysis are greater than simple random sampling the next kind of sampling technique is non-random sampling the first one is the convenience is sampling because based on the convenience of the researcher the sample is selected next one is the judgement sampling sample elements are selected by the judgement of the researcher for example suppose you administering a questionnaire suppose that questionnaire can be understood only by a manager then you have to look for only the managers so the researcher is judging that who should fill this questionnaire so judgment sampling then quota sampling sample elements are selected until quota controls are stratified suppose say some Luther account there are some districts and each distinct I have to collect some sample so I may have some quota for example in haridwar district how much sample has to be collected some other district how many sample has to be collected so there is a quota sampling snowball sampling is a very familiar that survey objects are selected based on the referral from other survey respondents suppose you may approach one respondent out ever the survey is over you can ask him to refer his friends so that is a snowball sampling it's a very very very common method in the research okay then there are some errors when we go when we go for sampling data from non-random samples are not appropriate for analysis of inferential statistical methods that was there a very important drawback because you cannot generalize because there is no randomness sampling error occurs when the sample is not the representative of the population if the sample is not representing the population then whatever analysis you do that will become futile so non sampling error suppose if you go for apart from this sampling procedure sometime there may be missing data that may be problem and recording there may be problem with the data entry there may be analysis error sometime the poorly consumed concepts unclear definition and defective questionnaires that also lead to error sometime response error occurs when the people may not understood what is the questionnaire suppose there is option that not know will not say sometimes the respondent may water state their answers these are the possible error when you go for sampling there is one more error type 1 and type 2 error that we will see in the coming classes so now is to go to the sampling distribution of mean here Expo represents the mean so the proper analysis and interpretation of your sample statistic require knowledge of its distribution that is a sampling distribution for example we start from population say population is mu select a random sample from the sample you select the sample statistic into statistic it is not statistic yes there is no yes so whatever things would you say about the sample it is called a statistic T statistic Z statistic x-bar these are since we you calculated from the sample we are calling it to statistic with the help of sample mean you can calculate or estimate the operation mean this is the process of we were inferential statistics so what is happening something we are going to assume about the population once we assume that population that is generally called hypothesis then we'll take a sample randomly we will do some sample statistic with the help of sample statistic we can estimate the population mean or we can estimate the population variance in this contest currently we are estimating the population mean this picture shows the inferential statistics there is a see there are bigger circle that is the population so the population parameter is unknown but can be estimated from the sample evidence see the red one shows that the sample statistic so what is the inferential statistics is making statements about a population by examining sample result that is the inferential statistic see another example of inferential statistics drawing conclusions or making decision concerning a population based on these sample results you see there are different red color is there so these 1 2 3 4 5 6 7 this as the sample the whole things in the population the inferential statistics is used for estimation estimating the population mean weight using the sample mean weight for example if you want to know the weight of the population that can be estimated with the help of weight of the sample mean then this inferential statistics are another application verse for hypothesis testing we can use sample evidence to test the claim that the population mean weight is for example 120 pounds are thought we will go in detail about the statistics in coming lectures now we are entering into the sampling distribution sampling distribution is a distribution of all of the possible values of your statistic for a given size sample selected from the population so what will happen we can say type of sampling distributions we can do the sampling distribution for the sample mean we can do the sampling distribution for the sample proportion we can do the sampling distribution for sample variance first we will see the sampling distribution of sample mean suppose assume that there is a population there are four people in a population that is age random variable is X is age of individuals so the value of x may be 18 20 22 24 it is the population first you will find out the population mean population mean is Sigma of capital X Idol by n generally whenever you see a capital alphabet that is for the population the smaller one is for the variance so 18 20 22 24 it'll be for is a 21 similarly the population variance is 2 point through Z 2 point 2 3 6 what is happening there are 4 element is there so the probability of getting each element that is choosing 18 20 it is 1 by 4 so 0. 25 plus 0. 25 and 0.
25 it this follow uniform distribution suppose if we choose only one sample when you plot it the chances for selecting each person from the population is 0. 25 suppose if you consider all possible sample of size en size here means we are going to select 2 people with the replacement there is a possibility first observation may be 18 20 22 24 second observation may be 18 20 22 24 so possibility is 18 18 18 20 18 22 18 24 2018 2020 2022 and so on so there are 16 possible samples okay here we are doing sampling with replacement that is why it is coming 20 20 20 to 22 24 24 if we find the mean of this so that I'd say picture shows the mean of that 18 18 is 2018-2019 when you plot this me what is happening that mean of this sample is following normal distribution previously when you take only one sample when you plot it we are getting uniform distribution when you increase the sample size 1 to 2 what is happening you are getting here normal distribution it is no longer uniform okay now summary measure of this sampling distribution where we selected to with replacement you see that and going back there are 16 elements for class 4 4 4 times 4 16 element so the mean expected value of x bar is 18 19 21 up to 2400 16 mu equal to 21 then the standard deviation of this sampling distribution is Sigma of X minus mu whole square by n so the formula for standard deviation is first to find the variance mu is 21 so 18 minus 21 whole square plus 90 minus 21 whole square up to 24 minus 21 whole square it is 1 point 5 8 please look at and going back look at the population mean the population mean is 21 and population standard deviation is to 0. 23 6 when we select 2 with replacement mean of the sampling distribution is 21 but the standard deviation of the sampling distribution is 1.
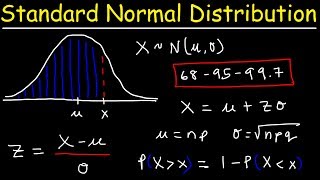
5 yet when you go for selecting two samples with replacement next what we have to do we are going to select the 4 at a time we are going to construct the same table which have constructed previously after constructing when you find the mean it will be 21 so we have found these summary measures for the sampling distribution where the mean of the sampling distribution is 21 and the standard deviation of sampling distribution is 1 point 5 8 so when we compare population data versus sample for population there are 4 element in the population in the sample there are 2 element the mean of the population is 21 the mean of the sampling distribution is also 21 but the standard deviation of the population is 2. 2 36 but the standard deviation of sample distribution is 1. 5 8 you'll go for another example that there is an population which follow an exponential distribution now from this exponential distribution we are going to select 2 at a time with replacement when you select two at a time then if I find the mean then if you construct frequency distribution then if I plot that frequency distribution when n equal to 2 we are getting this kind of distribution you see that the the parent distribution is exponential when the sample size is 2 if I plot the mean of the sample mean that is following this kind of similar to uniform distribution if I increase the sample size to 5 what is happening it is changed so when n equal to 30 it is looking like here normal distribution so what is happening whatever may be the nature of the population if you select any sample from the population then if you plot that the sample mean that will follow normal distribution so for example another example you take the population follow a uniform distribution you select two at a time and plot the sample mean that follow this kind of distribution increase sample size to 5 it is approaching normal distribution when n equal to 30 it is looking like a normal distribution initially it was the uniform distribution when the sample size is increasing then it is following it is behaving like a normal distribution so expected value of sample mean let X 1 X 2 X n represent a random sample from the population the sample mean of these observation is defined as X bar equal to Sigma of X Idol y ya then standard error of the mean different sample of the sample size from the same population wield different sample means a measure of variability in the mean from the sample to sample is given by standard error of the mean so standard error is Sigma by root of e n note that the standard error of the mean decreases when the sample sizes increases see if the sample values are not independent what will happen if the sample size is N and not a small fraction of the population size capital n then the individual sample members are not distributed independently of one another those observations are not selected independently so a correction is made to account for this so Sigma square tritter by n that was the variance of the sampling distribution that has to be muddled by capital n minus small and order by n minus 1 okay you take square root of it Sigma by root or root of capital n minus 1 into small a ok if the population is normal with the mean mu and standard deviation Sigma the sampling distribution of X is also normally distributed with the MU X bar equal to MU Sigma X bar equal to Sigma by root n when the sample size is not a large relative to the population then mu X bar equal to MU Sigma X bar equal to Sigma by root n multiplied by correction factors so the Z value for the sampling distribution of the mean is ZT equal to X bar minus mu divided by Sigma X bar we look at the sampling distribution properties see the the top one it is a normal population distribution but the normal sampling distribution as the same mean then sampling distribution properties for sampling with replacement when n increases sample size increases the standard deviation of sampling distribution decreases so what is happening look at the red color there is a large sample size that is the standard smaller standard deviation look at the blue one smaller sample size larger standard deviation you the population is not normal we can apply the central limit theorem even if the population is not normal sample means from the population will be approximately normal as long as the sample size is large enough the properties of sampling distribution is mu X bar equal to MU Sigma X bar equal to Sigma by root n this theorem is very important theorem that is the central limit theorem why it is important through this theorem the concept of sample and population is connected what is the result the mean of the sampling distribution is population mean the standard deviation of sampling distribution is Sigma by root n where the Sigma represents the population standard deviation n represents the sample size it is very powerful it is the very fundamental theorem for inferential statistics what is happening as the sample size get large enough the sampling distribution becomes almost normal regardless of the shape of the regardless of shape of the population so what is the meaning is suppose there is a population you take some sample if you plot the sample mean that will follow normal distribution provided n is large enough so when you keep on degrees n then the sampling distribution will be exactly like your normal distribution okay even this is applicable even the population is not normal the parent population may be may follow any distribution but the sampling distribution will always will follow a normal distribution so the MU X bar equal to MU the standard deviation is Sigma by root n you look at this case also the population is not following a normal distribution but the sampling distribution will follow normal distribution so how large is large enough for most distribution when n is greater than 25 will assembling distribution that is nearly normal for normal population distributions the sampling distribution of the mean is always normal normally distributed very important result what is the meaning the sampling distribution of the mean is always normally distributed suppose we'll see an example a large population has mean equal to 8 and standard deviation is 3 suppose a random sample of n 36 is selected what is the probability that the sample mean is between seven point eight and eight point two we'll see an example even if the population is not normally distributed the central limit theorem can be used when n is greater than 25 so the sampling distribution of x-bar is approximately normal that is the result which have seen mu x bar equal to 8 and this standard because the the MU X bar is mean of the sampling distribution is 8 the standard deviation of the sampling distribution is Sigma by root n Sigma is 3 n is 36 so 0.
5 so what will happen we were asked p of 7. 8 less than mu X bar less than 8. 2 so this 7 point d8 has to be converted to Z scale the conversion factor the conversion formula from converting to Z it is X minus mu by Sigma by root n okay the X is given 7.
8 mu is 8. 2 Sigma is 3 sample sizes 36 that will be the the the middle one that is mu X power minus mu into D Sigma by root n that is nothing but your Z value less than equal to the upper limit so X is 8 point 2 minus mu 2 by 3 by root of the 36 so when you simplify this P of minus 0. 5 less then Z less than 0.
5 that will give you the probability of 0. 38 3 0 so what is happening the extreme left shows the picture of your population there is a question mark that means the population may follow any distribution if you select some sample when you find the sample mean then you draw the sampling distribution that will follow normal distribution so what is the area of the sampling distribution between 7. 8 and 8.
2 that was asked otherwise what is the probability of that the mean of the sampling distribution is between seven point eight to eight point two so that seven point eight has to be converted into Z scale so that we can refer the table that conversion is done with the help of formulas Z equal to X minus mu 2 by Sigma by root n after converting the seven point eight corresponding Z values minus zero point five eight point two corresponding Z values point five we can look at the statistical table or we can use Python to find the area between minus 0.
Похожие видео

24:37
Lec 13, Distribution of Sample Means, popu...
IIT Roorkee July 2018
40,776 views

28:19
Lec 6, Introduction to Probability-I
IIT Roorkee July 2018
98,836 views

1:01:09
Central Limit Theorem - Sampling Distribut...
The Organic Chemistry Tutor
793,005 views

1:08:17
Hypothesis testing (ALL YOU NEED TO KNOW!)
zedstatistics
284,523 views

43:41
Lec 19, Errors in Hypothesis Testing
IIT Roorkee July 2018
26,492 views
24:35
01 - Sampling Distributions - Learn Statis...
Math and Science
390,783 views
51:03
Standard Normal Distribution Tables, Z Sco...
The Organic Chemistry Tutor
2,431,510 views
16:26
Determining Sample Size | Cochran & Yamane...
Solomon Getachew
25,378 views

32:33
Lec 16, Hypothesis Testing- I
IIT Roorkee July 2018
52,329 views

1:18:03
1. Introduction to Statistics
MIT OpenCourseWare
2,029,420 views

13:18
Sampling: Sampling & its Types | Simple Ra...
Digital E-Learning
1,033,031 views

26:01
Lec 10, Probability Distributions - III
IIT Roorkee July 2018
42,414 views
38:40
Statistical Estimation | Lecture 1 | Biost...
The Statistics Teacher
55,420 views

29:34
Lec 9, Probability Distribution - II
IIT Roorkee July 2018
49,924 views
12:21
An easier way to do sample size calculations
Very Normal
16,408 views

21:38
RELIABILITY Explained! Failure Rate, MTTF,...
CQE Academy
158,209 views
6:47
What is sampling | Probability vs Non Prob...
Educational Hub
22,847 views

36:00
Lec 25, Post Hoc Analysis(Tukey’s test)
IIT Roorkee July 2018
19,899 views

18:28
Sampling Methods 101: Probability & Non-Pr...
Grad Coach
147,671 views