Amazon Redshift: re-innovating cloud analytics
375 views10139 WordsCopy TextShare
Jignesh Patel
In 2013, Amazon Web Services revolutionized the data warehousing industry by launching Amazon Redshi...
Video Transcript:
okay it is a great pleasure to have hipocrates pandis come and wrap up the semester with a talk on red shift this is the system that started the cloud database uh uh Trend and now everyone of course offers database uh products on the cloud but Redi was the first one to bring that model of uh uh delivery to the customers and of course with that a gamechanging model for how do you price database services uh IO is a graduate from CMU he hasn't been here he told me for a couple years but uh we're going
to try and drag him onto the campus sometime next year um he has a illustrious career he was at claa in the Impala team at the start of what was the big data era uh then went before that was at IBM then went to AWS and took charge of red shift where it was for the longest time and may still be one of the fastest and most important product and it definitely is in the in the database world so he's also won a number of best paper awards at top conferences including sigmod his list of
accomplishments are really large we uh but I really want him to take the floor so EO with that the floor is yours and take it away Zess thank you and it's so great to see you man at CMU uh uh I'm uh folks I I I was in in the same classes right I was I was a student at CMU and always CMU is a very near and dear my heart and you are in one of the best schools and with two of the best top class databased systems professors in the world so you are
so lucky all right so I'm here uh Jes kind of took over my introduction uh why I'm here uh I'm going to talk about uh analytics in the cloud and um U I'm I I'm going to talk about a system called Amazon Redi um and as J said the Redi was the first cloud data warehouse out there uh Amazon launched that uh back in 2012 uh actually we announced preview of that and W8 shortly after and Andy went up to the stage and said hey we're going to going to have the big data analytics in
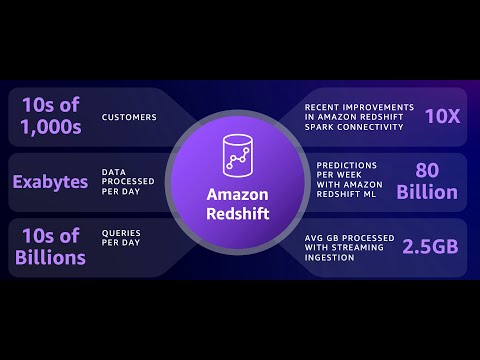
the cloud as a managed service and uh this was a the beginning of a new era and uh since then this service has grown very very big and uh um we have been working on it for a while now and uh some numbers just to show you it's it's a really really big system uh we have tens of thousands of customers processing exabytes of data every day by the way notice the the plural there exabytes uh that means that it's more than one and and you know already in East Coast you you are past the
no so that means that our systems have already processed at least one exabyte of data already during this day so it's a very big system uh uh tens of billions of queries uh and uh a lot of uh interesting stuff happening around uh operation analytics with streaming ingestion with machine learning and I'm going to talk about uh these uh things in the in this talk in the next one hour um if you want to learn more uh we have a pretty decent paper uh we wrote it back in 2022 at sigmo that was giving an
overview of the system how we have evolved it uh since we launched it uh there the the team is very active publishing we have Tim krasa in our team with some very very smart folks uh uh coming from u in his team that have been focusing a lot on on innovating and and also communicating that to uh to to the research community so uh I would urge you to to look a little around and see the some of these research papers out there um so now let's get to the talk and uh what I'm going
to the way I have structured this talk is uh and I have given a similar version of this talk in the Years uh at CMU but I assume that this is a new Corpus of students so it's okay for me to kind of repeat some of these things uh the way we if you look on the efforts on what what we are working on in uh in in red sift uh you can say that generally Falls in six big uh pillars six big thematic areas the first one and probably the job priority number zero for
us the most important one uh is uh about is around security and availability um our customers yeah give us you know our tens of thousands of customers give us exabytes of data for us to process the maintain and keep them around so our highest priority is to keep this data uh safe and available um usually if I were in the class I would do a popup quiz but I I will do it virtually now but H between security and availability what uh uh if we have to choose what we would choose uh and this is
a question so with the raise of hand somebody tell me uh any any calls uh security so okay corre given where we are now yes exactly so yes security security is our top most priority uh and then is availability the most secure system is the one that it is down and it is dead but obviously we can do much better than that so so once once we are secure we can make sure that this is a up and running and this highly available um so in this area I I will not talk about many things
but uh one of the things that we have uh implemented over the recent years is the introduction of multi-az capability so a high highly available version of red sift the way it works is uh um so AWS the way it works is it has multiple regions spread around the globe uh we have 30 8 regions right now and over 108 uh um availability zones and within every one region there are multiple availability zones that are 5 to 10 kilomet uh physical distance between each other and so that they are quite independent and uh what we
do is a customers deploy multi-az we literally run two sets of compute environments in two different availability zones one being the primary the other being the secondary both of them are being active being meaning that they are able to read and write data and at some point if something knock on good happens and one of the availability zones goes down we very quickly identify this availability issue we fail over promote the secondary to primary we go bring up another secondary in another of the availability zones and we keep on running the system and this is
being used for highly critical applications and uh and uh and this it it is doing basic things of primary and secondary and failing over and making a decision when to fail over which is a very difficult decision by the way then the second big area for us there are many things I could talk about in the security uh but uh but uh because I want to keep this uh talk a little uh short let me move to the next quick question on the uh replication that you do if there updates do you ship logs or
do you actually ship queries or how do you keep so the way it works is that the system of record for Rive data and I'm going to cover that in the next section in a in in a while is uh S3 uh the uh R's uh Storage manag storage layer is stored on A3 when a ride comes in it gets committed down to S3 and by using S3 as the means then when we have an a secondary cluster Computing environment it consumes the data from a three so when we fail over we don't have to
go and S anything got it and and then then do you have to manage the replication in S3 separately of course they are good defaults but uh or is that abstracted away in some form of availability that red shift provides uh and takes care of what uh S3 does S3's policies are H so so S3 is a multiz by itself right it's a it offers 11 NS of availability and it is three it's it is multi- by itself so we kind of separate the concerns there once we write to to A3 we assume that this
is durable and available uh we have not had any availability issue where we can say oh S3 is down and and and this is a problem for us um we we also have a another interesting thing we use Dynamo B which is an the key value store to always show who is the master and that always points to one of the the the primary or the secondary and by using this pointer we can always go and reboot the system use it as the blue string to go and and and boot the system if no on
would something bad happens uh but with all these things by the way I forgot to say but with all these things we can offer an SLA of four nines of availability to our customers which is substantial it it ensures something like no more than some 40 48 minutes of unavailability to our customers so the second pillar which is kind of central to how red shift evolves is around performance and uh and okay those are some marketing slides but in general uh uh red sift claims that it has the leading price performance in the industry and
there are multiple ways where we compare we we keep track of performance the first one is what we like to call out of the box what does that mean is that we the database you know the user of the database goes and creates a schema they don't do any physical tuning of the database and they start running their their workload and here we are using the TP CDs Ben Benchmark we can see that red shift is ahead of competition between 40% and seven times better price performance than competition on the right hand side there is
another bench uh workload that we are using that we are seeing that it has been involving and it is very very common that is the one that is low latency high throughput bi dashboard workload uh we have seen that customers are using this the data warehousing houses more and more and what they do is they throw more concurrent users and that usually ask questions that have low latency requirements and what you can see there red compared to competition with at say at a specific price point say at $50 red shift can support more concurrent users
at lower latency than the competition so you know obviously this is I am a vendor I'm making a claim you know this is to our customers to to go and and verify these claims what I'm here is I'm going to tell you how we achieve this good performance uh and in order to do that we can look a little ins under the hood and see how red shft actually works so now this is kind of the kind of a little more of the more uh architectural uh uh slide for this uh in this presentation if
this one slide that you need you should pay attention please to be that uh so red shift in general consists of two layers the compute layer and the storage layer on the compute the compute layer is kind of is is running the computations and it consists of two types of uh execution nodes or compute nodes the first one the one I have in the in a blue box there is the leader note the leader note is the entry for the customers to the system it is where the catalog is being stored it is where customers
connect to and it is where it maintains the state of the workload and assigns and has the the catalog and the Optimizer when a statement when a customer connects to that with that they can connect with anything they want jdbc orbc dat II you call it they go and submit queries then we go through the usual query execution process that I'm sure jness has been uh teaching you on uh how it works so we go we pass the query we do s semantic rewrites to decide what is the optimal query we try to find a
a semantically equ equivalent uh rewrite of this query that it is more efficient and then we go into the cost-based query optimization by pulling statistics from the catalog and we go and end up with from this process and we generate a physical qu distributed query execution plan which is literally like an as a data flow that says hey this is what we believe is the optimal way you should execute this query uh on on on the right hand side I have an example of a of a quer execution plan uh one of the interesting things
in red shift is what I has have depicted there as collocated joint in red shift you customers can choose uh some distribution Keys properties say you have a customer table that it is distributed by customer ID you have ORD table that it is also distributed by customer ID if you want to join the customers and the orders on this customer ID because they are distributed on the same property you don't have to shle data into the network and this is the best case scenario for when you are joining big tables because you don't put things
in the network is quite efficient this is what we call collocated joint so anyway the whole quer optimization process takes a consideration on the physical properties of the database and generates a a nice queer execution plan then what Redi does which is quite unique in in the industry is that it takes all these query fragments all these all these independent queries and literally opens a C++ file and print a C++ code for the tight Loop that executes whatever these operators uh want to do uh it takes this generated C++ code it compiles it with GCC
and then takes this executable and broadcasts it to the compute nodes and tells them okay now it's your time go and run as fast as you can and execute this piece of code that I have generated for you then these compute nodes they have assigned uh data partitions from the storage layer and they go and start pulling data from the storage layer and they and they execute whatever this query is supposed to do this execute up and we do all sorts of tricks that probably Jes has taught you we do things such as uh mean
Max pruning we use uh vectorized Sim simd instructions either AVX uh instructions on Intel platforms or the SV and neon instructions on the graviton arm processors we we use uh proprietary and codings compr of the data so that we can operate on encoded data in vectorized fashion and we also try to pull the data from the storage layer and we cast them on the compute notes locally on fast ssds in order to pull them as fast as we can or if we can from the main memory so that's it this is literally the kind of
high level idea of how red Shift Works I don't know if there are any questions that I can continue what happens if there's a shuffle are you generating multiple CPP files how do you distribute that right up front or like piecewise H so the way it works is that uh essentially we generate this so there is a there is a stream of work until a stop and go operator and if between say you scan data you filter you Shuffle and then you you pull the data from the network and you build a has table that
is essentially a stream of work this this is a producer and a consumer segment what we do is we go generate the code for both and we run them in parallel so but yes the answer to your question is we generate multiple CPP CPP files per per query fragment that makes sense okay now usually do you do anything special uh at run time when you detect that one node is far ahead of others because of data skew and stuff like that yeah yeah we you know obviously I mean there are many many tricks we do
there thereof in order to make sure that uh so for example uh one thing we do is that um the data that have to be consumed from one compute node uh um it's in general we try to do at least work stealing within the compute node from the processes in the compute node um this usually addresses the challenge of of skew because at at least we get parallelism within that if we are even more then we try to kind of become a little more we become smarter and and change a little the the plan but
uh you know this is an active area of of uh of uh let's say work in in in the entire industry and in red in general in particular great thank you so usually you know so just to give you a little more examp think information about the code generation let's say we have an very simple query like the one I have here where what it does it joins two relations RNs it applies a filter on on relation R and then it calculates an aggregate on top of that what Rift does it generates C++ code that
looks a lot like the one I have on the left hand side of this picture where you can actually kind of read it it h it has a y loop on a scan step it pulls the data from two Fields it applies a filter on on one of the two Fields it calculates a has value it probes a has table and performs the aggregation by adding on on an IND value this is you know if I were to ask you to write the code that would be very much very close to what you would I
would expect you to write it's pretty pretty easy pretty small and pretty efficient actually to execute obviously with do a lot of tricks to make this thing even faster for example we you we use a technique to uh prefet data uh and minimize stalls from C misses from either L1 or L2 so we have a small buffer of data so we pull data and we have a a ring buffer where we operate on on the on the head of that while we are pulling data on the tail uh this version of the code is the
scalar version of the code what we run in production is either avx2 or SV and neon vectorized version of that if we're running on arm or on Intel we use max min max pruning we use late materialization but you get the gist of that what Rift execute is a very very efficient piece of code that melts all the operators of a query segment together and it is a very efficient tight Loop usually when I'm I'm at this part of my talk somebody raises is the hand it says okay don't you worry about the code compilation
cost when you are running something analytic so I'm in my screen I write a query and you go and you use GCC to compile this code obviously we do worry a lot about that and this was uh less of a concern in let's say a decade ago when people used to load data at night and run reports over the night to get them in the the reports in the morning as we move to a world where it is more operationally analytics focused more more real time and in a you know 247 type of operation uh
this is not the case anymore and these overheads may may become a problem so we do all sorts of tricks in order to minimize the impact of code compilation the first thing we do is on this leader note we have a cash where we remember the code we have generated for previously executed query fragments turns out human beings and machines are very very predictable and frankly quite boring meaning that they do the same job the same query they ask the same questions potentially on different data over and over and over again by just putting this
cast in on the leader note of of red sift we are getting something like 99.5% cash heat rate meaning that only only five have over uh you know a thousand queries that need to be uh compiled uh when we're running in production but that was not good enough again as we our customers becoming more lower latency demanding and and and and having high request for higher throughput the next thing we did is we implemented the global compilation ass a service service that it is helping us to further minimize the impact of that the way this
thing works is the following every time we see a query fragment we have never seen before we we check a global cast and if we don't find it there we take this query fragment and we push it down to a global micros service that has a bunch of compilation machines that compile this code and they go and put it in the global cast next time around if this Computing environment or any other cluster wants to execute this query fragment it will find this this code compil code in the C and the way this thing there
and and by doing this trick we were able to improve the cash heat rate uh from 99.5 to 99.9 six an order of magnitude Improvement and the reason this thing works is because of the pigon hols principle there are that many tables in the world that have five integer columns and there are that many queries that have one filter on this thing on the third column or one filter on the fifth column or have a string or what not and by executing billions of queries every day we are able to very quickly cover a very
very large space of what the possible questions in in the world are it's quite impressive it's it's kind of it's a very brute force uh way to to to to deal with this problem IO are you able to say how big is the cash in terms of number of entries billions trillions or it's it's transient right because at some point we obviously expir the cash and and that so it's I I I I don't have this number on the top of my head and I don't know I probably should not talk about it h but
uh but you know all I can tell you is that we execute tens of billions of queries every day so so yeah thank you but but the the interesting thing is this pinol principle is that queries actually do not if you if you strip off you know obviously the names the name all these things and then becomes literally the a with some potentially you know holder holder for a for a value uh then the queries actually quite converge to fewer shapes mm right and we keep on pushing right we try to push the envelope on
performance um it turns out that even though we have databases for the past 40 50 years uh processing strings is one of the most challenging things and remains an active field of research I think Jes you have done very interesting work in this area uh but uh for example like you know just just looking at um the the the strings problem is it was something that we kind of we were able to achieve very high speed up speed upbs by looking at the distribution of the cardinalities of string columns in the fleet it turns out
that there are many many many columns of strings that have very low cardinality and then you can do very efficient encodings and processing on this data so we kind of just give you in this part I told you about the performance we released red shift it had good performance uh customers really liked what uh what they were seeing but they started having some elasticity challenges they come they or or scaling challenges they came to us and said hey we we really like what we have but we would like to get more storage uh be able
to store more data into your system and we would like to have more more compute power more concurrent users more more elasticity from your system can you please do something about that so the next thing we did was to focus on the elasticity of the storage and the computer the mo one of the most interesting Trends in my opinion in the evolution of data management systems over the past decade has been the evolution of of of the network uh what I did in this graph is I I went back and I looked on ec2s ec2
is the compute platform for AWS and I looked at I looked at the maximum network band with some of the instances we released over the years had uh and Tra back from 2015 to to now to to last year to July of 20 2023 and I'm just plotting some I sbled some of the kind of the the machines we we had over the years and you can see that this there has been a tremendous evolution in the Improvement in the network bandwidth of these instances when we launched red shift we had 10 gabit networks now
there are machines out there that have over three 3.2 terabits of uh Network bandwidth to the machine and as as you can imagine this this thing is changing the way we are thinking about building um software systems in particular in Redi when we launched red shift the data were stored collocated in local attached storage to where the compute was we had big data we had thin networks we could not go and write the data in a disaggregated storage layer but as the network networks involved and we worked with our uh friends at ec2 at AWS
that they gave us for example uh the Nitro uh system which offloads a lot of processing and helps us in having fast communication with a disaggregated storage layer we build the red shift manag storage layer which is a a storage layer which is disaggregated from the compute and once you disaggregate storage and compute this allows you to scale those two independently and allows us to go and store petabytes of data per database and access them from a relatively small compute layer and this is an example of of the scaling of red shift uh what we
did here uh is we start running the the kind of the TP CDs Benchmark uh and what we did is we increased the size of the Benchmark the data set from 10 terabytes all the way up to one petabyte so we increased this the volume of the data by two orders of magnitude and correspondingly what we did is we cranked up the compute that was running this Benchmark by correspondingly what you can see in a rather boring graph is that actually the time it took to execute this to run this Benchmark was around the same
time it was around 2 to 2 2 half hours this is a very very uh rewarding graph for for me to be seeing because it says that the system can scale from small you know few terabytes of data to to petabyte scale databases this is a very nice property and our customers do like it a lot because they like to see this predictability of oh I'm going to put more data I will crank up the the compute correspondingly and the system will run uh will run equally well so we did the we separated storage and
compute we were able to scale the storage layer then the challenge came on the compute customers told us okay we would like to have more more concurrency more users run using your system there we did two two main things the first one is to add elasticity in the compute to be able to add more compute nodes in a system up and down and and and elastically change the size uh by multiple times in order for our customers to find their right size for their compute environment to meet the latency requirements they had and once they
find the right size for their system there will still be the Monday mornings the the when the customers come in and hit the system and they want to get their dashboards and reports where there is a lot of queuing happens because at some point you run out of of of of of resources right there are there is a a finite set of resources and a very large number of incoming requests at some point you say hey I have to put some control in the admission I cannot admit anymore I'm I'm I'm clogged what we did
there is we built a a basic autoscaling capability where we have a set of pool of of machines and when a customer wants we pull another equisized uh compute environment like the main environment the customer is using and we start spooling jobs to this additional uh scaling environment which and the communication to that is kind happening through this disaggregated storage layer and by doing that we are able to increase the throughput of the system and when the request calm down we contract back to the original size uh and the interesting thing is that the this
is happening without the customer having to do a single change in their application they are still using one end point they run their application in one in point they just throw more users and the system Auto scales and contracts back in this graph is a is a graph we did back in the day when we launched this capability and the interesting thing is we launched it in 2019 uh but the interesting thing was that at the beginning of that year the M before this capability customers could get at at much say 200 queries per hour
from five congur users when they were running this TP CDs Benchmark when we were done with that we could squeeze over 12,000 qu queries per hour from 210 concurrent users submitting queries uh in a in a tight loop with zero think time uh at on the same environment so we were able to improve the throughput of the system by over 60% without customers having to do a single change in their application which is very interesting it's it's of the new era of the cloud that you could not do these things in the old on premises
uh world and this scaling and throughput has been main F Focus for our team um for example I told you earlier about the dashboard workloads here I'm just putting a little few more uh graphs where we keep on measuring the the throughput of the scaling and the throughput of the system and we compare it with other popular cloud data warehouses and we see that red shift achieves over seven times better price performance on this particular type of workload of low latency High conc see uh workload that uh it has been becoming very very popular these
days you a quick question when you do this elastic scaling there's a whole bunch of things that goes in including trying to decide which e to instance to choose and things of that sort yes how much do you pay attention to that which regions to place it if it's actually I'm guessing sometimes these uh things could be spread across different regions as you talked about earlier how much of that matters so the it does matter uh like on analytics the latency of pulling the data say from A3 uh it's not the dominant Factor what it
is even more interesting uh Jes is actually the size of the autoscaling compute we we will we are going to be using we when we launched uh concurrency scaling we were using equisized clusters because we wanted to give the predictable right you run one query here you Auto scale you run more queries uh this queries are the same latency on the other side now uh team team team the the uh has implemented the capability of smart scaling capabilities where we actually now we use machine learning and we right size the computer when we autoscale in
order to achieve even better price performance for our customers and I'm going to get to that a little later okay great thank you but but the the placement in the network is not as uh we're we're trying to to pull fast right so so yes ideally we want to pull from somewhere close H if it is but uh instead of uh icing the customer instead of denying service right instead of not scaling we much rather it's okay we can go and and and scale and and and launch the compute somewhere which may be on on
a different availability Zone it's completely fine we're going to pull data from3 we're going to be fine okay great thank you so once we did that customers were quite happy with the with elasticity and conar scaling we were able to go and Achieve good scaling and uh scaling within one computer environment but the next thing they asked they said okay we like what we see but we have multiple departments in our environment in our company and we would like to give on every one of our departments a separate comput environment to run their analytics or
we want to give to charge them back in properly right I want to put one bill for the HR department a different one for the CRM and what have you and the data scientists can you please do something about that and we would want it for both it's ing the back as well as isolation because one of the interesting thing is usually this data scientists are running these very large queries that sometimes may create a lot of uh contention of in terms of resources with some say business critical report that has to be uh you
know generated from the finance department in order to solve this problem we build a capability which we call data setting the way it works is the f we have one produce environment producer environment that goes and etls in the data and writes the data into the red shift manag storage and then we enable consumer consumer environments now either provision rft clusters or serverless environments to to read this data in a serializable isolation in a transactionally consistent way from the red shift managed storage and this scaling can happen now all these environments the three environments can
Auto scale independently they can be in the same region on different regions or even across different regions the same accounts different accounts or or or same region different region so they have a lot of flexibility on where these Computing environments run for example we have customer such as McDonald's McDonald's is the obvious everybody knows McDonald's they have operations in in in the US they have operations in in Asia in Europe and they want to run some report at the end of the day and see how they are doing and uh they are using this capability
to run to run an analytics across the globe uh and and this is quite impressive right I'm building that uh this data plane in a globally consistent database and as of last year as of last year we not only enabled re reads in a reading the data in transactionally consistent way but now we are enabling also rights so you can have all this globally distributed data plane and storage plane and you can read and write data in at the exabyte scale this is quite impressive so by doing all this work we addressed this the concerns
on the storage and the compute customers yet still came back to us and said okay we like what we see but red sift is quite challenging for us to use we need to have a data admin database administrator to have to be you know PM making sure that the system is properly uh set up and optimized and whatnot can you please do something about that so a fourth pillar on our work is around the area of autonomics and serverless since our customers in the cloud essentially are rening compute time from us there are some drafts
of time where we have enough Cycles to perform maintain data management maintenance operations that previously were responsibilities of a database administrator for example if the system has some down time we can say and say hey I see that this table are used frequently but they have not been analyzed recently and their statistics are off and the query plans are not very good or hey this table has many inserts and deletes and it needs to be vacuum and with because that it has a lot of stale values and it would be better for the system to
do that or we can be even more aggressive we can say hey I see this table it is it does not it has the wrong distribution key it is being joined with this other table it's better for me to go and change the distribution key of this table to make the system run faster because it will be joining in a collocated fashion with this other table or I may change this short key so we we start becoming very smart in what kind of machine learning optimizations we do and what kind of maintain maintenance operations we
are going to take over and CH and execute on in order to make these decisions we need to have very strong signals with high confidence so for example in this paper uh from vldb we kind of explain the algorithm we use in in order to make decisions about the distribution key of our tables so we have we have built this capability back in you know I think in in the early 2020s and what we have done we have been running that in production we have gained a lot of confidence and then what we did is
we introduced a new T type of table in red which we call it auto what does uto mean is that the uh customer goes and just defines the schema of a database and load some data and then it said tells to us hey red shift go and figure out the proper distri physical design for this table or this database and what we do is we monitor the workload and we go and change the physical key physical properties of this database or tables in order to improve the performance of the system in this graph what I'm
showing is we we run the TP Benchmark uh without any optimization we just loaded 30 terab of this data and we started running the tpch bench and what you can see is that within some hours the performance of the system improved by almost 2 X from where when it started when we just loaded it was running in 100 minutes when it was done with that it was running in 60 minutes the system became 40% smarter by just changing the physical design of the system of the database and then we become even more aggressive the next
thing we did is we started creating materialized views on behalf of the customer without the customer explicitly asking for them for example if there is a specific report that your the we see that a database is has to generate every morning and this can be incrementally computed it can be described as a materialized view that can be incrementally maintained we may decide to go and create this materialized VI and if it stop being used to drop it this I'm coming from the deep in two days as J said I coming from IBM db2 days these
things in the old on premises world where big no NOS to go and go and create indexes create materialized use change the physical design of the database but this is the things that kind of As you move to the cloud becoming more and more relevant and uh and kind of it's the expected Norm these days as opposed to the old traditional world we use machine learning everywhere and for example another area where machine learning is is great is to help us uh in workload management since uh many years ago we we we um we and
I don't know if you have taken more more class here there at CMU or around operational research uh but uh if you have a system that has big jobs and small jobs the best way to improve the throughput of the system is to be admitting first the small jobs and then get get some queing on the big jobs this is exactly what we do in Red we have a very b a machine a classifier a machine learning based classifier which says okay this job looks it's a small one or it's a big one and when
what we do is we take the small jobs we get in in the system in and out of of the system as fast as we can and we put some queing on the big jobs we have been running this capability for a while now then we took it to the next level and now not only we make a decision whether it is a job is a small big or small but actually we make a decision make a prediction about the resources it will need in terms of memory CPU IO that will need and we try
to picky back as many jobs as we can into the hardware resource that our customers are rending from us in order to improve the throughput of and the utilization of the system and the culmination of all these techniques I just described around automatic tuning um smarter workload management uh job prediction and all this stuff has been with came up with the introduction of Redi serverless red serverless is a new way Pro way to to get to to be able to consume red shift you get the same SQL as before but we have clamped together a
smart and dynamic comput management with automatic scaling automatic tuning automatic workload management and the customers can go and and consume it and we have you know tens of thousands of customers in servers now that they are very happy with that and um one of the areas that we keep on innovating in this this has been for example on what I talked earlier about talked about earlier about uh the sizing of serverless so when we launched serverless we gave one uh one not to our customers we said okay customer tell us what is the base rpu
the base uh compute sizing you want us to be using for serverless but even that that was a decision that was kind of potentially challenging for our customers so uh Team Tim kka came and he he came with his team and now we gave a new way of the customer this [Music] in presenting their intention say and he's now they have the option our customers to say hey Redi run Ser Redi serverless optimized for cost or optimized for performance or in a balanced optimization and as the data gets bigger the system adjust or smaller the
system ad adjust increases the size decreases the size uh scales to different sizes in order to to achieve this objective all right how much time we have we have 10 more minutes uh for you can go over no worries okay this is good this is very good okay there are two more areas I would like to cover so those are kind of the four core areas in in a DAT in in a data analytic system in a data warehouse that we are focusing now the the fifth area we're looking is around Integrations um when we
are talking about analytics it's uh there is U it's using the data warehouse is one part of the entire life cycle of a data management the data gets captured somewhere it's moved to an analytical system and it's being presented on the other side so we look we spend a lot of time thinking about Integrations for example interesting moving the data into an analytical system it's a quite complex process it is expensive it is complex and error error prone and it's can sometimes can be incomplete and it's a nightmare to any data engineer you can talk
out there and there are many many sources operational databases data laks streams files somewhere in somebody's laptop and moving all this data into an analytical system is is a big big challenge for example say you had an a transactional system like our best of class transactional system which is Amazon Aurora where you are running your your ESOP your your your your business in order to move this data into an analytical system such as red shift you had to do something like that you had to put some uh CDC extraction you could move the data to
S3 you could use another system to transform to clean up the data potentially drop them to another S3 bucket and then injest them data into the analytical system for for your analyst to consume this data on the other side and you can put any system on the left on the right side of this equation right I just use the names from Amazon products for that and this thing in the middle is very undifferentiating a very error Pro expensive and complex thing to have so we said okay we we have we own both sides of of
this of this pipeline let's go and innovate in the area of of moving the data from one place to the other so we kind of we have this this name now which has customer seems to really like it which we call it zero what it is is very simple we what we did is since we have the Aurora storage layer and we are AWS and we have access to that and we have the Red Storage layer and we have access to that we buil a essentially an direct integration from the storage layer of the one
to the other and we are able to move large volumes of data in a transactionally consistent fashion putting very small overhead to the to the to the Head note of the Aurora database and we make it very very efficient on on the other side on the application side on the Rive side essentially what we do is we pull the data from the storage layer and because we know that this is a specific CDC stream we go and we we kind of solve it directly to to the storage layer reducing the number of steps that usually
customers would it would take three steps to go and inest the data a CDC stream into an analytical system we make it in one pass so we make it way more efficient to move the data from an operational database to an analytical system we make it cheaper more efficient cheaper and we minimize we reduce the overhead on on the on the you know front phas uh operations of either the database or the analytical system every morning when I wake up I I have we have a bunch of monitoring reporting on our side and when I
see uh we and I see in production of what how much uh time it took p50 P90 to move the data from Aurora to Red shift and I can tell you that you know t on average we are at single digit seconds right now in production in the fleet across the the globe it takes single digit seconds to move the data from Aurora to Red sift in a transactional consistent fion very lcal two quick questions EO if uh my pipeline the big manual clunky pipeline had transformation steps do they happen in Aurora before the CDC
uh how do I schedule that how do I take care of that what the way we do it is we transform this thing to an El problem or thing we essentially zero ETL actually what it does is mostly eing the data they move the data from Aurora to red but when you want to do the transformation we do it on the on the Rive side and what we do there is we we often times try to uh model that as materialized views ideally as incrementally maintained materialized views so then you can express these Transformations and
St and becomes very very efficient very very fast right because you have a cascading of materialized views that can get incrementally maintained and then the the data comes in and gets propagated and becomes ready for consumption on the other side got it that makes sense and one other question this is LLY done as log shipping at the physical layer or the physical mechanism or something else between Aurora storage and red shift what's the mechanism for the CDC transport I mean what we do is we we we hook up we hook up on on the updates
on the storage layer I mean there are many details that I'm pushing but essentially then there is something that it's a demon that extracts that then and pulls them on the on as a stream to the other side okay thank you okay we have a bunch now we have H many Integrations so we have G8 zero ETL from Aurora MySQL Aurora postest RDS MySQL Dynamo DB and we will keep on adding the here it's kind of one of the areas that AWS is in unique position because it owns also all sorts of data stores on
the other side and then the last area is okay you manage to ingest all this data you have a scalable elastic system how does your do your users use it your your your system and so the last area where we are putting a lot of work is in around the area of analytics and machine learning uh so we keep on extending the capabilities like of what kind what kind of queries what kind of SQL constructs we support like we added rollups Cube cubes qualify merch operators uh we also added a very interesting data type which
we call Super we're very good at naming things at AWS we called it super uh but the whole idea behind that is it's a kind of a semi structured unstructured catall uh data type where customers can write can throw data uh in that and write essentially three dot or n dot notation queries to navigate through this uh semi structure data and run and and run qu using the particle uh query language so in this example you can see that what it does it you have some super data types that have names and then have phones
and then you can run queries that extract the proper thing and and run you know can for example you can process Json data with that uh one data specific data source we have seen has become super super uh uh popular is around uh logs so we have streaming ingestion from with logs they they dump them into red shift in a super data type they may even create a materialize you on top of that and that is a very very nice and very efficient way to to perform analytics on on this uh uh click stream streaming
and log data uh the the other area is obviously the whole machine learning right and I would I I managed to to to talk for 40 58 minutes without talking a lot about AI uh but uh in 2024 that's a that's an achievement but uh uh there what we we did is a customers we since red store stores exabytes of data uh our customer said we don't want to be having to uh move the data dump them somewhere export them somewhere so that then we can train our systems and then use them for inference can
you please help us with that so what what we did is we offered basic ways to go and uh train your models using data from Red shift and you can even kick off this training within SQL from Red shift and then when you train these things uh you can have these models or llms in Bedrock and you can see them as SQL functions and you can call inference within red shift SQL on your data so for example in this example I I you can see as you have you can train the customer CH and then
use this customer CH function in your select SQL so that's it I kind of gave you an broad overview of of the system at the core of it is a it's a very fast system that can has separated storage and computer and has the ability to autoscale and create data mess architectures using data sharing we spend a lot of energy into making very easy and very fast and very efficient to ingest data into this uh to this system uh from the left side for example this week alone we we have been supporting uh streaming ingestion
from Kinesis and managed CF on WS we expanded to uh apachi Kafka confluent Kafka so we making very easy and and fast to inj data from all sorts of sources uh we are putting a lot of energy on zero ETL and then on the other side we make it easy to uh run analytics on that using either traditional dashboards or moving data uh pulling data with data apis or using machine learning and inference uh to to run analytics on your data and that's it uh as we like to uh so what I did is I
came can gave you an overview of where red shift is how it has evolved over the past decade or so when it launched as the first cloud data warehouse uh it has industry leading security and access controls uh a lot of it's leading the performance and scalability race this is a race it's a rat race with a lot of very good competitors out there uh we spent a lot of energy into making the system smart and eliminate the ask the task we are giving to our administrators to our customers to to to have to spend
in order to make the system perform fast uh if we have given a new serverless experience that experience that customers really like and we have a kind of very nice tight integration with a lot of uh different services that comprise the kind of data life cycle and uh as we like to say at AWS it is still day one uh there is a lot of Innovation to happen in the cloud and um obviously we we will have to we are also hiring um uh and that's it thank you so much that's great wonderful let's give
EO a round of applause all right uh questions we can take a couple of questions EO you have a few more minutes to handang yeah yeah yeah of course of course of course come on up introduce yourself stting okay or maybe let's let's see yeah I can stop the share right okay if I can find my mouse here I stop I there we go perfect okay yeah yeah hi a master student here so I have a question regarding to your the organization for Json uh or uh n uh data uh data structure uh I'm asking
like do you do the transformation when you ingest a data or you do the organization when you actually quy it so both things right so once we interest we put them in a in a in a format that allows us this navigation and then then on the query time we we use we we have this uh navigation in order to to to process the data right okay okay I said I said as for another question uh when you do I mean what helps you do the skaing decision right do you see the some metrics like
the CPU utilization memory utilization or you just look at the workload and say oh the work is really large so I SC the cluster out it has been an evolution the answer is yes to all the above uh but but uh it has been an evolution initially when we start started uh we had some very crude rules of hey uh admit end jobs at each point of time right at some point then we start we we with using you know these classifiers we started saying okay uh that is how much CPU you have that's how
much memory this takes that much memory and you we try to piggy back and admit more jobs then there is um there is uh then when we stop admitting jobs We There is some q that it is piling up again we have to make a cost-based decision whether it worth the trouble to pull one autoscale or wait for a while whether a job comes in again we use a prediction there on on in order to make this cost-based decision and then now since last year with the work that the sage team has done uh what
um we are also using models either Global models or local models uh m models to make even better educated decisions not only when to scale but also in what size of cluster to scale on uh so it has been evolving and we become smarter and smarter in order to make it more efficient for our customers okay that's it wonderful okay sounds great EO you managed to get by without talking about Vector databases is that the type of thing that's coming next when you again or what are your should gred okay that sounds great wonderful thank
you avoid AI LMS and vectors for for it for it for for a change in my daytoday life that's wonderful all right thank you EO once again thank you for any have a good one y take care
Related Videos
58:32
AWS re:Invent 2024 - Using multiple agents...
AWS Events
5,457 views
1:29:28
Oracle’s Globally Distributed Database and...
New York Oracle User Group NYOUG
85 views

12:25
‘Stark warning’: See Maddow, Chris, Joy re...
MSNBC
329,066 views
1:17:52
Snowflake
Jignesh Patel
1,187 views
43:02
SQL Extension for Continuous Processiong i...
Jignesh Patel
294 views

12:39
Michelle Obama To Skip Inauguration | Pres...
The Late Show with Stephen Colbert
454,473 views

12:36
Bill Burr on People Online Commenting on t...
Jimmy Kimmel Live
1,639,462 views

2:58:30
AWS Certified Cloud Practitioner COMPLETE ...
Learn2Cloud1017
203,374 views

1:14:20
Evolution of the Storage Engine for Spanne...
Jignesh Patel
2,384 views

59:40
AWS re:Invent 2024 - Deep dive into Amazon...
AWS Events
12,460 views
1:11:00
Systems Design in an Hour
Jordan has no life
39,850 views

1:22:18
Building Production RAG Over Complex Docum...
Databricks
21,566 views

58:35
DuckDB and the future of databases | Hanne...
Posit PBC
1,057 views
1:27:52
Delta Live Tables A to Z: Best Practices f...
Databricks
110,922 views
1:23:49
dbt(Data Build Tool) crash course for begi...
Data Tech
45,050 views

1:23:08
Neo4j (Graph Database) Crash Course
Laith Academy
252,098 views

17:29
Databricks Unity Catalog: A Technical Over...
Pathfinder Analytics
42,360 views

13:10
Trump Nominee Pete Hegseth Grilled Over Dr...
Late Night with Seth Meyers
650,625 views

33:45
AWS Glue Tutorial for Beginners| Learn eve...
AWS Made Easy
47,006 views

19:15
GraphRAG: The Marriage of Knowledge Graphs...
AI Engineer
81,867 views